Home
Search
Collections
Journals
About
Contact us
My IOPscience
Validation of the method of quantitative phase analysis by X-ray diffraction in API: case of Tibolone
This content has been downloaded from IOPscience. Please scroll down to see the full text. 2016 J. Phys.: Conf. Ser. 733 012030 (http://iopscience.iop.org/1742-6596/733/1/012030) View the table of contents for this issue, or go to the journal homepage for more
Download details: IP Address: 200.20.212.15 This content was downloaded on 08/08/2016 at 14:45
Please note that terms and conditions apply.
8th Brazilian Congress on Metrology (Metrologia 2015) Journal of Physics: Conference Series 733 (2016) 012030
IOP Publishing doi:10.1088/1742-6596/733/1/012030
Validation of the method of quantitative phase analysis by Xray diffraction in API: case of Tibolone
R P Silva1,2, M F S Ambrósio1,5, E K Epprecht2, R R Avillez3, C A Achete4, A Kuznetsov4, L C Visentin5 1
Universidade Federal do Rio de Janeiro, Campus de Xerém, 25245-390, Duque de Caxias, RJ – Brasil 2 Pontifícia Universidade Católica do Rio de Janeiro, Centro Técnico-Científico, Departamento de Engenharia Industrial, 22451-900, Rio de Janeiro, RJ - Brasil 3 Pontifícia Universidade Católica do Rio de Janeiro, Centro Técnico-Científico, Departamento de Engenharia Química e de Materiais, 22451-900 - Rio de Janeiro, RJ – Brasil 4 INMETRO, Instituto Nacional de Metrologia, Qualidade e Tecnologia, 25250-020, Duque de Caxias, RJ - Brasil 5 NanoBusiness Informação e Inovação Ltda, 25250-020, Duque de Caxias, RJ – Brasil
E-mail:
[email protected] Abstract. In this study, different structural and microstructural models applied to X-ray analysis of powder diffraction data of polymorphic mixtures of known concentrations of Tibolone were investigated. The X-ray data obtained in different diffraction instruments were analysed via Rietveld method using the same analytical models. The results of quantitative phase analysis show that regardless of the instrument used, the values of the calculated concentrations follow the same systematics with respect to the final errors. The strategy to select a specific analytical model that leads to lower measurement errors is here presented.
1. Introduction The quantitative phase analysis by X-ray diffraction (XRD) of organic solids which compose active pharmaceutical ingredients (API) is susceptible to many factors (instrumental, knowledge of materials properties, and method of data treatment) that influence the final result. The Rietveld method is accepted as the most accurate approach to extract from X-ray data the values of concentrations of phases in phase mixtures [1]. However, the choice of structural and microstructural model in this method of analysis becomes a critical factor from the point of view of its contribution to the errors of calculated concentrations. This situation represents a serious problem for the pharmaceutical industry and regulatory organizations in production and distribution of safe and efficient solid drugs. This study investigates, in a systematic manner, different assumptions about structural and microstructural properties of phases of Tibolone during the data modelling. Tibolone is a synthetic steroid used to relieve hypo-estrogenic symptoms and protect against bone loss in post-menopausal Content from this work may be used under the terms of the Creative Commons Attribution 3.0 licence. Any further distribution of this work must maintain attribution to the author(s) and the title of the work, journal citation and DOI. Published under licence by IOP Publishing Ltd 1
8th Brazilian Congress on Metrology (Metrologia 2015) Journal of Physics: Conference Series 733 (2016) 012030
IOP Publishing doi:10.1088/1742-6596/733/1/012030
women [2]. The general and specific constraints for the reliable quantitative phase analyses were established on the base of multiple experimental data and variable concentrations of phases of Tibolone. 2. Materials and methods 2.1. Sample Preparation Three standard mixtures of known concentrations, referred hereafter as M1, M2 e M3, were prepared using Tibolone pure Form I (commercial) and Form II (prepared according to Araujo, et.al.) [2]. The concentrations of the mixtures are shown in the Table 1. A calibrated analytical balance with the error of indication of -0,01 mg and the expanded measurement uncertainty (coverage factor k = 2) of 0.01 mg was used to establish the real phase proportions in the studied samples. The overall mass of each prepared sample was approximately 1 g. The mixtures were placed in eppendorfs and stirred in vibratory mixer mill for 30 minutes. Table 1 presents the acceptable lower limits (M1, preferably M2) concentrations for a crystalline pure Form I [3], and the expected guess for a detection limit of Form II in Tibolone. Table 1. Sample identification and phase composition. Tibolone (API) M1 M2 M3
Nominal [F1-F2] (%) 90-10 95-5 99-1
Real [F1-F2] (%) 90.09-9.91 94.99-5.01 98.73-1.27
F1= Tibolone Form I and F2 = Tibolone Form II 2.2. X-ray data collection The instruments used for X-ray data collections, their basic configurations, and sample preparation aspects are listed in the Table 2. Table 2. Instruments and sample preparation types used in X-ray experiments. Instruments
Geometry
Tube
Detector
Powder Sample
X’Pert Pro Panalytical1
Reflection, Bragg-Brentano
CuK
PiXcel
Mixed and pressed *Mixed, grinded and pressed
D8 Focus Bruker2
Reflection, Bragg-Brentano
CoK
Scintillator
Mixed and pressed
Agilent Technologies3
Transmission, Debye Scherrer
CuK
Charge-coupled device (CCD)
Mixed powder in capillary
1
NanoBusiness Informação e Inovação Ltda. Inmetro - Laboratório de Difração e Espectroscopia, Divisão de Metrologia de Materiais (DIMAT). 3 Inmetro - Diretoria de Metrologia Aplicada às Ciências da Vida (DIMAV). 2
2.3. Structural and Microstructural models Eight models of Form I and Form II of Tibolone were employed to calculate the concentrations of these phases in the samples. Different constraints for structural and/or microstructural properties of phases distinguish these models (see Table 3). Model 1 assumes the fixed structural parameters for Form I and Form II of Tibolone taken from data base of Cambridge Crystallography Data Centre (No.: Form I 1126814 and Form II 1126815), and isotropic crystallite size peaks broadening (Voigt function) for diffraction peak shape fitting. Subsequent models include other refinement options, as shown in Table 3.
2
8th Brazilian Congress on Metrology (Metrologia 2015) Journal of Physics: Conference Series 733 (2016) 012030
IOP Publishing doi:10.1088/1742-6596/733/1/012030
Table 3. Description of models. Structural and Microstructural Models 1. Isotropic crystallite size broadening 2. Lattice Parameters 3. Texture (spherical harmonics) 4. Hydrogen atoms inserted in Form I 5. Isotropic atomic displacement parameter, Beq 6. Atomic coordinates (constrained to maximum displacement of 0.0016) 7. Anisotropic crystallite size broadening 8. Anisotropic atomic displacement parameters, Uij
Model Constraints 1 2 3 4 5 6 7
8
● ● ● ● ● ● ●* ● ●●●●●●●● ●●●●●●●● ●●●●●●●● ●●●●●●●● ● ● ● ● ● ●# ● ● ● ● ● ● ● ● ●# ● ●●●●●●●●
●Applied or variable ● Not applied or not variable * Applied only to Form II # Applied only to Form I
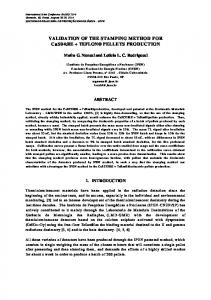
3. Results and Discussion In Figure 1 it is shown the selected diffraction patterns of samples M1, M2 and M3 obtained on instrument 1. Figure 2 shows the experimental X-ray diffraction pattern of M1 sample and the one calculated from the Rietveld refinement of model 8. The use of the latter model results in the excellent agreement between calculated and real concentrations of phases in the sample. Figure 3 summarises the relative errors of the calculated concentrations of Form II for all samples (Table 1) and experimental conditions (Table 2) used in this study. As one can expect, the values of relative errors increase with decreasing concentration of Form II. This is a general trend, which can vary for a particular structural and microstructural model. One can also note that the results obtained on instruments 1 and 2 have markedly better agreement with the real values of concentrations than the ones of instrument 1* and 3. The main distinction between these sets of conditions is the 2 resolution of diffraction peaks. This resolution is worse in case of instruments 3 and 1* due to a low angular resolution of CCD detector and additional crystallite size peak broadening induced by grinding, respectively. The inset of Figure 3 compares the values of real relative errors (the relative differences between the real and calculated concentrations) and standard deviations for concentrations of Form II obtained from Rietveld refinement of a particular model. The calculated and real errors are comparable for models that result in a weighted profile residual (Rwp-factor) bellow 12 and a goodness of fit (GoF) bellow 2 (see Figure 4).
3
8th Brazilian Congress on Metrology (Metrologia 2015) Journal of Physics: Conference Series 733 (2016) 012030
IOP Publishing doi:10.1088/1742-6596/733/1/012030
Form II
Form II
Figure 1. Diffraction patterns of M1, M2 and M3 samples. Inset emphasises the 2 regions of two not overlapped peaks of Form I and Form II.
Figure 2. Experimental (black curve), calculated (red curve) and difference (grey) from Rietveld refinement (model 8) XRD patterns of the sample M1. Form I (green curve) and Form II (blue curve)
4
8th Brazilian Congress on Metrology (Metrologia 2015) Journal of Physics: Conference Series 733 (2016) 012030
Relative Errors w/w (%)
1200
1,0 0,8 0,6 0,4 0,2 0,0
40 20 0
1
1100
2
1000
3
M3
4 5 Models
6
7
100 80 60 40 20 0
1,0 0,8 0,6 0,4 0,2 0,0
8
1
2
3
4 5 Models
6
7
Relative Errors (%)
1300
60
Relative Errors (%)
1400
Relative Errors (%)
1500
M2
M1
1600
IOP Publishing doi:10.1088/1742-6596/733/1/012030
250 200 150 100 50 0
8
0,8 0,6
0,4 0,2
0,0 1
2
4 5 Models
6
7
8
Rietveld Errors
Rietveld Errors
Rietveld Errors
3
900 800 700 600 500 400 300
200 100 0
M1
M2
M3
M1
Instrument (1)
M2
M3
M1
M2
Instrument (1)*
Model 1
Model 2
Model 3
M3
M1
Instrument (2)
Model 4
Model 5
Model 6
M2
M3
Instrument (3)
Model 7
Model 8
Instrument 1* 5 , , ,
M1 M2 M3
4 3 2 1 0
2
3
4
5
6
7
1 0 2
3
M1 M2 M3
4
2
Rwp
3
GoF
Rwp
5 , , ,
1 0 4
5
5
6
7
8
Instrument 3
Instrument 2
3
4
Model
34 32 30 28 26 24 22 20 18 16 14 12 10 8 6 4 2 2
4
2
Model
1
M1 M2 M3
3
1
8
5 , , ,
6
7
, , ,
M1 M2 M3
30 25 20 15 10 5
1
8
35
34 32 30 28 26 24 22 20 18 16 14 12 10 8 6 4 2
GoF
1
34 32 30 28 26 24 22 20 18 16 14 12 10 8 6 4 2
GoF
Instrument 1
30 28 26 24 22 20 18 16 14 12 10 8 6 4 2
GoF Rwp
Rwp
Figure 3. Relative errors in concentration. The three extended figures is from measures in the instrument 1.
2
3
4
5
6
7
8
Model
Model
Figure 4. Rwp and GoF indexes (Rwp = wm(Yo,m-Yc,m)2/wmYo,m2; GOF = chi2 = Rwp/Rexp).
5
8th Brazilian Congress on Metrology (Metrologia 2015) Journal of Physics: Conference Series 733 (2016) 012030
IOP Publishing doi:10.1088/1742-6596/733/1/012030
4. Conclusion The obtained results showed that a good resolution of X-ray diffraction data is a necessary condition for reliable quantitative analysis of polymorphism in Tibolone. The Rietveld method of analysis of diffraction patterns gives reliable estimations of concentrations of Form II with respective errors for concentrations above 5 % w/w. The modelling of microstructural (texture) and structural (H atoms, ADPs) features was required to achieve this result. Additional models sophistications, such as consideration of anisotropy of crystallite size broadening and anisotropy of ADPs may be necessary to obtain reliable results in case of lower concentrations of Form II. Acknowledgments The e-Diffraction Lab from NanoBusiness Company is grateful to the agencies CNPq, FAPERJ and to INMETRO for the collaboration in this research. An especially acknowledgment to Daniel Giacometti by management support in this project. 5. References [1] Young R A 1993 Introduction to the Rietveld method. - The Rietveld Method (Oxford: Oxford University Press - IUCr Book Series) pp 1-39. [2] Araujo G L B, Faria D L A, Zaim M H, Carvalho F M S, Andrade F R D and Matos J R 2010 J. Therm. Anal. Calorim. 102 233 [3] Akzo Nobel N.V. G A J M T Sas et. al. Pharmaceutical composition which contains a pharmaceutically suitable carrier and the compound having the structure (7α,17α)-17- hydroxy-7methyl-19- nor-17- pregn-5(10)- en-20- yn-3- one. EP0389035A1, 12 mar. 1990, 26 sep. 1990.
6