Sep 18, 2001 - Kapamiringi atoll. The dataset we used ...... Aur. Namorik. 0 100 200 300 km. Longitude. Latitude. T. OPEX track 225. Coverage of Kwajalein ...
Validation of the TOPEX rain algorithm: Comparison with ground-based radar A.C. McMillan1,2, G.D. Quartly1, M.A. Srokosz1 and J. Tournadre3 1 - Southampton Oceanography Centre, Southampton, UK 2 - Department of Physics, University of Surrey, Guildford, UK 3 - Institut Français de Recherche pour l'Exploitation de la Mer, Brest, France (Submitted to J. Geophys. Res 21st May 2001; revised: 18th September 2001.)
Abstract Recently-developed algorithms have shown the potential recovery of rainfall information from spaceborne dual-frequency altimeters. Given the long mission achieved with TOPEX and the prospect of several other dual-frequency altimeters we need to validate the altimetrically-derived values so as to foster their integration with rain information from different sensors. Comparison with some alternative climatologies shows the bimonthly means for TOPEX to be low. Rather than apply a bulk correction we investigate individual rain events to understand the cause of TOPEX’s underestimation. In this paper we compare TOPEX with near-simultaneous ground-based rain radars based in a number of locations, examining both the detection of rain and the quantitative values inferred. The altimeter-only algorithm is found to flag false rain events in very low wind states (less than 3.8 ms-1); the application of an extra test, involving the liquid water path as sensed by the microwave radiometer, removes the spurious detections. Some false detections of rain also occur at high wind speeds (more than 20 ms-1), where the empirical dualfrequency relationship is less well-defined. In the intermediate range of wind speeds, the TOPEX detections are usually good, with the instrument picking up small-scale variations that cannot be recovered from infrared or passive microwave techniques. The magnitude of TOPEX's rain retrievals can differ by a factor of two from the ground-based radar, but this may reflect the uncertainties in the validation data. In general, over these individual point comparisons TOPEX values appear to exceed the 'ground truth'. Taking account of all the factors affecting the comparisons, we conclude that the TOPEX climatology could be improved by, in the first instance, incorporating the radiometric test and employing a better estimate of the melting layer height. Appropriate corrections for non-uniform beamfilling and drizzle fraction are harder to define globally.
1. Introduction Presently global rain information is provided by infra-red and passive microwave satellite instruments, with the Precipitation Radar (PR) on TRMM only recently being added to the armoury of available sensors. However, as rain varies on such short spatial and temporal scales there is a need to incorporate all available measurements. Dual-frequency altimeters provide an estimate of the quantity of raindrops within the atmospheric column, through the observed attenuation of radar pulses. Use of a simple threshold on the attenuation generates the familiar geographical patterns of precipitation, including their seasonal movement [Quartly et al., 1996; Chen et al., 1997]. Because of their small footprint and fine spatial sampling along-track there is the potential to recover information on the size and structure of rain cells [Tournadre, 1998; Quartly, 1998; Quartly et al., 1999]. However Quartly et al. [1999] found regionally-averaged mean rain rates from the TOPEX data were significantly less than the estimates from the Global Precipitation Climatology Project (GPCP, Huffman et al. [1997]). The shortfall amounted to 30% at the tropics and more than 50% at higher latitudes. A number of explanations were suggested by Quartly et
al. [1999]; to distinguish between them we need to examine individual rain events using simultaneous rain data from another source. In this paper we consider ground-based rain radars in a number of locations which can provide high-resolution 'ground truth' data. Section 2 of this paper summarises the TOPEX rain algorithm, highlighting the assumptions involved, and section 3 details the ground radars used and the necessary processing. A number of interesting case studies are shown in section 4, along with a quantitative comparison for all the data sets, with conclusions being provided in the final section.
2. Deriving rain rates from the TOPEX altimeter Altimeters measure the height of the sea surface through the detection and accurate timing of electromagnetic pulses reflected from the surface. Because they only use the earliest part of the echo, all information is from nadir; however this 'pulse-limited' operation allows a much smaller footprint (~8 km across) than achievable by passive sensors whose resolution is limited by diffraction. One of the parameters derived from the echo is the normalized backscatter coefficient, σ0. This is dependent on the small-scale roughness of the surface at the centimetric scale. Generally there is a very close correspondence between the roughness calculated at different scales: an increase in wind stress will increase the roughness at all small scales, even if not all to the same extent. Therefore there exists a very close correlation between the σ 0 values recorded by TOPEX at its two operating frequencies in the Ku-band and C-band. The presence of atmospheric liquid water (both cloud and rain) will lead to attenuation of the Ku-band signal; thus any departure form the general σ0C-σ0Ku relationship may be ascribed to the effect of intervening water. However, this effect, which depends upon scattering, is very sensitive to the size of the water droplets; for the frequencies of interest the effect of cloud droplets is usually minimal [Monaldo et al., 1986]. Therefore, the deviation ∆σ0 (in dB) may be used to infer the rain rate, R, (in mm hr-1) via ∆σ0 = 2kH = 2HaRb (1) where H is the height of the rain column (in km), through which the radiation passes twice, and a, b are the coefficients to give specific attenuation, k,(in dB km-1) as a function of rain rate. The values used by Quartly et al. [1999] and by us in our comparisons here are a= 0.02038 dB km-1, b=1.203, taken from observations by Goldhirsh and Walsh [1982] at a mid-latitude coastal location. The physical model indicates a simple and direct relation between the observed attenuation and the rain rate present. The only problems are the uncertainties in ∆σ0, H, a and b. These are discussed in turn. 2.1 Errors in ∆σ0 The observed attenuation, ∆σ0, is given by the deviation from the normal σ0C-σ0Ku relationship [Quartly et al.,1996; Chen et al., 1997]. Following the work of Elfouhaily et al. [1998], a correction for wave height needs to be applied (see Table A1 of Quartly et al. [1999]). During the first 5 years of the TOPEX mission there was a 0.25 dB limit on the precision of σ0 measurements. That, coupled with the observed scatter of rain-free points about a mean relationship, suggested a minimum detection threshold of between 0.25 and 0.5 dB. Based on a typical height H of the rain column of 4.5 km (see below) this means that a 0.5 dB detection threshold translates into a rain-rate detection threshold of 2.3 mm hr-1 (0.25 dB is equivalent to 1.3 mm hr-1). This means that as much of the rainfall, particularly at mid-latitudes has rain rates that are lower than these threshold values it will not be accounted for in the altimeter estimates. However there is also a question as to whether it is appropriate to use a relationship between different roughness scales determined under rain-free conditions as the reference for calculating the change in σ0Ku due to attenuation. Atlas [1994] observed strong gusts in SAR imagery, which were associated with the downdraft caused by rain. However, provided the roughness is in equilibrium with the wind, which is quickly achieved at the small scale, the same σ0C-σ0Ku relationship should exist. Tsimplis and Thorpe [1989] have shown that rain can damp the small-scale roughness on the sea surface. This translates into enhanced backscatter, i.e. an increase in σ0, which has been clearly observed on the edge of some rain cells [Guymer et
al., 1995; Quartly et al., 1996]. It is likely that rain often affects the surface roughness in the midst of the rain events, but it is not clear whether the Ku-band signal is enhanced more than the C-band one. 2.2 Errors in H In our previous work [Quartly et al., 1999] we have taken H to be the melting layer height (MLH), and assumed a value for that of 5 km. In this work where we are striving harder for a quantitative comparison we have used a value of 4.5 km throughout. This value agrees well with observations of tropical rain radar [Thurai and Iguchi, 2000], and is consistent with the typical height of the 0˚C isotherm based on surface waters of ~28˚C. Clearly at higher latitudes, where the sea temperatures are cooler, the 0˚C isotherm will lie at a lower level and will vary seasonally. Recent estimates of the melting layer height from the first 14 months of TRMM data concur [Shin et al., 2000]; they also note some interannual variation, with the melting layer being somewhat higher during periods of enhanced precipitation activity. Unfortunately the TRMM dataset does not provide estimates in the higher latitudes. However for individual storms the height of the rain column may lie well above the seasonal climatological value for the 0˚C isotherm. Chiu and Chang [2000] found a similar geographical pattern from analysis of SSM/I data. They determined H to be around 3.5 km at 50˚N and 50˚S, which was significantly higher than the height of the 0˚C isotherm in the climate model they examined. Thus in the comparisons shown here we have used H=4.5 km throughout, but note that a lower value (implying higher rain rates via Eq. 1) may be more appropriate in temperate climes. Note, as the total accumulation varies as H-1/b, the effect of an alternative choice for the MLH is easily computed. 2.3 Uncertainties in a and b Strictly one should relate the rainfall rate to the differential attenuation between the Ku-band and Cband, but as the effect at the lower frequency is an order of magnitude lower it has been ignored for now. However there is a debate as to which are the most appropriate constants to use. Tournadre [1998] uses a=0.0314, b=1.14, which values are taken from a modelling exercise by Slack et al. [1994]. The attenuation effect of rain depends upon the temperature of the rain and the drop size distribution (DSD). The observations of Goldhirsh and Walsh [1982] agree fairly well with modelling of the Marshall-Palmer (MP) DSD, but alternative DSDs, such at the "widespread" distribution of Joss et al. [1968] produce 12.5% less attenuation for a given rain rate [Olsen et al., 1978]. TOPEX only detects rain rather than general precipitation, because at these frequencies attenuation by hail or snow is negligible. However melting ice particles can produce up to twice the attenuation of liquid particles [see Gunn and East, 1954], as the liquid shell surrounding a frozen particle is an extremely effective scatterer. Enhanced attenuation is also reported for wet snow [Oguchi, 1983]. Clearly the appropriate k-R relation may vary with location, season and stage of the storm. In what follows we will attempt to untangle the various possible error sources detailed above. This will be done by examining individual rain events 'seen' simultaneously by TOPEX and by ground-based rain radars. Any differences between rainfall estimates should allows us to determine which of the above error sources are affecting the TOPEX measurements.
3. Ground validation datasets For a meaningful intercomparison of satellite and ground truth data they must be compared over the same area and at nearly the same time. As the TOPEX algorithm is only applicable over oceans, and then more than 10 km from the coast to avoid land entering into the altimeter footprint, the validation dataset is limited to other satellite data and ground-based rain radars whose range covers the TOPEX ground track at sea. In this paper we concentrate on the use of ground sites for validation. We obtained data from two tropical sources (both in the western to central Pacific) and two mid-latitude sources (both in the UK). Some
simultaneous radar scans were scheduled on the Chilbolton radar (see section 3.4), but for other datasets we had to use available archived data that coincided within 10 minutes of a TOPEX pass. 3.1 TOGA-COARE During December 1992 to March 1993, two ships with calibrated rain radars were sited in the west Pacific (see Fig. 1), as part of the TOGA-COARE program’s Intensive Flux Array (IFA). Data from these radar were collected every 10 minutes, with the radar values calibrated with respect to gauges in the Kapamiringi atoll. The dataset we used was a composite rain rate from the 2 radars regridded at 2 km by 2 km and provided to us by the University of Washington. Further details about the rain radars and their processing are given in Short et al. [1997] and Rickenbach and Rutledge [1998]. 3.2 Kwajalein The meteorological radar station on Kwajalein, Republic of the Marshall Islands (see Fig. 2) has been upgraded as part of the ground validation campaign for TRMM. Consequently, easily obtainable data have only been available since 1997, although numerous operational issues caused intermittency in the first few years. 3.3 British Isles In order to help with weather forecasting in the UK, there is a network of rain radars covering the British Isles and surrounding seas out to more than 100 km (Fig. 3). Scans have been taken every 15 or 30 minutes. We were granted access to the archived data, which are on a 5km by 5km grid. 3.4 Chilbolton Advanced Meteorological Radar The Chilbolton Advanced Meteorological Radar (CAMR) is one of the most accurate rain radars available on account of its dual-frequency and dual-polarization capabilities [Goddard et al., 1994] It was used as part of a planned validation campaign to record rain rates at the predicted time of TOPEX’s passes. Unfortunately its inland location does not give much clear coverage of TOPEX’s tracks at sea (see Fig. 4) especially since intervening hills limit the azimuths for which viewing can be below the height of the melting layer. At the range of interest, the resolution of its data is 0.4 km. During the 3 years of this campaign only 6 incidents of rain were recorded at the time of a TOPEX overpass. All of these were below the TOPEX detection threshold. 3.5 Calculation of representative averages An important issue for almost all satellite sensor measurements is the handling of Non-Uniform Beam Filling (NUBF). This occurs whenever there is a non-linear relationship between what is actually being measured (in this case the attenuation) and what is being derived (rain-rate). Variations on a scale smaller than the satellite footprint produce a measurement error due to the fact that the average attenuation converted to rain-rate does not equal the average rain-rate. In these comparisons, one may compensate for NUBF, insofar as the resolution of the ground-based datasets is greater than that of the TOPEX data. To do this, instead of averaging the rain-rates in a groundbased sample, these rain-rates were first converted to equivalent amounts of attenuation using Eq. 1, averaged and converted back to rain-rate. We use the term 'homologous average' to describe the resultant quantity. By using homologous averages in these comparisons, we can largely remove the measurement error due to NUBF, thus making the other sources of error easier to identify. The error due to NUBF is treated separately in the Appendix. At low wave heights, the instantaneous footprint of the TOPEX altimeter is a disc ~8 km in diameter. Data are provided for 1-second averages, during which time TOPEX travels ~6 km, giving an effective footprint that is thus elongated in the along-track direction, with non-uniform weighting over the
observation interval. For the TOGA-COARE case, it is sufficient to approximate this footprint by calculating the homologous average over the thirteen 2km-by-2km squares illustrated in Fig.5. For the dataset surrounding the British Isles, we simply used a weighted, homologous average of the proportion of each grid square within the nominal TOPEX footprint, as the resolution of the groundbased radar product was similar to that of TOPEX. 3.6 Inherent errors in ground-based systems One problem in comparing rain rates from satellite- and ground-based radars is that they have been recorded in very different ways, and the ground-based data cannot be considered as absolute truth. All the ground-based radars use the reflectivity of the rain to infer rain rate, but that method is more sensitive to assumptions about the drop size distribution and temperature of the rain [Slack et al., 1994]. For example, for the TOGA-COARE data the inferred rain for a give reflectivity varies by a factor of 2 according to whether the rain system was classified as convective or stratiform. In a comparison between land-based radars and rain gauges, Brandes et al. [1999] noted that the relative bias of the radars could vary by more than a factor of two between storm events. Ulbrich and Lee [1999] also noted significant variation between rain radars and collection gauges, and ascribed the difference as due to uncertainties in both the radar calibrations and the choice of an appropriate rainfall-reflectivity relationship. 3.7 Other effects It is possible that other effects influence the comparison. For example, the rain radars typically measure the rainfall at some level in the atmosphere (2km for the TOGA-COARE ones), while the altimeter measures the whole atmospheric column below it. It is not clear how to take account of vertical variations in the rainfall with the data available to us, but these might influence the comparison. If the rain is not falling vertically, due to wind effects, then at the edge of a rain event the altimeter may be underestimating the rainfall due to the assumption that the height of the rain cell is uniform. It will also 'see' a larger rain cell as the top of the cell will be displaced horizontally relative to where the rain hits the sea surface.
4. Results of Comparisons In this section we first discuss the results for the individual ‘ground truth’ datasets in turn, albeit that two of them are null comparisons. The case studies selected show some of the good and poor comparisons, illustrating the circumstances under which the TOPEX-derived rain values may be less trustworthy. 4.1 Comparisons with TOGA-COARE The shipborne rain radars were in operation for approximately 13 weeks, with 2 TOPEX tracks crossing the region every 10 days. However of the 18 instances when both TOPEX and the rain radars were working, 11 of them showed no appreciable rain in either dataset. Of the others, 4 passes had intense rain in both datasets and 3 showed only 'rain' in the TOPEX values. One of the good comparisons is illustrated in Fig. 6. The background value for σ0Ku is around 10 dB, which implies a wind speed of around 12.2 m s-1. 0 The σ Ku shows a steep drop at 3.0˚S with the derived attenuation of 7.4 dB implying an areal average rain rate of 22 mm h-1 (Fig. 6c). The rain rates from the shipborne radar (degraded to the same spatial resolution as TOPEX, as discussed in section 3.5) show the same shape profile and of similar magnitude (peaking at 16 mm h-1) but displaced by about 6 km along track. The discrepancy in position is not believed to be in the ground data, as the subsequent radar scan showed little movement of the features, and there is no reason for the ship’s positioning to have a large bias. Neither can obliquely-falling rain explain this mismatch, since TOPEX measurements are an average over the rain column (assumed 0 to 4.5 km) and the ship radar values are those for 2 km above sea level. Examination of the altimeter waveform data (not shown here) shows that as the intense rain affects the shape
of the returned radar pulse, the positioning of the tracker window is affected, leading to complications in the interpretation of the σ0 data. This particular incident can be resolved by recalculating the σ0 values for the section using retracked waveform data, but such is not an easy option for many users of altimeter data, owing to the size and complexity of the waveform dataset. A further point to be noted from Fig. 6c is that although some of the rain rate values lie below the TOPEX detection threshold, there is nevertheless similarity in behaviour between the ground-based radar and TOPEX profiles in shape, if not in absolute value. This behaviour also occurs in other comparisons (see, for example, Fig. 8c below). This suggests that the detection threshold of 0.5 dB chosen by Quartly et al. [1999] may be too high (but it is difficult from these limited results to deduce what a better threshold might be). A poorer comparison is shown in Fig. 7. The background level of σ0 is ~13 dB (equivalent to a wind speed of 3 ms-1), but for the region between 4.0˚ and 4.5˚S both Ku- and C-band values are increased. As the changes in σ0 do not coincide exactly, the implied attenuation shows extremes of both signs; only the negative values can be interpreted as rain rates. These anomalous increases in σ0 may be due to a surface slick or very calm conditions. It is interesting that the shipborne radar indicates rain to be present at 4.2˚S i.e. where the ∆σ0 values are positive rather than negative. Thus although both measurements show similar width events (Fig. 7c), the 'detection' by TOPEX may be fortuitously due to attendant calm winds; a simple quantitative comparison shows no correlation between them. There were also three TOPEX transects which indicated rain when there was no signal in the rain radar data. All these cases correspond to high background values of σ 0. In such circumstances there is found to be a much higher spread of values about the mean σ 0C-σ0Ku relationship [Quartly et al., 1996; Tournadre and Morland, 1997], and thus spurious large values of ∆σ0 of both signs are more common. At low wind speeds the correlation length of wind variations is much shorter and thus there may be independent 'patches' within the altimetric footprint. The average of the backscatter values for the different patches can be significantly different from that when all patches have the same (average) wind speed. This explains the large scatter in the simultaneous observations of σ0 and wind speed in calm conditions [Carswell et al., 1999], and similarly the greater scatter in σ0C-σ0Ku relationship in that regime. 4.2 Comparisons with Kwajalein The Kwajalein radar has not been in continuous use. In the time since its commissioning in 1997 it has only been performing scans near the time of nine TOPEX overpasses. All those showed no detection of rain by the Kwajalein radar. For about half the passes TOPEX did show significant negative values of ∆σ0, but these all lay at the location of Namu (see Fig. 2), and it is conjectured that this intermittent effect is due to the tides sometimes exposing the northwestern edge of this island. With these incidents discounted, both TOPEX and Kwajalein records concur. However this result is merely a null comparison showing that TOPEX does not produce any spurious detections of rain here. 4.3 Comparisons with UK rain radar From our satellite records we selected 34 cases where TOPEX showed a significant drop in ∆σ0 within the coverage of the rain radars, and obtained the 'ground truth' data for these cases. Of these 19 showed rain in the validation dataset, with Fig. 8 being a good example showing not only that TOPEX is detecting rain in the same places as the ground-based radar, but the recovered length scales and intensities are very similar. However, of the other comparisons, some showed much higher intensities for TOPEX than the ground system, and others vice versa. Figure 9 shows one of the poor comparisons, where the ground radar shows no rain. It is noted that once again the spurious detections of rain by TOPEX (∆σ0 dropping below -0.5 dB) are associated with low winds (high σ0), where the returned values of σ0 are changing sharply along track. For this dataset, false
detections only occurred for background σ 0 values above 14 dB (wind speeds less than 1.5 ms-1 ). Examination of all cases also reveals a few spurious detections at high wind speed (greater than 20 ms-1), where again the σ0C-σ0Ku relationship shows more scatter.
5. Developing an accurate climatology In this section we discuss the two key issues affecting the accuracy of a TOPEX-derived rainfall climatology; these are, first, the quantitative inference of rain rate from the attenuation caused by a genuine rain event, and, second, the minimization of the number of false detections of rain. 5.1 Quantitative comparison Figure 10 shows a summary of the simultaneous rain observations by TOPEX and the TOGACOARE and UK rain radar systems. Despite the good recovery of rain profile information in some cases (e.g. Figs. 6 and 8) and the use of a σ 0 threshold to throw out spurious TOPEX values (as discussed in sections 4.1 and 4.3), there is a great deal of scatter about the mean relationship. The case illustrated in Fig. 6 has the highest rain rate of any of the comparisons in that region; the mismatch in location thus has a particularly pronounced effect on Fig. 10a, giving rise to points both significantly above and below the mean line. Although many of the examples in the UK coastal region show that TOPEX has recovered the spatial structure of variations (as in Fig. 8), in some cases TOPEX underestimates the magnitudes for the whole profile and in others it overestimates. The temporal variation in H (melting layer height) could be a key factor: when H is lower than normal, the attenuation (for a given rain rate) will be reduced and TOPEX will return underestimates of the rain rate. The use of a monthly climatology of H could improve the accuracy of TOPEX rain rates, although this is poorly determined in high latitudes and Wilheit et al. [1991] noted that in thunderstorms precipitation may be in the liquid phase well above the climatological height of the melting layer. However, also at issue is the reliability of the land-based radars, as discussed in section 3.6. The quantitative comparisons shown in Figure 10 do exhibit a lot of scatter, but this is typical for remote-sensing of precipitation. Brandes et al. [1999] have shown that results from a pair of horizontal weather radars can have a mismatch of ~10% when observing the same rain event. Here we are comparing two measurements that have different sensitivity to drop size distribution — reflectivity from a horizontallooking radar and attenuation observed by a vertical-looking system — thus the degree of scatter will be expected to be greater. The large apparent bias between the TOPEX and TOGA radars (Fig. 10a) is initially a little surprising. A possible cause is errors in classification within the ground-based radar data, since for a given reflectivity the inferred convective rainfall is only half that inferred assuming stratiform rain [see Short et al., 1997]. For example, for TOPEX cycle 7 pass 86 (not shown) there is a good match-up in location and structure of the rain band with that shown in the TOGA radar data, only the latter are only 35% of the magnitude of the former. A further adjustment could be achieved by changing the values of the parameters a and b used here (0.02038, 1.203) for those adopted by Tournadre [1998; 0.0314, 1.14]. Over the range of ∆σ0 from 0.5 to 5 dB the values used by Tournadre give rain rates that are 20-28% smaller (assuming a value for H of 4.5 km). However another aspect is the stability?? of the calibration of the shipborne radars. In a study comparing the TOGA radar data with a large number of passive microwave and infra-red/visible algorithms, Ebert and Manton [1998] found that the majority of the satellite algorithms inferred rain rates significantly greater than those from the shipborne radar, with several overestimating by more than a factor of two, Given that none of these other satellite algorithms involved active microwave sensing, there is no reason to assume that the ground data are 'absolute truth' and that all the satellite estimates are biased high.
The similar magnitudes noted in the TOPEX comparison with the UK coastal radar network (Fig. 10b) are unexpected in that the value of H used was significantly above the climatological average for that location, which should have caused an underestimation of the rainfall by TOPEX. Again individual TOPEX passes show a good recovery of the spatial structure of rain, but with some passes apparently biased high and some low, leading to a lot of scatter. This is probably caused by both variations in the height of the rain column (which can be different to the climatological value of H), and to changes in calibration of the ground-based radars (as the network involves a large number of sites, and the comparison has been with data spanning a number of years). However, when considered over several years, the UK rain radar data are unlikely to be biased. They are frequently calibrated with respect to measurements from collection gauges, albeit only over land. However the data we have used for validation were principally from close to the operating range of these radars, so errors in their propagation model could mean that this validation dataset underestimates the rain. 5.2 Improving the reliability of TOPEX's rain flagging Many of the individual case studies (e.g. Figs, 6 and 8) have demonstrated that not only is the TOPEX altimeter sensitive to rain, but that it can give reasonable quantitative results, revealing rainfall structure at a scale of 6 km along track. Tournadre [1998] and Quartly [1998] have suggested that a slightly better resolution may be achieved with the more detailed altimeter waveform data. However there are a number of other cases, where the results from a simple TOPEX analysis are not reflected in the ground-truth data (cf. Fig. 9). These are typically in regions where the background values of σ0C and σ 0Ku are already quite high. These anomalous detections of rain appear to be due to a change from the simple σ 0Ku-σ0C relationship for dry conditions. Elfouhaily et al. [1998] noted that in low winds the mean σ 0Ku-σ0C curve varied with wave height (or in effect with sea state development); however we have used the adjustments of Quartly et al. [1999] to compensate for the mean effect of wave height. Carswell et al. [1999] pointed out that the spatial scales of fractional change in wind are much smaller in low-wind conditions. As the backscatter is a non-linear function of wind speed, altimeter footprints with the same mean wind speed can have different values for mean reflectivity i.e. σ0. For the quantitative comparisons of rain rate from TOPEX and ground-based radars, we used a σ0 threshold to remove all such false detections. However use of such a criterion in the production of global climatologies will reduce coverage substantially in many regions. [ For example, for the equatorial band 10˚S to 10˚N around 10% of observations correspond to an unattenuated σ0Ku greater than 14 dB (wind speed less than 1.5 ms-1). ] There are various manners in which one can amend the TOPEX rain detection algorithm, each with their own drawbacks. i) Ignore all significant ∆σ0 levels where the background σ0Ku exceeds some threshold, say 14 dB. This, however, eliminates any detection of rain in low wind regimes, which are common in the tropics. ii) Set a ∆σ0 threshold that is a function of σ0, such as a number of standard deviations away from the mean. This is equivalent to setting the proportion of time raining to a constant for any wind speed condition, and would not be sufficient to discard the spurious 'rain detection' shown in Fig. 8. iii) Require the candidate event also to pass some low threshold on atmospheric liquid water path (LWP), as detected by the on-board microwave radiometer. This runs contrary to the ethos of an altimeter-only detection, and could be biased against small intense events that only occupy a tiny portion of the broad microwave footprint. In the light of many case studies, the most practicable amendment appears to be to combine the altimetric test with coincident passive microwave detection, as advocated by Tournadre and Morland [1997]. Although the incorporation of data from the 40 km footprint TMR would appear to bias against the detection of small events, Tournadre et al. [2000] showed through simulation that the adoption of a low threshold (liquid water path to exceed 0.2 mm) would suffice for the detection of rain cells larger than 5 km in diameter, without giving erroneous detections of rain.
Our findings here complement the work of Cailliau and Zlotnicki [2000], who used the SSM/I as their validation dataset. They found a number of 'false' detections of rain by TOPEX, even after the incorporation of the additional test on LWP. However, in many cases it could have been that TOPEX was responding to a narrow rain cell not observable in the coarse SSM/I dataset. They did not attempt to assess rain rates derived from TOPEX data. 5.3 Discussion of errors and comparison of climatologies There are a large number of errors that cause the scatter in observations shown in Fig. 10. For the first half of the TOPEX mission, σ0 measurements were recorded to a precision of 0.25 dB; this leads to an r.m.s. error in each of 0.25/√3 dB, giving a combined error in the determination of ∆σ0 of about 0.2 dB. It is also possible that local changes in the σ0C-σ0Ku relationship caused by differing sea state development and wave damping by rain may lead to errors of similar magnitude, although there are no reliable in situ measurements to confirm these effects. The initial impetus for this study was the observations by Quartly et al. [1999] and McMillan [2000] that the zonal mean rain rate from TOPEX was less than those from the GPCP (Global Precipitation Climatology Project) multi-satellite dataset and the SOC version of COADS (Comprehensive OceanAtmosphere Data Set). In the tropics the TOPEX estimate was ~30% less than the others, and at higher latitudes the underestimation by TOPEX was more pronounced. So what insight has the current study given into this discrepancy? Given the uncertain calibration of the TOGA-COARE radars, it is difficult be sure that TOPEX's instantaneous observations are biased high. From our analysis in the appendix, we note that allowance for NUBF (non-uniform beamfilling) would add of order 30% to the rain rates perceived by TOPEX. Analysis of the TOGA-COARE radars also suggests multiplication by another factor of 1.3 to allow for the proportion of rainfall that occurs at low rain rates (less than the altimeter detection limit of 2.1 mm hr-1). [ Note, if one were to decide that the rain rates in the TOGA-COARE dataset should be increased by a factor of, say, two, then the 'drizzle fraction' would be markedly less. ] Offsetting these two causes for an increase in the TOPEX climatology, is the observation that the simple altimeter-only scheme used in the climatology of Quartly et al. [1999] inadvertently flags many points that are actually free from rain. Assuming the factors for NUBF, drizzle fraction and false-flagging determined from this specific site can be extended to the whole of the tropics, then the net change to the TOPEX climatology is close to a factor of one! Note, in general, the undetected rain cannot be 'cancelled out' by false detections of rain, since the latter will occur predominantly in regions of light winds rather than light rain. Thus it is also important that the number of spurious detections is minimized by using the extra information from the on-board microwave radiometer. Thus from the work of Quartly et al. [1999] we still find that the TOPEX climatology gives a peak rain rate in the latitudinal section at 4˚N of 150 mm month-1, as opposed to GPCP's value of 200 mm month1 . However, Kummerow et al. [2000] show that TRMM now puts this value in the range of 120 month-1 for the Precipitation Radar to 180 month-1 for the TRMM Microwave Imager, nicely bracketing our value for TOPEX. It is harder to explain our results for high latitudes. Clearly an appropriate choice for the height of the rain column is important; if the actual height of the rain column in only half of the value assumed in the processing, then the derived rain rate will be 44% less than the correct one. One possibility is to use a climatology of melting layer height (MLH); however that can be close to sea level at high latitudes, whereas there may be liquid water in the clouds well above this climatological height. Alternatively, one may attempt to derive the current MLH from passive microwave data [Wilheit et al., 2000]. Chiu and Chang [2000] suggest a value of 3.5 km for 50˚N; this would make only a moderate improvement to the low values obtained at high latitudes in the TOPEX climatology. If a lower height still were invoked, then a large bias would be present in the comparison with the UK coastal radar. However, the NUBF, drizzle fraction and false-flagging factors need not be the same in high latitudes as in the tropics. In particular the drizzle fraction would be expected to be larger in a region with lower average rainfall. In short, although the TOPEX climatology can be adjusted to minimise false-flagging and have an approximately correct
prescription for MLH, there are still a number of factors unobtainable from TOPEX data that affect the derivation of a TOPEX climatology, and these will vary to some extent on a regional basis and possibly with season. There is also some debate as to the most appropriate values to use for the constants a and b in Eq. 1. The values advocated by Tournadre [1998] give rain rates approximately 25% less than the values used here. It was hoped that the individual point comparisons detailed here would help address this error. However, the uncertainties in the ground-based radar's rain rates preclude any definite conclusions on this matter. In this paper we have undertaken the challenging task of validating our rain estimates in two very different climes — a task often avoided by many. In summary, it is not clear how one balances the apparent good comparisons of instantaneous measurements in high latitudes with the apparent underestimate in the GPCP climatology for that region. Unfortunately, TRMM does not measure as mid-latitudes so its data cannot help resolve this problem.
6. Summary This paper has made use of a number of ground-based radars, both in the tropics and at midlatitudes, to validate TOPEX's measurements of rain rate. The infrequency of rain, coupled with TOPEX's only occasional passes across a site meant that 2 of the 4 sites provided no simultaneous observations of rain. However the long periods of frequent scans by the TOGA-COARE and UK rain radar systems have provided many records within a few minutes of a TOPEX pass. When the ground radars showed significant rain this was usually picked up by TOPEX. However in low wind conditions the simple ∆σ0 algorithm for the satellite also produced many 'false positives' i.e. spurious detections of rain. The incorporation of an additional passive microwave test is recommended in order to minimize this problem. Quantitative estimates in the tropics appear high, whereas the TOPEX estimates of rain in midlatitudes seem unbiased. However absolute magnitudes are difficult to verify as there may be significant errors in the 'ground-truth' data (due to the choice of rainfall-reflectivity relationship and changes in radar constants with time) and a variety of difficult to account for factors that affect the TOPEX estimates. We are presently investigating the possibility of using TRMM (a satellite dedicated to the measurement of precipitation) as a possible 'ground truth' dataset. It should enable validation over a wider range of conditions, albeit limited to a narrow latitudinal band. However, it should be noted that the validation of TRMM data is, in itself, an as yet far from solved problem [Kummerow et al., 2000]. The main conclusion of this study is that the TOPEX climatology could be improved by corrections for NUBF, MLH and 'drizzle fraction', but these factors are not well known. As the inferred rainfall scales in a simple fashion with the assumed MLH (see Eq. 1), such a correction can easily be applied to the TOPEX climatology (Quartly et al., 1999). The incorporation of the passive microwave test and a spatially-varying MLH will still leave TOPEX returning an underestimate of the total rainfall. Thus some correction for NUBF and undetected drizzle will also be required. Our studies in the TOGA-COARE region suggest a combined factor of about 1.7, but how much this varies regionally or seasonally is not clear. A further conclusion to be drawn from the results presented here is that validation of spaceborne rain measurements against ground-based data only from the tropics, as is often done, does not give a complete picture. Our mid-latitude validation data have pointed up the difficulties of reconciling groundbased and satellite measurements across a range of rainfall conditions and situations. The altimeter's sparse spatial coverage precludes its use by itself for daily maps of rainfall; however when gridded at an appropriate scale it can provide a useful climatology for seasonal and interannual studies [Quartly et al., 1999, 2000]. One key advantage it has over other datasets, is the inclusion of simultaneous wind and wave data, allowing a multi-parameter investigation of storms. TOPEX provides credible alongtrack rain distributions at a much better resolution than passive microwave systems (6 km as opposed to ~40
km), allowing some investigation of the typical spatial extent of rainfall. This latter ability has recently been superseded by the Precipitation Radar on TRMM, albeit only for the 35˚S to 35˚N confines of its orbit.
Appendix: Effect of non-uniform beamfilling for TOGA-COARE region In our comparison with the TOGA-COARE dataset, we averaged the finer resolution ship radar in a manner commensurate with its expected effect on the TOPEX radar altimeter (see section 2.3). Although appropriate for this validation, this usually gives a lower value then the simple arithmetic average. A comparison of these two measures gives us an estimate of the bias due to non-uniform beamfilling (NUBF). To determine this, we consider a TOPEX-size footprint (see Fig. 5) placed in all possible locations in all the scenes we have, and calculate the average rain rate by the two methods. For moderate or heavy rain rates, the method used to give the value TOPEX should observe is always less than the true rain rate. Figure A1 shows this underestimation as a function of rain rate. Below a rain rate of 15 mm hr-1 there appears to be a simple relationship between the true rain rate and the underestimation by using a mean homologous to the TOPEX observation. This tight relationship could be used for an inversion from the homologous measurement to the true value. However no such simple correction is applicable above 15 mm hr-1, as then the actual NUBF effect for individual footprints has a wide range of values, corresponding to a wide variety of structures being present from sharp rain bands giving a significant underestimation to large homogeneous structures for which the two definitions of the mean agree. A simple bulk correction for the whole data range is that the true average is around 30% higher than that directly measured by TOPEX. Therefore, for at least this location in the tropics, TOPEX-derived climatologies should be increased by 30% to allow for the effect of NUBF. However it is not clear what the appropriate correction is for other climatic regions, for example the mid- and high-latitudes where stratiform rain is more common than convective cells.
Acknowledgements The TOPEX data used were the merged GDRs provided on CD by AVISO Altimetrie. We are grateful to all the people who helped us with access to data from the ground-based radars and advice on their use, specifically Paul Kucera (TOGA-COARE), David Marks (Kwajalein), Peter Panagi, Ed Dicks and Keith Browning (UK rain radar), and Charles Kilburn, Carron Wilson, Darcy Ladd and Merhala Thurai (CAMR).
References Atlas, D., Footprints of storms on the sea: A view from spaceborne synthetic aperture radar. J. Geophys. Res, 99, 7961-7969, 1994. Brandes, E. A., J. Vivekanandan, and J. W. Wilson., A comparison of radar reflectivity estimates of rainfall from collocated radars, J. Atmos. Oceanic Technol., 16, 1264-1272, 1999. Cailliau, D. and V. Zlotnicki, Precipitation detection by the TOPEX/Poseidon dual frequency radar altimeter, TOPEX Microwave Radiometer, Special Sensor Microwave/Imager and climatological shipboard reports. IEEE Trans. Geosci. Rem. Sens., 38, 205-213, 2000. Carswell, J. R., W. J. Donnelly, R. E. McIntosh, M. A. Donelan, and D. C. Vandemark, Analysis of C and Ku band ocean backscatter measurements under low wind conditions. J. Geophys. Res, 104, 20 687-20 701, 1999. Chen, G., B. Chapron, J. Tournadre, K. Katsaros, and D. Vandemark, Global oceanic precipitation: A joint view by TOPEX and the TOPEX microwave radiometer. J. Geophys. Res., 102, 10 457-10 471, 1997. Chiu, L.S., and A.T.C. Chang., Oceanic rain column height derived from SSM/I. J. Climate, 13, 4125-4136, 2000.
Ebert E. E. and M. J. Manton, Performance of satellite rainfall estimation algorithms during TOGA COARE. J. Atmos. Sci., 55, 1537-1557, 1998. Elfouhaily T., D. Vandemark, J. Gourrion, and B. Chapron, Estimation of wind stress using dual-frequency TOPEX data. J. Geophys. Res., 103, 25 101-25 108, 1998. Goddard, J. W. F., J. D. Eastment, and M. Thurai, The Chilbolton Advanced Meteorological Radar: A tool for multidisciplinary research. Electronic and Commun. Eng. Journal, April 1994, 77-86, 1994. Goldhirsh, J. and E. J. Walsh, Rain measurements from space using a modified Seasat-type radar altimeter. IEEE Trans. Antennas Propag., 30, 726-733, 1982. Gunn, K. L. S. and T. W. R. East, The microwave properties of precipitation particles. Quarterly J. Roy. Met. Soc., 80, 522-545, 1954. Guymer, T. H., G. D. Quartly, and M. A. Srokosz, The effects of rain on ERS-1 radar altimeter data. J. Atmos. Oceanic Technol., 12, 1229-1247, 1995. Huffman, G. J., R. F. Adler, P. Arkin, A. Chang, R. Ferraro, A. Gruber, J. Janowiak, A. McNab, B. Rudolf, and U. Schneider, The Global Precipitation Climatology Project (GPCP) combined precipitation dataset. Bull. Am. Meteorol. Soc., 78, 5-20, 1997. Joss, J., J. C. Thams, and A. Waldvogel, The variation of raindrop size distributions at Lacarno. Proc. .International Conference Cloud Physics, 369-373, 1968. Kummerow, C., J. Simpson, O. Thiele, W. Barnes, A. T. C. Chang, and co-authors, 2000: The status of the Tropical Rainfall Measuring Mission (TRMM) after two years in orbit. J. Appl. Meteorol., 39, 19651982. McMillan, A., Sensing sea-rain from space: A comparison of rain-rates derived from Topex satellite altimeter with those from ground-based radar, M. Phys. dissert., U. of Surrey, Guildford, UK, 2000. Monaldo, F. M., J. Goldhirsh, and E. J. Walsh, Altimeter height measurement error introduced by the presence of variable cloud and rain attenuation. J. Geophys. Res., 91, 2345-2350, 1986. Oguchi, T., Electromagnetic wave propagation and scattering in rain and other hydrometeors. Proc. IEEE, 71, 1029-1078, 1983. Olsen, R. L., D. V. Rogers, and D. B. Hodge, The aRb relation in the calculation of rain attenuation. IEEE Trans. Antennas Propag., 26, 318-329, 1978. Quartly, G. D., Determination of oceanic rain rate and rain cell structure from altimeter waveform data. Part I: Theory. J. Atmos. Oceanic Technol., 15, 1361-1378, 1998. Quartly, G. D., T. H. Guymer, and M. A. Srokosz, The effects of rain on Topex radar altimeter data. J. Atmos. Oceanic Technol., 13, 1209-1229, 1996. Quartly, G. D., M. A. Srokosz, and T. H. Guymer, Global precipitation statistics from dual-frequency TOPEX altimetry. J. Geophys. Res., 104, 31 489-31 516, 1999. Quartly, G. D., M. A. Srokosz, and T. H. Guymer, Changes in oceanic precipitation during the 1997-98 El Niño. Geophys. Res. Lett., 27, 2293-2296, 2000. Rickenbach, T. N. and S. A. Rutledge, Convection in TOGA COARE: Horizontal scale, morphology, and rainfall production. J. Atmos. Sci., 55, 2715-2729, 1998. Shin D.-B., G. R. North, and K. P. Bowman, A summary of reflectivity profiles from the first year of TRMM radar data, J. Climate, 13, 4072-4086, 2000. Short, D. A., P. A. Kucera, B. S. Ferrier, J. C. Gerlach, S. A. Rutledge, and O. W. Thiele, Shipborne radar rainfall patterns within the TOGA COARE IFA. Bull. Am. Meteorol. Soc., 78, 2817-2836, 1997. Slack, J. K., A. R. Holt, and V. Brown, Workpackage WP 400: Implementation of direct algorithms, in Rain radar retrieval algorithms, edited by J. Testud, ESA contract 10146/92/NL/GS, Eur. Space Agency, Noordwijk, Netherlands, 1994. Thurai, M. and T. Iguchi, Rain height information from TRMM precipitation radar. Electronics Letters, 36, 1-2, 2000. Tournadre, J., Determination of rain cell characteristics from the analysis of TOPEX altimeter echo waveforms. J. Atmos. Oceanic Technol., 15, 387-406, 1998.
Tournadre, J. and J. C. Morland, The effects of rain on TOPEX/POSEIDON altimeter data. IEEE Trans. Geosci. Rem. Sens., 35, 1117-1135, 1997. Tournadre, J., G. D. Quartly, and M. A. Srokosz, Analysis of the effect of rain on the Envisat altimeter: Definition of a rain flag. Technical report DRO-OS No.00/01, IFREMER, Brest, France, 30 pp., 2000. Tsimplis, M. and S. A. Thorpe, Wave damping by rain. Nature, 342, 893-895,1989. Ulbrich, C. W. and L. G. Lee, Rainfall measurement error by WSR-88D radars due to variation in Z-R law parameters and the radar constant. J. Atmos. Oceanic Technol., 16, 1017-1024, 1999. Wilheit, T. T., A. T. C. Chang, and L. S. Chiu, A satellite technique for quantitatively mapping rainfall rates over the oceans. J. Atmos. Oceanic Technol., 8, 118-136, 1991. Wilheit, T. T. and K. D. Hutchinson, Retrieval of cloud base heights from passive microwave and cloud top temperature data. IEEE Trans. Geosci. Rem. Sens., 38, 1253-1259, 2000.
2.5 Pass 251
Pass 86
Latitude
0
Area covered by gridded rainfall-rate product
-2.5 MIT radar
TOGA radar -5 New Guinea Solomon Is
-7.5 145
150
Longitude
155
160
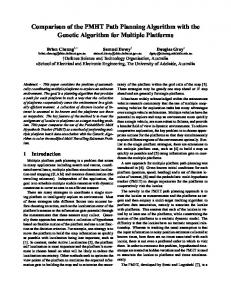
Figure 1. Location of shipborne radars during the TOGA-COARE programme's Intensive Flux Array experiment. TOPEX tracks 086 and 251 pass through the region of coverage. 0 100 200 300 km Enewtok
Ujelang
Ujae
*
8
ack
6
4
162
164
Mili Namorik
X tr 166
56
Maloelap Erikub Aur Namu
54 37 52 113 18
50 189 196
Ebon
TOP E
Kosrae
58
Majuro Ailingapalap Arno Jaluit
Coverage of Kwajalein radar 225
Latitude
10
Rongelap Utirik Bikini AilinginaeRongerik Taka Ailuk Wotho Kwajalein Likiep Wotje
Latitude
12
160
60
Bikar
48 11
168
170
172
Longitude Figure 2. Location of Kwajalein radar within the Marshall Islands, with TOPEX track 225 passing nearby.
46 -20
87 163 239
-15
-10
61
70 146 222
-5 Longitude
0
44 120
5
10
Figure 3. Coverage by the British radar network of waters adjoining the British Isles, with relevant TOPEX tracks added on.
*
51˚N
Chilbolton
2
22
06
1
6
13
7
14
50˚N
49˚N 4˚W
2˚W
0˚
Figure 4. Coverage of English Channel by Chilbolton Advanced Meteorological Radar (CAMR), with 4 TOPEX tracks marked. (A range of 160km is indicated, but due to intervening hills in various directions the radar cannot always sense that far without being targetted above the melting layer.)
10
a) 20
8
Ku-band Rescaled C-band
6
0
4
b)
σ (dB)
0
σ (dB)
a) 12
Figure 5. Method of averaging to simulate TOPEX's observation over a 1-second interval. The squares represent the 2km x 2km grid of the TOGA/COARE rainfall product, the pluses the mean position of TOPEX at 1-second intervals as it moves in an oblique direction, and the ovals the results of an 8-km circular footprint moving 6km in that 1-second averaging time. As the circular footprint only covers the edge of the oval for a limited time, the central 13 squares provide a good approximation of the key pixels contribution to the mean footprint.
Ku-band Rescaled C-band
18 16
0
-4
Rain-rate (mm hr-1)
∆σ (dB)
-6 -8
12
Expected TOPEX
2 0
0
c)
b)
Expected TOPEX
20
Expected TOPEX
15
c) 12
5 0 -3.5
-2 -4
10
-3
-2.5
-2 Latitude
-1.5
-1
-0.5
Figure 6. Variation of parameters along TOPEX track 086 (cycle 10) on 24th December 1992, compared with the TOGA-COARE rain radars. a) σ0Ku and σ0C (rescaled to Kuband equivalent). b) Observed TOPEX attenuation and that expected according to the ground radar. c) Derived TOPEX rain rate, compared with that expected from homologous averaging of ground radar data. The dashed horizontal lines show the detection thresholds of 0.5dB in (b) and the equivalent 2.3mm hr-1 in (c).
Rain-rate (mm hr-1)
0
∆σ (dB)
14 -2
Expected TOPEX
10 8 6 4 2 0 -5
-4.5
-4
-3.5 Latitude
-3
-2.5
-2
Figure 7. TOPEX track 086 (cycle 13) on 23rd January 1993 compared with TOGA-COARE radars. (Description as for Fig. 6)
a) 12.5
a) 22 σ (dB)
σ (dB)
12 0
0
11.5 11
20 18 16
Ku-band Rescaled C-band
10.5
b)
Ku-band Rescaled C-band
14
10
b)
2
Expected TOPEX
-1
-1
Expected TOPEX
4 3 2 1 0 49
49.5
Expected TOPEX
c) -2
5
Rain-rate (mm hr-1)
Rain-rate (mm hr-1)
0
0
-0.5
c)
1
∆σ (dB)
0
∆σ (dB)
0
50
50.5 Latitude
51
51.5
Expected TOPEX
6 4 2 0
52
53
Figure 8. TOPEX track 070 (cycle 72) on 30th August 1994 compared with UK rain radar network. (Description as for Fig. 6)
53.5
54 Latitude
54.5
55
Figure 9. TOPEX track 120 (cycle 110) on 13th September 1995 compared with UK rain radar network. (Description as for Fig. 6)
12.5
b) TOPEX rain-rates (mm hr -1)
TOPEX rain-rates (mm hr -1)
a) 20
15
10
5
10
7.5
5
2.3
2.3 0
0 0
5 10 15 -1 TOGA rain-rates (mm hr )
0 2.5 5 7.5 10 12.5 Rain-rates from UK rain radar (mm hr-1)
Figure 10. Scatter plots of instantaneous rain rates from TOPEX and ground-based radar. a) TOGA-COARE region, where a minimum wind speed of 3.8 ms-1 has been used to minimise the spurious detections by TOPEX. b) UK coastal waters, where comparison are restricted to between 1.5 and 20 ms-1. [ The horizontal line marks the detection threshold for TOPEX. ]
Underestimate of rain-rate due to NUBF (mm hr-1)
16 14 12 10 8 6 4 2 0 0
5
10 15 20 True rain-rate (mm hr-1)
25
30
Figure A1. The underestimation of rain rate caused by first calculating mean areal attenuation rather than mean areal rain rate.