World Academy of Science, Engineering and Technology International Journal of Medical, Health, Biomedical, Bioengineering and Pharmaceutical Engineering Vol:4, No:3, 2010
Validation on 3D Surface Roughness Algorithm for Measuring Roughness of Psoriasis Lesion
International Science Index, Biomedical and Biological Engineering Vol:4, No:3, 2010 waset.org/Publication/1442
M.H. Ahmad Fadzil, Esa Prakasa, Hurriyatul Fitriyah, Hermawan Nugroho, Azura Mohd Affandi, S.H. Hussein
Abstract—Psoriasis is a widespread skin disease affecting up to 2% population with plaque psoriasis accounting to about 80%. It can be identified as a red lesion and for the higher severity the lesion is usually covered with rough scale. Psoriasis Area Severity Index (PASI) scoring is the gold standard method for measuring psoriasis severity. Scaliness is one of PASI parameter that needs to be quantified in PASI scoring. Surface roughness of lesion can be used as a scaliness feature, since existing scale on lesion surface makes the lesion rougher. The dermatologist usually assesses the severity through their tactile sense, therefore direct contact between doctor and patient is required. The problem is the doctor may not assess the lesion objectively. In this paper, a digital image analysis technique is developed to objectively determine the scaliness of the psoriasis lesion and provide the PASI scaliness score. Psoriasis lesion is modelled by a rough surface. The rough surface is created by superimposing a smooth average (curve) surface with a triangular waveform. For roughness determination, a polynomial surface fitting is used to estimate average surface followed by a subtraction between rough and average surface to give elevation surface (surface deviations). Roughness index is calculated by using average roughness equation to the height map matrix. The roughness algorithm has been tested to 444 lesion models. From roughness validation result, only 6 models can not be accepted (percentage error is greater than 10%). These errors occur due the scanned image quality. Roughness algorithm is validated for roughness measurement on abrasive papers at flat surface. The Pearson’s correlation coefficient of grade value (G) of abrasive paper and Ra is -0.9488, its shows there is a strong relation between G and Ra. The algorithm needs to be improved by surface filtering, especially to overcome a problem with noisy data. Keywords—psoriasis, roughness algorithm, polynomial surface fitting. M.H. Ahmad Fadzil is with Department of Electrical and Electronics Engineering, Universiti Teknologi PETRONAS, Malaysia (e-mail:
[email protected]). Esa Prakasa, is with Department of Electrical and Electronics Engineering, Universiti Teknologi PETRONAS, Malaysia, on leave from the Research Center for Informatics, Indonesian Institute of Sciences, Indonesia (corresponding author; e-mail:
[email protected]). Hermawan Nugroho is with Department of Electrical and Electronics Engineering, Universiti Teknologi PETRONAS, Malaysia (e-mail:
[email protected]). Hurriyatul Fitriyah is with Department of Electrical and Electronics Engineering, Universiti Teknologi PETRONAS, Malaysia (e-mail:
[email protected]). Azura Mohd Affandi is with Department of Dermatology, Hospital Kuala Lumpur, Malaysia (e-mail:
[email protected]). S.H. Hussein was with Department of Dermatology, Hospital Kuala Lumpur, Malaysia (e-mail:
[email protected]).
International Scholarly and Scientific Research & Innovation 4(3) 2010
I. INTRODUCTION
P
SORIASIS is a very common skin disease, which has characteristics existing for a long time and makes the patient feel painful. Psoriasis can be recognized as a red lesion on the skin surface. The higher severity may have a thicker lesion covered by coarser white scales. The latest studies have shown that psoriasis can have significant impacts on quality of life, even the patient only have small affected area. The psoriasis prevalence around the world can be estimated between 1.5 up to 2 % [1]. Plaque psoriasis is the commonest types of psoriasis. Its percentage is around 80 % of psoriasis cases [2]. Recent studies in Malaysia, the Malaysian Psoriasis Registry found that the percentage of plaque psoriasis in Malaysia is 80.9% [3]. Plaque psoriasis is the most prevalent form of the psoriasis disease compared to other types such as flexural, guttate, pustular, nail psoriasis, psoriatic arthritis and erythrodermic [2]. The psoriasis lesions are usually found at the elbows, knees, scalp and lower back. The lesion can occur at the hand, leg, and chest area. Medical treatment for psoriatic patient should be carried periodically, since the disease can not be completely cured in a short time. II. BACKGROUND A. Psoriasis Assessment The PASI (Psoriasis Area and Severity Index) Scoring method is the gold standard for the severity assessment. To determine PASI score, this assessment method requires four parameters, i.e. area, erythema, scaliness, and thickness. For PASI scaliness assessment (and for determining treatment efficacy), dermatologist select several representative lesions from each human body region. In PASI, the human body is divided into 4 regions, namely head, trunk, upper extremities, and lower extremities. The area ratio, erythema, thickness and scaliness of the psoriasis lesions are determined for each region. The scores from each region will be weighted and totalized to provide a PASI score ranging from 0 – 72. The equation for PASI scoring can be written as follows PASI = 0.1 × (Rh + Th + S h ) Ah + 0.2 × (Ru + Tu + Su )Au +
0.3 × (Rt + Tt + St ) At + 0.4 × (Rl + Tl + Sl )Al
Score for A = area (0-6), R = erythema (0-4), T = thickness (0-4), S = scaliness (0-4), Subscript h = head, u = upper extremities, t = trunk, l = lower extremities
82
scholar.waset.org/1999.9/1442
(1)
International Science Index, Biomedical and Biological Engineering Vol:4, No:3, 2010 waset.org/Publication/1442
World Academy of Science, Engineering and Technology International Journal of Medical, Health, Biomedical, Bioengineering and Pharmaceutical Engineering Vol:4, No:3, 2010
Although PASI scoring is the current gold standard, there are some problems regarding PASI scoring, such as tedious, time consuming and the score is influenced inter and intraindividual variation of dermatologist. Therefore, an objective and reliable system is needed to overcome these problems. To assess PASI Scaliness score, dermatologist uses his sense (visual & tactile) and provides scores based on PASI scaliness description (Table I). The objective of the research is to develop an objective imaging system for PASI scaliness assessment. The problem formulation has defined surface feature for PASI scaliness descriptor. This feature should be measurable in computer vision terms and can be used to differentiate PASI Scaliness scores. The standard PASI scaliness description and surface feature of psoriasis lesion are listed in Table I.
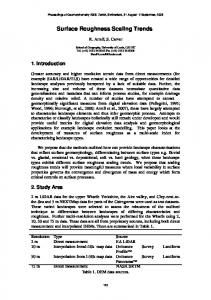
In skin research, roughness has been measured by applying digital image analysis. Atopic dermatitis is a common skin disorder, where rough surface appearance is one of the symptoms. The roughness of healthy and unhealthy skin can be characterized in roughness parameters Ra, Rq, and peak-peak height (Ry) [10]. The roughness difference between healthy and diseased skin are shown in Fig. 2.
TABLE I FEATURES FOR PASI SCALINESS SCORING
(a) (b) Fig. 2 The 2D and 3D image comparison between healthy skin (a) and diseased skin (b) [10]
Score 1 2 3 4
PASI Scaliness Description Fine scale Coarse scale with most lesion partially covered by scale Coarse scale almost all lesions covered by a rough surface Very coarse thick scales covering all lesions, very rough surface
Surface Feature of Psoriasis Lesion Less Rough Slightly rough Rough Very rough
B. Surface Roughness The surface characterization has been widely applied in various fields, for instance, material industry, road monitoring, remote sensing, and medical engineering. The ISO 14460-1 has defined the surface definition. The surface is a set of features which physically exist and separate the entire work piece from the surrounding medium [4]. Using this definition, the surface can be considered as a boundary layer between object and its environment. The surface profile can be categorized into three components; those are roughness, waviness and form [4]. These features are differentiated according to the surface wavelength or the peak-to-peak spacing [4]. Roughness has a fine texture, waviness appears as a superimposed on more general curvature, and form seems as a long-range deviation [5]. Fig. 1 illustrates the distinct between roughness, waviness, and nominal contour.
If there is no actual nominal shape, the waviness can be considered as the reference surface. The original profile should be filtered out from the waviness. The waviness can be obtained by applying moving average algorithm, creating fitting surface, Fourier transform, or wavelet approaches. The noise error is then calculated through subtraction between the original profile and the reference profile. This method has been used for measuring pavement roughness and predicting pavement ridable characteristics [11]. For the psoriasis cases, lesion roughness is measured by the vertical deviations of the lesion surface that appears on the surface of the body. The surface can be considered rough if these deviations are large or smooth if the deviations are small. III. APPROACHES A. Data Collection The 3D optical scanner, PRIMOS (Phaseshift Rapid In vivo Measurement Of Skin), is used for the data collection. PRIMOS applies digital stripe projection method to obtain the surface data [12]. The advantages of PRIMOS camera are standardization in the capturing distance and scanning area. PRIMOS scanner takes only a few seconds for image scanning (less than 63 ms). The optical scanner provides 2D and 3D images for each scanning. The 2D image of lesion is used for segmenting lesion from the normal skin. The 3D surface image is used for determining the surface roughness. Fig. 3 depicts examples of 2D and 3D images of a lesion surface which is scanned by PRIMOS camera.
Fig. 1 Roughness and waviness profile [6]
The roughness can be characterized by applying several statistical variables, such as average roughness, root mean square roughness, maximum area peak height, minimum area valley depth etc [5]. The data for the algorithm were extracted through either 1D profiling or 2D filtering [5],[7],[8]. European Union BCR Project for applied metrology divided roughness parameters into four groups, namely amplitude parameters, hybrid parameters, functional parameters, and spatial parameters [9].
International Scholarly and Scientific Research & Innovation 4(3) 2010
(a) (c) (b) Fig. 3 Output of PRIMOS 3D Optical scanner: (a) 3D surface of psoriasis lesion, (b) 2D image of lesion, (c) One-dimensional profiling at first row of lesion image
83
scholar.waset.org/1999.9/1442
International Science Index, Biomedical and Biological Engineering Vol:4, No:3, 2010 waset.org/Publication/1442
World Academy of Science, Engineering and Technology International Journal of Medical, Health, Biomedical, Bioengineering and Pharmaceutical Engineering Vol:4, No:3, 2010
B. Creating Lesion Model - Roughness Modelling The objective of developing rough surface models is to create representative data with controllable parameters. The model will be used for algorithm testing. Hoffman et al developed roughness model for terrain surface modelling with different roughness degree. The model has been generated by shifting and multiplying a sine function [13]. In this work, rough surface models are built using the Hoffman method, but the sine function is replaced by triangular waveforms. The nondifferentiability characteristic of the roughness profile can be represented by triangular waveforms. Ref [19] has introduce non-differentiability and continuous profile for rough surface modelling. The non-differentiable points are usually found at peak points of the rough profile. These peaks can be visually identified with its sharp change on gradient values of a certain point. Using Fourier series, the signal can be properly synthesized by tuning its frequency and amplitude values [14]. The equation of Fourier series has the form z(x ) =
z2 ( x, y ) = (a1 x 2 + a2 x + a3 )y 2 + (a4 x 2 + a5 x + a6 )y +
(a x
+ a8 x + a9 )
2
7
(3)
The third order polynomial,
z3 (x, y ) = (a1 x 3 + a2 x 2 + a3 x + a4 )y 3 +
sin(2π (2k + 1) fx ) ∑ (− 1)k (2k + 1)2 π 2 k =0 8
C. Polynomial Surface Fitting To estimate average surface of rough surface, polynomial surface fitting is applied to the rough surface of lesion model. This process is to extract an estimated average surface from the rough surface. By subtracting the rough surface from average surface, the deviation surface representing the roughness will be determined; this is the elevation surface. The rough surface represents the actual surface of lesion and the estimated average surface represents the average surface of lesion. Since the curvature of lesion surface is not a flat, high order polynomial surface fitting is needed. The second, third and fourth order polynomial area applied in this work. The general form of polynomials can be written by following equations [15]. The second order polynomial,
∞
(a x + a x + a x + a )y + (a x (a x + a x + a x + a )
(2)
3
2
5
2
6
7
3
The z ( x ) variable is a signal of triangular waveform as function of independent variable x. The f is the signal frequency and (k + 1) is the number of signal component. Fig. 4 describes a flow chart for creating rough surface model.
8
3
9
+ a10 x 2 + a11 x + a12 )y +
(4)
2
13
14
15
16
The fourth order polynomial,
z4 ( x, y ) = (a1 x 4 + a2 x 3 + a3 x 2 + a4 x + a5 )y 4 +
(a x + a x + a x + a x + a )y + (a x + a x + a x + a x + a )y + (a x + a x + a x + a x + a )y + (a x + a x + a x + a x + a ) 4
6
3
11
12
16
9
13
17
2
14
15
19
20
24
25
(5)
2
18
3
22
10
2
3
4
3
8
3
4
21
2
7
4
2
23
The coefficient of determination (R2) is used to measure fittingness of polynomial fitting [16]. The equation of R2 is given by M
R2 = 1 −
N
∑∑ z i =1 j =1 M N
i, j
− fi, j
(6)
∑∑ zi, j − z i =1 j =1
Fig. 4 Flow chart for creating rough surface model
Fig. 5 illustrates rough surfaces produced on a flat surface using the roughness modelling with different amplitudes at a constant frequency. These rough surfaces will be superimposed on curve surface for creating rough surface lesion model.
(a)
(b)
(c)
Fig. 5 The example of rough surfaces at fixed frequency. The amplitude for each model is (a) 0.2 (b) 0.5, (c). 1.0
A good fit can be obtained if R2 value is between 0 and 1, and its value close to 1. An acceptable value of R2 should be fixed at a certain value which is close to 1. For the R2 outside the interval 0 to 1, its fitting result can be ignored. Since the lesion area covers a small skin area, the surface fitting is categorized into six types only. The surface types are flat, ridge, valley, peak, pit, and saddle [17], [18]. These surfaces are illustrated in Fig. 6.
(a)
(b)
(c)
(d)
(e)
(f)
Fig. 6 Fitting surface types for creating estimated average surface: (a) flat, (b) ridge, (c) valley, (d) peak, (e) pit, and (f) saddle
The following algorithm can be applied to determine the
International Scholarly and Scientific Research & Innovation 4(3) 2010
84
scholar.waset.org/1999.9/1442
World Academy of Science, Engineering and Technology International Journal of Medical, Health, Biomedical, Bioengineering and Pharmaceutical Engineering Vol:4, No:3, 2010
estimated average surface [17]: 1.
2.
Suppose there is a rough surface matrix, and each data point can be represented by z ( xi , yi ) . The coordinates x, y, and its value z ( xi , yi ) will be used to calculate polynomial coefficients. Total data point in rough surface is N. Assume this algorithm applies second order polynomial for surface fitting. The matrix equation of Equation 2 can be written as VA = Z . Matrix element of A is unknown, then inversion A = V −1 Z should be applied to determine matrix of polynomial coefficient A .
International Science Index, Biomedical and Biological Engineering Vol:4, No:3, 2010 waset.org/Publication/1442
⎡ x12 y1 2 ⎢ 2 2 ⎢ x2 y 2 V = ⎢ x32 y3 2 ⎢ ⎢ L ⎢x 2 y 2 ⎣ N N
3.
x1 y1
2 2
x2 y2 2 x3 y3 L xN yN
2
2
x1 y1
2
y2 2 y3 L
2
x2 y 2 2 x3 y 3 L
x2 y2 x3 y3 L
y2 y3 L
x2 2 x3 L
2
xN yN
2
xN yN
yN
xN
y1
yN
2
x1 y1
y1
x1
2 2
2
1⎤ ⎥ x2 1 ⎥ x3 1 ⎥ ⎥ L L⎥ x N 1 ⎥⎦ x1
⎡ a1 ⎤ ⎡ z ( x1 , y1 ) ⎤ ⎢a ⎥ ⎢ z(x , y ) ⎥ ⎢ 2⎥ ⎢ 2 2 ⎥ A = ⎢ a 3 ⎥ Z = ⎢ z (x3 , y3 ) ⎥ ⎢ ⎥ ⎢ ⎥ ⎢L⎥ ⎢ L ⎥ ⎢⎣a 9 ⎥⎦ ⎢⎣ z ( xN , y N )⎥⎦ Using matrix A , the estimated average surface Z r can be obtained through equation Z r = VA .
surgical tape have been used. The tape pieces are mounted on mannequin’s skin surface to simulate psoriasis lesions on human skin surface (see Fig. 8). Four hundred forty four lesion models from to 4 body regions (arm, upper extremities, trunk and lower extremities) are selected for algorithm validation. The algorithm can be considered valid, if roughness value of tapes can be kept constant in any locations. To validate roughness measurement, some abrasive papers with different roughness grades are measured. The measured roughness should correlate with the roughness grade that is given by manufacturer. The correlation between measured roughness and roughness grade is determined by using Pearson's correlation coefficient. The equation of Pearson's correlation coefficient for two population variables X and Y can be written as ρ x, y =
E [( X − μ X )(Y − μY )]
σ XσY
(8)
To determine correlation coefficient of sample, it is given by N
r=
∑ (x − x )( y i =1
i
i
− y)
(xi − x )2 ( yi − y )2
(9)
D. Roughness Algorithm Roughness index can be determined by applying a roughness algorithm. The algorithm uses lesion area images as the input rough surface. Second, third and fourth order polynomial fitting are applied to the rough surface. The best fitting result can be selected based on its R2 value. The estimated average surface is extracted from each fitting. To determine elevation surface, estimated surface is subtracted from rough surface. Fig. 7 describes surface subtraction of rough surface and estimated average surface to obtain elevation surface. The elevation surface can be used to calculate average roughness.
Pearson’s correlation coefficient ranges from -1.0 to +1.0. The relation can be decided as a strong relation if the absolute value of r approximates to 1.
Fig. 7 Subtraction surface between rough surface and estimated surface to elevation surface
Fig. 8 Lesions are taped in mannequin skin surface to represent psoriasis lesions
Average roughness (Ra) is selected as roughness index at roughness algorithm. The Ra equation is applied to whole height map matrix. The equation for matrix of elevation surface with size M × N can be written as
IV. VALIDATION
Ra =
1 M N ∑∑ hi, j MN i =1 j =1
(7)
The equation of Ra has been tested to the computational model of rough surface (Fig. 5) and combination between rough surface and curve surface (Fig. 6). E. Validation for Roughness Algorithm Algorithm validation has been conducted to validate polynomial fitting and roughness measurement. For validating polynomial fitting, a male mannequin and several pieces of
International Scholarly and Scientific Research & Innovation 4(3) 2010
To validate fitting algorithm result, average roughness value at flat surface is used as the reference. This average is obtained from 33 samples of lesion models on a flat surface. Three images are taken for each lesion, therefore totally 99 images are used to calculate reference roughness. The average roughness for lesion model on a flat surface is 0.013 mm with standard deviation 0.001 mm. Roughness values of lesion models for each body region are calculated. The lesion models are taped on four body regions of mannequin, namely head, trunk, upper extremities and lower extremities. There are 444 lesion models that have been determined. Ten lesions are located at head, 89 lesions at upper extremities, 125 lesions at trunk and 220 lesions at
85
scholar.waset.org/1999.9/1442
World Academy of Science, Engineering and Technology International Journal of Medical, Health, Biomedical, Bioengineering and Pharmaceutical Engineering Vol:4, No:3, 2010
lower extremities region. Fig. 9 shows percentage error of average roughness of lesion at head, upper extremities, trunk, and lower extremities regions. To validate the result, the acceptable percentage error is set to 20%. Then, the acceptable range of Ra is 0.0104 mm up to 0.0156 mm.
Fig. 9 The Ra of lesion models at head, upper extremities, trunk, and lower extremities regions
To validate roughness measurement, abrasive papers with different grades are used as the tested surfaces. Average roughness of four grades of abrasive paper is listed in Table II. Grade value (G) follows standard of United States CAMI (Coated Abrasive Manufacturers Institute). Relation between G and Ra is proven by using Pearson's correlation coefficient. The correlation value of G and Ra is -0.9488, its shows there is a strong relation between G and Ra. Minus sign represents negative linear relationship, which means the smoother surface (small Ra value) is represented by a large number of grade value. This value proves that roughness algorithm can be used to determine roughness grading. TABLE II AVERAGE ROUGHNESS OF ABRASIVE PAPER
Most of result can be accepted, due to the percentage error less than 20%. Fig. 10 describes percentage of lesion models which have percentage error within 20% and greater than 20%. There measurement result of head and upper extremities regions are totally accepted. The percentage error of Ra within 20% can be achieved if the R2 of surface fitting is not less than 90%. 4.0%
80.0% 70.0% 60.0%
100.0%
100.0%
Head
Upper Extremities
96.0%
99.5%
40.0% 30.0% 20.0% 10.0% 0.0% Trunk
Body Regions
Error within 20%
Average particle diameter (D) (µm) 708 265 190 115
Ra (mm) 0.2637 0.1110 0.0924 0.0304
0.5%
90.0%
50.0%
Grade Values (G) 24 60 80 120
Lower Extremities Error is larger than 20%
Fig. 10 Percentage of lesion models which have percentage error within 20% and greater than 20%. The results of roughness measurement at head and upper extremities region can be accepted. The significant error can be obtained at highly curved surfaces
The lesions with percentage error more than 20% are obtained from lesion 23, 86, 90, 94, and 98 of trunk region and lesion 15 of lower extremities region. These significant errors occur due image quality. The algorithm is validated for any location on the human body surface except the image can not be taken properly. Valley curve with narrow gap degrades the image quality. The focused image will not be achieved if the camera lead does not cover the scanning surface properly and the scanning surface is not perpendicular to camera lens. The scanning surface is not covered properly, due to rigidity of human model skin surface. The mannequin’s skin surface may not be flattened as well as the actual human skin. Fig. 11 illustrates the disability of camera lead to cover the scanning surface.
International Scholarly and Scientific Research & Innovation 4(3) 2010
Since, the average roughness is an amplitude parameter, its value will relate to particle size. Bigger size in diameter will create higher amplitude deviation in the rough profile. To compare between average particle diameter standardization and average roughness, both values are normalized with its maximum value. The grades are then evaluated in limited interval (between 24 up to 120). Plot of normalization of average particle diameter and average roughness versus grade values are decreasing exponentially. The plots are illustrated in Fig. 12. rRa vs. grade fit of Roughness algorithm
1
rdCami vs. grade fit of CAMI standard
0.9
Ratio f Roughness Parameter
100.0%
Lesion Percentage of Error Groups
International Science Index, Biomedical and Biological Engineering Vol:4, No:3, 2010 waset.org/Publication/1442
Fig. 11 Camera lead can not touch valley curve of scanning surface
0.8 0.7 0.6 0.5 0.4 0.3 0.2 0.1 30
40
50
60
70 80 Grade Value
90
100
110
120
Fig. 12 Comparison between normalization of average particle diameter vs. CAMI Grade (solid line) and normalization of average roughness vs. CAMI grade (dashed line)
Both of plots have high R-square value. The R-square value of fitting equation of CAMI standard is 0.99 and for average roughness algorithm is 0.98. It can be stated that
86
scholar.waset.org/1999.9/1442
World Academy of Science, Engineering and Technology International Journal of Medical, Health, Biomedical, Bioengineering and Pharmaceutical Engineering Vol:4, No:3, 2010
characteristic of roughness algorithm result is associated with CAMI standardization, since the results can be plotted in similar fitting type.
International Science Index, Biomedical and Biological Engineering Vol:4, No:3, 2010 waset.org/Publication/1442
V. CONCLUSION Surface roughness of lesion can be used as a scaliness feature since scale appearance on lesion surface can contribute to the lesion roughness. Rough surface model has been built to model lesion surface. The model is created by applying a triangular waveform. To determine roughness index based on amplitude parameter, a base surface should be defined. Polynomial surface fitting is used to estimate base surface. Subtraction between rough and base surface give height map matrix. Height map matrix can be considered as deviation of each data point of rough surface. Roughness index can be determined by averaging the absolute value of height map matrix. This equation is known as average roughness equation (Ra). Roughness algorithm has been tested to several lesion models on curve surface of human mannequin. Pieces of surgical tape are used to simulate psoriasis lesion. From roughness calculation of 444 lesions on skin surface of mannequin, 438 of 444 lesions can be accepted (percentage error less than 20%). The algorithm is validated if the R2 is not less than 90%. There are six exception results, for lesion 23, 86, 90, 94, and 98 of trunk region and lesion 15 of lower extremities region. These significant errors occur due the image quality. The PRIMOS camera does not provide a focused image since the scanning surface can not be flattened properly. Roughness algorithm is validated for roughness measurement on abrasive papers at flat surface. The Pearson’s correlation coefficient of grade value (G) of abrasive paper and Ra is -0.9488, its shows there is a strong relation between G and Ra. The algorithm needs to be improved by surface filtering, especially to overcome a problem with noisy data.
[8] [9]
[10]
[11]
[12] [13] [14] [15]
[16] [17]
[18] [19]
Relationship to Human Preception”, Journal of Cosmetic Science, Vol. 56, No 2, 2005, pp. 105-120. Frankowski,G., Chen,M., “Optical 3D in vivo Measurement of Human Skin Surfaces with PRIMOS”, Proc.of Fringe, 2001. G. Barbato, et. al, “Scanning tunneling microscopy methods for roughness and micro hardness measurements”, Synthesis report for research contract with the European Union under its programme for applied metrology, European Commission Catalogue number: CD-NA16145 EN-C, Brussels, Luxemburg 1995. Loden, M., “Atopic Dermatitis and Other Skin Diseases”, Bioengineering of The Skin: Skin Imaging and Analysis, Edited: K.P. Wilhelm et. al., Informa Healthcare USA, Inc, New York, 2007. Janoff, M.S., Hayhoe, G.F.,“The Development of a Simple Instrument for Measuring Pavement Roughness and Predicting Pavement Rideability”, Association of Road Congresses Technical Committee on Surface Characteristics, ASTM International, 1990. _, “User Manual: PRIMOS Optical 3D Skin Measuring Device”, GFMesstechnik GmbH, Germany, 2008. Hoffman, R., Krotkov E., “Terrain Roughness Measurement from Elevation Maps”, SPIE Vol. 1195 Mobile Robots IV, 1998. _, “Triangle wave”, http://en.wikipedia.org/wiki/Triangle_wave Jong Sung Yoon, Cheolho Ryu , Jang Hyun Lee,” Developable polynomial surface approximation to smooth surfaces for fabrication parameters of a large curved shell plate by Differetial Evolution”, Computer-Aided Design 40 905–915, Elsevier, 2008. _,“Coefficient_of_determination”, http://en.wikipedia.org/wiki/Coefficient_of_determination Dong, W.P, Mainsah, E., Stout, K.J., “Reference Plane for the Assessment of Surface Roughness in Three Dimensions”, International Journal Mecahnical Tool Manufacturing, Vol. 35 No 2, Pergamon, 1995. Besl,J.P., Jain, R.C., "Three-Dimensional Object Recognition", Computing Surveys, Vol.17, No.1, March 1985 Majumdar, A., Tien, C.L., "Fractal Characterization and Simulation of Rough Surfaces", Wear, Vol 136, Issue 2, March 1990, Elsevier, 1990
ACKNOWLEDGMENT The author would like to acknowledge Dermatology Department, General Hospital Kuala Lumpur (GHKL) for providing data of psoriasis patient. This work is supported by Research Enterprise Office, Universiti Teknologi PETRONAS and funded by Ministry of Science, Technology and Innovation, Malaysia under TechnoFund Grant TF 0308C041. REFERENCES [1] [2] [3]
[4] [5] [6] [7]
_, “Psoriasis”, http://www.wrongdiagnosis.com/p/psoriasis Neimann, A.L., Porter, S.B., Gelfand, J.M., “The Epidemiology of Psoriasis”, www.future-drugs.com, 2006 Chang, C.C., Gangaram, H.B., Hussein, S.H., “Malaysian Psoriasis Registry – Prelimanary Report of a Pilot Study Using a Newly Revised Registry Form”, Medical Jour.Malaysia Vol 63 C, Sept 2008. Blunt, L., Jiang, X., Advanced Techniquees for Assessment Surface Topography, Kogan Page Ltd, London, UK, 2003. Muralikrishnan, B., Raja, J., Computational Surface and Roundness Metrology, Springer-Verlag London Limited, UK, 2009. Whitehouse, D.J., Handbook of Surface Metrology, IOP Pub. 2003. Smalls, L.K., et. al, “Quantitative Model of Cellulite: Three Dimensional Skin Surface Topography, Biophysical Characterization and
International Scholarly and Scientific Research & Innovation 4(3) 2010
87
scholar.waset.org/1999.9/1442