modeling, and value modeling. Section 3 describes our approach and its analysis capabilities. It also discusses the design of a software tool implementing the.
Value-Centric, Model-Driven Business Transformation Juhnyoung Lee and Anca-Andreea Ivan IBM T. J. Watson Research Center Hawthorne, New York 10532 {jyl,ancaivan}@us.ibm.com Abstract Business transformation is a key executive management initiative that attempts to align the technology initiatives of a company closely with its business strategy and vision. Business transformation projects are often hampered by situations known as “business-IT gaps”, which lead to failures in demonstrating the business values of IT functions and capabilities. To address this problem, we propose an innovative model-driven approach to value-centric business analysis and transformation. This new approach maps IT functions and capabilities to business performance, and facilitates the demonstration of the delivered value of IT and services. Also, the approach integrates value models with business models of processes and components to leverage the value model at different levels and phases of business transformation.
1. Introduction Business transformation is a key executive management initiative that attempts to align the technology initiatives of a company closely with its business strategy and vision, and is achieved through efforts from both the business and IT sides of the company. However, the technology side of the company often focuses on functions and capabilities while the business side focuses on business impact and value. Because of this “business-IT gap” [11], business transformation processes for mid- to large IT and services are long and costly. In addition, failures to demonstrate the business value of the transformation processes often hinder the intended transformation or cause an inconsistent and unmanaged investment portfolio. In order to address this problem, this paper presents a novel approach that maps IT functions and capabilities to business performance, and demonstrates the delivered value of IT investments. This approach
integrates the value model with business models of processes and components to leverage the value model at different levels and phases of business transformation. Its main contributions are: (1) innovatively extending model-driven business transformation [9] by linking values with key IT enablers all the way down to the IT infrastructure, (2) combining component business modeling [7] with the value-centric business analysis, and (3) using the measurement provided by the value model to monitor and track value and improvements during and after business transformation. The rest of this paper is structured as follows: Section 2 provides background discussion on modeldriven business transformation, component business modeling, and value modeling. Section 3 describes our approach and its analysis capabilities. It also discusses the design of a software tool implementing the methodology. Section 4 summarizes related work in this area, and discusses how the presented approach is different. In Section 5, conclusions are drawn and future work is outlined.
2. Background Model-driven business transformation [9] is a supporting technology for business transformation in the service-led economy, which utilizes a multi-layer model approach to link business and IT semantics, as shown in Figure 1. The upper layers of the model represent business semantics in the terms familiar to business executives, business managers and analysts such as key performance indicators, operational metrics, business processes, activities and governance. The lower layers of the model represent IT architecture comprising a wide range of services implemented in IT infrastructure such as service-oriented architecture. The vision of this multi-layer model is to enable IT solutions to accurately reflect and be driven by business intent.
Strategy Model Business Domain
Link
KPI’s
Operation Model Transform Measure Execution Model (platform independent) IT Domain
Realize
Sense
Implementation Model (platform Specific)
Figure 1: Model-driven business transformation The key to this multi-layer model is that the layers are linked in meaningful ways, so changes in one layer can ripple through other layers. The representation and enforcement of the semantics of the different layers and also of the connections between the layers is essential to the model-driven approach. This approach provides a convergence of the business and IT models using a multi-layer model, which tightly couples the business and IT models. In many ways, this vision is not new. Technologists have been working towards generalized business process integration and automation for many years. However, this approach is different from the typical technology-oriented business integration, because it provides a top-down business perspective which enforces a business-orientation of business transformation. This model-driven business transformation approach is a significant step towards closing the infamous “business-IT gap,” achieving maintainable alignment between business design and IT solutions. In the business domain, the consulting industry increasingly utilizes novel business modeling techniques, such as component business modeling [7], to understand and transform businesses. A component business model represents the entire business in a simple framework that fits on a single page. It is an evolution of traditional views of a business, such as business unit, function, geographic or process. The component business model methodology helps identify basic building blocks of business, where each building block includes the people, processes and technology needed by this component to act as a standalone entity and deliver value to the organization. This single page perspective provides a view of the business which is not constricted by barriers that could potentially hamper the ability to make meaningful business transformation. The component business model
facilitates to identify which components of the business create differentiation and value. It also helps identify where the business has capability gaps that need to be addressed, as well as opportunities to improve efficiency and lower costs across the entire enterprise. Another recent trend in today’s business environment is that enterprises are increasingly focusing on value rather than on the functions and capabilities of IT. They expect service providers to demonstrate value of technologies throughout business transformation phases. An approach to meeting this requirement of business transformation is value modeling, which identifies and maps the enterprise’s key business and IT value drivers, and links them to the measurable business and financial benefits. The value model also helps tracking the performance and showing realized value during and after the implementation. This paper presents a value-centric, model-driven approach to business transformation that integrates the value model with business models of processes and components to support multiple phases of value-centric business transformation.
3. Proposed approach This section describes in detail our value-centric, model-driven approach to business transformation. The main idea of this solution is to enable business executives to take better transformation decisions by building a unique model that captures all entities involved in creating value for the business, and defining qualitative and quantitative analyses that could be performed on the business model. The following subsections describe in detail the business model (3.1), the qualitative analyses (3.2), the quantitative analyses (3.3), and the overall framework referred to as VIOLA which was implemented to validate our proposed solution (3.4).
3.1. Value-centric business model The first contribution of our solution is building an innovative business model, capable of capturing both the entities of a business that are involved in creating or defining value and their relationships. Examples of such entities include business processes, business activities, KPIs (key performance indicators), and value drivers. Figure 2 illustrates part of our model.
KPI Operational Metrics Business Component
Business Process Business Activity
Resource
Message
Component Business Map
Service
IT System
Figure 2: VIOLA business model In order to allow users to view the rich information captured by this model, we define multiple views into the model, called business maps. Each business map shows various entities involved in running and understanding of business and their relationships. Examples of such entities include business components, business processes and activities, value drivers, operational metrics and performance indicators, IT infrastructure comprising of various IT applications and network equipments, and solutions, i.e., both IT and business capabilities to support business objectives and strategies, or business pain points. Our business maps provide visual models which organize the above mentioned business entities in a structured way; in addition, they provide user interfaces which allows to the user interactively navigate and explore the information space for analysis. Figure 3 shows a screenshot of a business map that contains the component business map, the value driver tree and the business activities. To build such a business map, we utilize industry standard taxonomies of business processes and metrics such as APQC Process Classification Framework [1], and their relationship to value drivers and business components. Additionally, we allow the user to customize the industry standards to the needs of a specific enterprise, and import and export the enterprise-specific value driver trees. This paper presents a value-centric, model-driven approach to business transformation that integrates the value model with business models of processes and components to support multiple phases of value-centric business transformation.
Value Driver Tree
Business Activities
Figure 3: Business map views
3.2. Qualitative analyses The main advantage of this model is the enablement of various types of analyses that would allow consultants to obtain interesting insights into the current state of a business and its possible business transformations. The VIOLA system is designed on two primary analysis capabilities: the qualitative analysis based on component business modeling and the quantitative analysis based on value modeling. By linking them together, VIOLA provides an end-to-end suite of business analysis capabilities enabling business-driven, value-centric business transformation.
3.2.1. Dependency analysis The dependency analysis allows the user to explore the business maps and understand the correlations and dependencies among business entities. For examples, this capability can interactively identify one or more business components associated with a particular value driver. Conversely, it can find one or more value drivers that are affected by the performance of a particular business component. The associations between value drivers and business components are discovered through their relationships with business processes and activities. Similarly, VIOLA can identify and show dependencies between business activities and IT applications, and also between business activities and solutions, both IT and businessdriven. Furthermore, the relationships are transitive, and so it is possible to infer the associations between value drivers and IT applications/solutions, also between components and IT applications/solutions, and so on.
To support the dependency analysis, the VIOLA system captures the basic relationship information in the CBM metamodel. Once the explicit relationship data are populated in the database using the metamodel, the system utilizes a Semantic Query Engine to infer implicit relationships among various business entities by using the explicit relationships and their logical properties. To provide the inference capability, VIOLA utilized W3C’s OWL semantic Web markup language [17] and the SnoBase Ontology Management system [10] developed at IBM Watson Research Center. SnoBase system programmatically supports ontology needs of applications in a similar way a database management system supports data needs of applications. For programmers, SnoBase provides a Java API referred to as Java Ontology Base Connector (JOBC), which is the ontological equivalent of Java Data Base Connector (JDBC). JOBC provides a simple-to-use but powerful mechanism for application programmers to utilize ontologies without dealing with the details of ontological information. In addition, SnoBase supports a number of query languages including a variant of OWL-QL and RDQL as ontological equivalents of SQL of relational database systems.
3.2.2. Heat map analysis This analysis is an essential capability of CBM where the user discovers one or more “hot” components that are associated with one or more business strategies and/or pain points. In the traditional CBM analysis, this step was conducted manually by the analyst depending on his/her knowledge and expertise in the business domain. VIOLA automated the capability by taking values into account with the dependency analysis. First, the system allows the user to explore the value driver tree to identify one or more value drivers that may be associated with a certain business strategy/pain point. The discovery of “hot” components that affect the business strategy can be accomplished by executing a simple semantic query to the business model represented in OWL. Then the system colors the identified hot components differently to distinguish ones that affect positively or negatively to the strategy. The VIOLA system compares the industry benchmark and the as-is value of the operational metrics and performance indicators associated with the components to decide on their color. Figure 3 displays a heat map showing a couple of hot components affecting positively to a value
driver, “Customer Retention,” which is highlighted in the value driver tree.
3.2.3. Shortfall assessment The Shortfall Assessment allows the user to map the existing IT infrastructure against the “hot” components identified in the heat map analysis. It helps understand how the current IT infrastructure, such as applications and network capabilities, supports the business, especially, for those hot components. The analysis requires collecting the information on the current IT infrastructure and representing it in a semantic business model in OWL. Then the mapping of IT applications and capabilities to the components becomes, again, an execution of a simple semantic query to the semantic model. VIOLA visualizes the mapping on the CBM map by overlaying IT applications on components. Then, the user can visually classify possible IT shortfalls into several types. Typically, four types of opportunities tend to arise. First, a gap indicates that a hot component does not have any IT support. The enterprise may want to consider an IT investment to improve the component’s performance and support the intended business transformation. Second, a duplication indicates that a component is supported by multiple IT applications, possibly, deployed over time. The business may want to consolidate the applications to improve performance and reduce cost in communication and maintenance overhead. Third, a deficiency indicates that the current application lacks key functionality, or is poorly designed, and so incurs a project opportunity. Finally, an over-extension indicates that a system designed to support one business component is extended beyond its core capability to support others. Different definitions for the shortfall types may apply. With precise definitions of the shortfall types, the VIOLA system also automates the shortfall classification and recommends to the user the initially identified shortfalls. It is important to note that an IT system can be involved with multiple situations. The value model of the VIOLA system takes that fact into account, with an optimized plan for implementation projects to maximize the investment. An integrated management approach such as project portfolio management ensures that the project opportunities are effectively taken into account that the best use is made of available resources by applying them to the highest priority opportunities, that the projects are regularly assessed, and that management actions are taken to keep them aligned with objectives.
3.2.4. Solution identification Once IT shortfalls are identified and classified, one or more solution catalogs which provide information on various IT and business solutions to address the shortfalls and support the intended business transformation. VIOLA allows the user to explore the solution space to identify one or more solutions that may address one or more shortfalls of interest. The discovery of solutions for supporting components associated with a shortfall can be automatically conducted by executing a semantic query that correlates solutions and components by using their relationships to business activities. In addition, VIOLA allows the user to manually correlate them, if desired. If there is no prefabricated solution available from existing solution catalogs to support a certain hot component and/or an IT shortfall, the VIOLA system helps the user start composing a new solution, by providing a link to a solution composer tool, such as IBM’s WBI modeler.
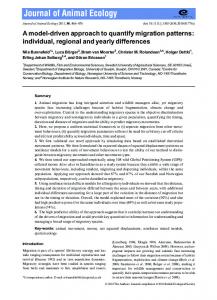
3.3. Quantitative analyses The value model of the VIOLA system models both tangible returns such as cost savings and intangible benefits such as productivity enhancement, while most existing ROI analysis tools focus on direct benefits. This capability is important because direct returns in cost reduction make up only half of technology ROI. A benchmark study on document management found that 84% of companies had seen measurable increase in user productivity, whereas less than half recorded direct returns [12]. The VIOLA value model captures business impact at the measurable metric level and translates it into business value of generic value drivers such as revenue growth, margin improvement, and increased capital efficiency. For this purpose, the model provides a hierarchical structure of value drivers and metrics. The structure is referred to as a value driver tree where the root is the shareholder value or profitability, and the leaf nodes are measurable operational metrics. The leaf metrics nodes are connected to the root through multiple layers of performance indicators and value drivers. The initial framework of a value driver tree can be derived from a standard such as the metrics tree associated with the APQC Process Classification Framework [1]. The templte metrics tree is customized for a specific business in practices. The linkage between any two nodes in the value driver tree is signified by the impact level of a child to its parent, where the impact levels of all children add up to 100%.
The impact levels can be derived by mining empirical data or assigned speculative values for sensitivity analyses. A value driver tree is shown in Figure 4. Supplier Negotiation Cost 40%
Account Cost 40% Marketing Cost 25%
Product Packaging Cost 20%
Product Total Operating Development Cost Cost 50% 25% Total Revenue 50%
Total Cost 50%
Shareholder Confidence 1%
Profit
Debt
98%
1%
Shareholder Value 100%
Figure 4: A sample value driver tree The VIOLA value engine calculates the expected values of a set of value drivers that are affected by the implementation of one or more IT solutions and/or business capabilities. To support this calculation, the value model extends the value driver tree by linking IT capabilities and solutions to business activities, and to operational metrics in the value driver tree. Additionally, the expected value calculation requires user input for certain edges in the trees. First, it requires the usage factor on each edge between an IT capability and a business activity which indicates how much of the activity the IT capability is used for. Second, it requires the improvement factor on each edge between an activity and a metric node which indicates how much the metric is improved by the IT capability. Again, the user input values can be derived by mining empirical data or assigned speculative numbers for sensitivity analyses. Figure 5 shows a sample VIOLA value model. E-Procurement
IT Capability
Constant
Constant
Level 00 IT Capabilities
Usage factor RFQ
Bid Evaluation Order Tracking …
Value
Value
Value
Level 0 Business Activities
Improvement factor Account Cost Value
Supplier Negotiation Cost … Value
… Shareholder Value Value
Level 1 Operational Metrics Value Driver Tree Level L Performance Indicators
Figure 5: A sample VIOLA value model
The value engine uses a recursive algorithm to calculate the expected values of value drivers affected by one or more IT capabilities. The mean value of a node, np, in the value driver tree is derived as follows:
E[ n p ] =
∑ ( E[nci ] × E[eci ])
i =1, n
where E[nci] and E[eci] are the mean of a child node nci, and its edge to np, respectively. The VIOLA value engine provides a robust sensitivity analysis for validating various value propositions, because it can take the impact factors in range and present the expected business values in confidence intervals. Also, it can capture synergistic or cannibalizing effects of different IT capabilities and solutions as separate user input and take it into account for the value calculation. In addition, the engine can capture statistical dependencies via correlations. Finally, the value model can be extended by mapping value drivers to standard financial measures and ROI terms for generating business reports.
3.3.2. Business reports VIOLA generates a number of business intelligence reports for an executive summary of the analyses, including sophisticated interactive charts, as follows: (1) Value Driver Report, which summarizes the impact of investments in terms of value drivers in a structured format, with a number of illuminating interactive charts; (2) Financial Measure Report, which translates the impact of the solutions on value drivers to a set of standard financial measures, again, with a number of illuminating interactive charts. A sample report is shown in Figure 6; and (3) ROI Report, which translates the impact of the solutions into a set of cash flow measures over time and provides the benefits of the investments in terms of standard ROI terms.
3.3.1. Solution value estimation Until now, most analyses in VIOLA were qualitative, focusing on the identification of correlations and dependencies among business entities such as business components, processes and activities, value drivers, IT applications and solutions. This module, Solution Value Estimation, provides a quantitative analysis. It allows the user to calculate the expected value of value drivers when one or more solutions are implemented in the context of business transformation. The calculation uses as input the as-is value of value drivers and the contributing factors of solutions to metrics that are associated with leaf nodes in the value driver tree. The expected values are calculated for a subset of the value driver tree, containing all the leaf node value drivers that are directly affected by the solution(s) and all their ancestors that are indirectly affected. Once specific improvement opportunities for the target performance indicator are identified, they can be prioritized, based on a value-model analysis of each opportunity. The value model takes into account factors such as implementation cost, potential savings, increased revenue, reduced risk, and other financial metrics such as ROI and Net Present Value, net profit margin and asset turnover ratio, and also improved KPIs such as customer satisfaction, time for fulfillment, productivity and product quality. Based on this value and the risk assessment models, the opportunities can be quantitatively understood in terms of measurable value.
Figure 6: A sample financial measure report
3.4. Implementation In order to validate the business model proposed in Section 3.1 and the various types of analyses previously defined, we implemented VIOLA. The VIOLA architecture consists of four layers of components, as shown in Figure 7. The Analysis Capability Layer presents business entities and allows the user to interact with them. It also provides a variety of capabilities for both qualitative and quantitative analyses of business, and helps build business transformation roadmaps driven by business strategies and based on measurable values of technologies. The Analysis Engine Layer provides a set of generic algorithms for supporting the analysis capabilities of the presentation and interaction layer, including various engines for value analysis, semantic analysis, optimization and data mining. The VIOLA Business Model Layer provides data schema for
of Solutions
Query/Result Set
Business Reports
Value Modeling
Solution
Identification
Shortfall Assessment
Heat Map Analysis
Dependency Analysis
Business Map Views
Analysis Capabilities
Portfolio Management
supporting the CBM views and the analysis capabilities, including models for business components, processes and activities, value drivers, operational metrics and performance indicators, and IT infrastructure. Finally, the CBM Tool Layer is a set of CBM-related tools developed by IBM Research including the CBM Core Tool which allows creating and viewing CBM maps, and the CBM Repository which allows sharing of CBM maps.
Analysis Engines Business Cartography
VIOLA Business Model
CBM Core Tool CBM Repository Eclipse Plugin (GEF, EMF, BIRT, …) Eclipse
Value Tracking
Operation
Figure 7: Functional architecture The VIOLA system, including the CBM Tool Layer, is implemented on the Eclipse platform. Eclipse is an open source community whose projects are focused on providing an extensible development platform and application frameworks for building software. The platform defines the set of frameworks and common services that collectively make up “integration-ware” required to support the use of Eclipse as a component model, as a rich client platform and as a comprehensive tool integration platform. The Analysis Modules of VIOLA are implemented as Eclipse plug-ins by using the Eclipse Plugin Development Environment. The environment provides a number of views and editors that make it easier to build plug-ins for Eclipse. The PDE made integrating plug-ins straightforward for the implementation of the VIOLA system, which utilized the several open source Eclipse plug-in projects, in addition to the business analysis plug-ins. For a structured data model for implementing the CBM metamodel and future needs for model interoperability, the CBM Tool and the VIOLA system use Eclipse Modeling Framework. EMF is a modeling framework and code generation facility for building tools and other applications based on a structured data model. It provides the foundation for interoperability with other EMF-based tools and applications. For the implementation of user interfaces, the CBM Tool and
the VIOLA system utilized Graphical Editing Framework. GEF allows developers to create a rich graphical editor from an existing application model. GEF employs an MVC (model-view-controller) architecture which enables simple changes to be applied to the model from the view.
4. Related work There are precursory thoughts on value-centric business transformation found in research reports from research firms. For example, a Forrester research report [5] discusses “installing value-based thinking.” The report describes that a strategic IT organization contributes to the organization’s ability to execute its business plan. Therefore, strategic thinking for the IT manager must include an analysis of the impact that major decisions will have outside the IT organization. The research firm also provides related discussion on the application of balanced scorecard for IT and value metrics for IT with ROI analysis of IT, “IT Value Management,” a disciplined approach to quantifying technology benefits, and improving the financial justification process for technology investments, and calculating the value of specific business and IT capabilities such as faster time-to-market [2, 6, 16]. There are numerous studies conducted for business process improvement, including reengineering, process benchmarking, process management, theory of constraints, total quality management, Six Sigma, and ISO 9000 requirements for quality management system, to name a few. However, the presented VIOLA methodology is different from these business transformation methodologies in a number of ways. VIOLA directly focuses on business value rather than is connected indirectly through processes. It departs from the traditional process-based model of business, and employs a component-based model of business, which provides a number of advantages for qualitative analysis for business. It employs a multi-level model of key performance drivers, operational metrics and value drivers to support quantitative business analysis. There also are numerous studies on return-oninvestment, metrics measurement and analysis models. Total Cost of Ownership Model by the Gartner Group provides a deterministic ROI model for calculation designed to help consumers and enterprise managers assess direct and indirect costs as well as benefits related to the purchase of computer software or hardware [4]. Kaplan and Norton’s the balanced scorecard provides a method intended to give managers a fast, comprehensive view of the performance of a business [8]. The VIOLA
methodology is different from these business performance approaches in a number of ways. It provides a comprehensive value model that captures a multi-level model of value drivers associated business activities and components. Also, it provides a holistic approach to a multi-layer model linking business and IT semantics. Recently, a number of consulting companies also provide products and services in line with the valuebased thinking. For example, Stern Stewart & Co. and Accenture offers the high performance business approach, which uses Economic Value Added (EVA) as a metrics for demonstrating the client’s expected economic return from a business and performance improvement project [15]. EVA shares similar objectives with VIOLA and also provides certain elements that are similar to what we are working on such as “client scorecard” to identify client key issues, a simple value model, and connection of business activities with metrics. However, VIOLA is one step ahead with the CBM approach to identify “hot” components and IT shortfalls, the semantic modeling to capture and represent relationships among components, activities, value drivers and IT solution; the value modeling that translates the business value of IT solutions and prioritizes IT projects.
5. Concluding remarks Ability to demonstrate the value of IT and services is critical to business transformation initiatives and project portfolio management in enterprises. Valuebased transformation requires a structured and holistic approach to correlating value with business processes and IT capabilities, measuring and tracking value, and delivering value through business processes. This paper presented a value-centric, model-driven business transformation methodology referred to as VIOLA. VIOLA comprises four modeling elements. First, model-driven business transformation provides a multi-layer model linking business and IT semantics, and enables IT and services to accurately reflect and be driven by business value. Second, component business modeling provides a strategic-level business view of an enterprise in a dashboard, and enables business analyses based on business impacts. Third, the value modeling and risk assessment element specifies multiple levels of key performance drivers, operational metrics and value drivers, supports various quantitative business analysis including what-if analysis, and enables business optimization and risk assessment. Finally, semantic business modeling put together business components, business activities, performance
drivers and IT by capturing their relationships. In conclusion, VIOLA provides an end-to-end approach to link business value with key IT enablers and provide further business transformation opportunities.
6. References [1] APQC, “Process Classification Framework,” http://www.apqc.org. [2] J. Erickson, L. Hughes, “A Disciplined Approach To Quantifying Technology Benefits,” Forrester Report, Business View and IT View Best Practices, December 13, 2004. [3] J. W. Forrester, Industrial Dynamics, The MIT Press, October 1963. [4] Gartner, “Total Cost of Ownership,” http://www.gartner.com/4_decision_tools/measurement/ decision_tools/tco/tco.html. [5] C. Gliedman, “Instilling Value-Based Thinking, Asking The 20 Key Questions,” Forrester Report, Business View and IT View Best Practices, June 29, 2004. [6] C. Gliedman, “Calculating The Value Of Faster TimeTo-Market,” Forrester Report, IT View Best Practices, February 19, 2004. [7] IBM, “Component Business Modeling,” http://www1.ibm.com/services/us/bcs/html/ bcs_componentmodeling.html. [8] R. S. Kaplan and D. P. Norton, The Balanced Scorecard: Translating Strategy into Action, Harvard Business School Press, September, 1996. [9] J. Lee, “Model-Driven Business Transformation and Semantic Web,” Communications of ACM, December 2005. [10] J. Lee and R. Goodwin, “Ontology Management for Large-Scale Enterprise Systems,” Journal of Electronic Commerce Research and Applications, Vol. 5, No. 3, 2006. [11] D. McDavid, “The Business-IT Gap: A Key Challenge,” IBM Research Memo, http://www.almaden.ibm.com/coevolution/pdf/mcdavid. pdf. [12] Nucleus Research, ROI Financial Analysis Tools, http://www.knowledgestorm.com/search/sponsor/results /NUCLEUS1/55047/65616/1/NucleusFS/UserNewslette rOctober2005. [13] OMG, “Model Driven Architecture Guide Version 1.0.1,” http://www.omg.org/cgi-bin/doc?omg/03-06-01, March 6, 2001. [14] OMG, “Universal Modeling Language,” www.omg.org/uml/. [15] Stern Stewart & Co, “What is EVA?” http://www.sternstewart.com/evaabout/whatis.php. [16] C. Symons, “The Balanced Scorecard For IT: Value Metrics,” Forrester Report, Business View and IT View Best Practices, November 15, 2004. [17] W3C, “Web Ontology Language,” http://www.w3.org/2004/OWL/.