Hasselt University - Campus Diepenbeek. Transportation Research ..... Koninklijke bibliotheek, Den Haag, Netherlands, 2000. (8) Joh, C.-H., Arentze, T. and ...
Vanhulsel, Janssens, Wets, Vanhoof
1
Implementing an Improved Reinforcement Learning Algorithm for the Simulation of Weekly Activity-Travel Sequences
Marlies Vanhulsel Davy Janssens Geert Wets1 Koen Vanhoof Hasselt University - Campus Diepenbeek Transportation Research Institute Wetenschapspark 5, bus 6 BE - 3590 Diepenbeek Belgium Tel: +32(0)11 26 {9133; 9128; 9158; 9153} Fax: +32(0)11 26 91 99 E-mail: {marlies.vanhulsel; davy.janssens; geert.wets; koen.vanhoof}@uhasselt.be
Submission date 31/07/2007 Word count Abstract: Text: Figures: Tables: Total number of words:
1
Corresponding author
188 5264 6*250 1*250 7202
Vanhulsel, Janssens, Wets, Vanhoof
2
ABSTRACT Recently, within the area of activity-based travel demand modeling there is a general tendency to enhance the realism of these models by incorporating dynamics based on learning and adaptation processes. The research presented here attempts at contributing to the current state of the art by formulating a framework for the simulation of individual activity-travel patterns. To this end, the current research redesigns an existing reinforcement learning technique by adding a regression-tree function approximator. This artifice enables the Q-learning algorithm not only to consider more explanatory and decision variables, but also to handle a larger granularity of these dimensions. In addition, the reward function underlying the Q-learning process is drawn up carefully based on activity attributes rather than activity type. For the purpose of testing the applicability of the proposed improvements, a prototype model is implemented and applied to real-world data. The prototype model proves to learn weekly activity-travel patterns rather quickly, requiring only a limited amount of memory. Additionally, in order to validate the suggested approach, the simulated weekly activity-travel sequences are compared to the observed ones by assessing the dissimilarity based on a number of distance measures.
Vanhulsel, Janssens, Wets, Vanhoof
3
INTRODUCTION Since the introduction of activity-based travel demand modeling, several methods have been applied to forecast individual activity-travel behavior. Some more traditional techniques include logit and nested logit models (e.g. Day Activity Schedule (1) and PCATS (2)), Monte Carlo simulations (e.g. RAP (3) and SMASH (4)) and discrete choice models (e.g. CEMDAP (5) and MORPC (6)). However, more advanced computational methods, such as rule-based systems (e.g. ALBATROSS (7)), genetic algorithms (e.g. AURORA (8) and TASHA (9)) and reinforcement learning (e.g. (10)(11)(12)(13)), have been developed as well. However, the latter modeling approach in it most elementary application has proven to be insufficient for use within the current research area. (10) Therefore, this paper aims at contributing to the understanding and modeling of activity-travel sequences by: • redesigning the simple reinforcement learning algorithm based on techniques originating from the area of artificial intelligence; • developing a first prototype based on this improved reinforcement learning algorithm; and • validating the applicability of this approach by applying the prototype to a small dataset. First the research problem will be introduced in the course of a brief literature overview. Then, the basic concepts of reinforcement learning will be discussed. Next, the reinforcement learning approach extended with a regression tree-based function approximator will be elaborated. Subsequently, the data underlying the empirical section will be described. The improved reinforcement learning method will be applied to these data and the results will be presented. Conclusions and issues for future research can be found in the final section. PROBLEM DESCRIPTION The main assumption of activity-based travel demand models includes that travel is derived from individual activity schedules. Indeed, individuals execute certain activities at certain locations in their attempt to achieve certain goals. To get to the desired locations, individuals need to travel. Activity-based models thus focus on predicting simultaneously several activity-travel related dimensions, such as the activity type, duration, location and transport mode used to get to this location. The resulting activitytravel patterns constitute the basis of the assignment of the individual routes to the transportation network when estimating the aggregate travel demand. As a result, activity-based transportation models offer the opportunity of predicting travel demand more accurately because they provide a more profound insight into individual activity-travel behavior. (7)(14) Initially, activity-based modeling efforts focused at deriving models to schedule activity and travel episodes in order to match the observed activity-travel patterns, assuming a non-changing environment and fixed individual preferences. However nowadays, it is accepted that adaptation and learning need to be incorporated into the modeling framework, as individuals are part of an ever-changing environment. After all, interacting with this dynamic environment causes continuous adjustments of individual preferences, opinions and expectations. Consequently, individual decisions are prone to changes as they are taken conditionally upon previously gathered knowledge. To this purpose, dynamic activity-based models -in which individuals determine their activity-travel schedules dynamically by entering the transportation network simultaneously and interacting with each other-, are developed. (14)(15) The modeling effort proposed here aims at capturing these dynamics by use of a reinforcement learning technique. REINFORCEMENT LEARNING This section only provides a brief overview of the core of reinforcement learning. A more comprehensive description of the reinforcement learning technique can be found in Sutton and Barto (16) and Smart and Kaelbling (17). Generally, a reinforcement learning problem attempts to find an optimal policy -which consists of searching a rule to select the action yielding the highest reward in a given state.
4
Vanhulsel, Janssens, Wets, Vanhoof
The reinforcement learning process can be summarized as follows. The individual or so-called agent first perceives the state of the environment, which is composed of a number of observable variables. Based on these observations, the agent chooses an action to be performed, which boils down to determining the values of a number of decision variables. The execution of the selected action causes changes in the state of the environment. As the agent continuously interacts with his environment, the agent perceives this state transition and values its benefit. This value can be either positive (reward) or negative (penalty). The agent then processes and memorizes the triplet containing the state, the action and the reward or penalty. Subsequently, the agent starts all over again, observing the state of the environment in order to select the next action. When selecting an action, the agent appeals to the stored triplets: when faced with a state similar to a previously encountered state, actions having lead to a reward will be reinforced, while actions associated to a penalty will be avoided. (16) In the course of this learning process, the agent continuously trades off exploration of all feasible actions versus exploitation of the knowledge gathered so far. To this end, an exploration parameter pexplore is defined to reflect the probability of selecting a random action instead of the currently best one. (11) To allow for a real-world setting in which no perfect knowledge about the environment is available to the agent, the approach in the current research is founded on the model-free Q-learning technique, which also enables the agent to learn from delayed rewards. (16) A basic concept within Qlearning is the Q-value which reflects the expected value of selecting action a in state s and following the optimal policy thereafter. A Q-value corresponds to a particular state-action pair (s,a) and can be decomposed into the value of the immediate reward (or penalty) R(s,a) and the value of the next state, discounted by a factor γ: Q( s, a ) = R ( s , a ) + γ . max Q( s ' , a ' ) a'
(1)
Additionaly, the learning rate α has been introduced to enable recording previously gathered knowledge in the Q-value. The learning rate indicates the weight assigned to the value of the state-action pair (s,a) calculated according to equation (1), versus the Q-value Qt ( s, a ) computed during a previous visit to the same state-action pair. The Q-value, now defined as Qt +1 ( s, a ) , can then be rewritten to:
Qt +1 ( s, a ) = (1 − α ).Qt ( s, a ) + α . R ( s, a ) + γ . max Qt ( s ' , a ' ) a'
(2)
In the course of the learning process, these Q-values are stored in a look-up table of which each entry corresponds to a combination of feasible values for all the dimensions of the state and the action. (16) The Q-learning algorithm can be outlined as follows:
Vanhulsel, Janssens, Wets, Vanhoof
5
Initialize Q-values. Repeat N times (N = number of learning episodes) Select random state s0. Set s = s0. Repeat until the end of the learning episode Select action a. Choose exploration parameter randomly. If exploration parameter > exploration rate pexplore Choose best action. Repeat for each action from set of feasible actions A(s) Look up Q-value. Add to list. Select action a from this list with the highest Q-value. Else Choose random action. Choose action a randomly from set of feasible actions A(s). Receive immediate reward R(s,a). Observe next state s’. Update Q-value of state-action pair (s,a) according to equation (2). Set s = s’. The application of reinforcement learning within activity-based models is not novel, since it has been implemented before by Charypar and Nagel (10), Janssens et al (11) and Timmermans and Arentze (12). Yet, the application of this traditional reinforcement learning algorithm in this research area involves some limitations, as will be revealed in the following paragraph.
FUNCTION APPROXIMATION Limitations of reinforcement learning algorithm First, the traditional reinforcement algorithm is not able to account efficiently for changes in the agent’s environment, as this approach requires retraining the Q-function when changes occur. Yet, individuals do not operate in a static environment as already pointed out in the problem description. Next, the traditional algorithm requires visiting all feasible state-action pairs at least once, and preferably an infinite number of times to converge to the optimal policy. In addition, each state-action pair encountered in the course of this iterative process is stored in a look-up table. As a result, when either the number of dimensions of the state and/or the action space rises or the granularity of (some of) these dimensions increases, the amount of memory needed to store the (growing) Q-table and the time needed to estimate the Q-values accurately both increase rapidly. Furthermore, in large state space problems, it is generally not realistic to assume that an agent visits every feasible state-action pair once, and certainly not several times, during the learning process. (17) To this end, the traditional Q-learning algorithm will be revised so as to incorporate dynamics of the environment as well as to enable generalization of the state-action space to represent all feasible stateaction pairs, even the ones that have never been encountered, founded on a limited number of visited state-action pairs. Function approximation To meet above described issues, reinforcement learning can be complemented with function approximation, generalizing either the state or the action space to speed up the learning process and decrease the memory requirements. A first class of function approximation consists of variable resolution discretization, in which either the state or the action space is reduced by aggregating over similar states or
Vanhulsel, Janssens, Wets, Vanhoof
6
actions. This generalization is carried out either prior or parallel to the learning process, but needs to be implemented very carefully in order to be successful. (18) Another solution consists of replacing the discrete look-up tables entirely by function approximators capable at handling continuous variables and of generalizing across similar states and actions. To this end, existing generalization techniques from the area of supervised learning can be used. (17)(18) This solution is implemented in the current research and will be elaborated further in the next section.
Regression tree-based function approximation Within reinforcement learning, supervised learning allows the generalization needed to enhance the performance of the core algorithm, founded on the knowledge base constructed in the course of subsequent learning phases. Possible supervised learning techniques include, amongst others, artificial neural networks, statistical curve fitting and pattern recognition. (17) As opposed to most researches incorporating function approximation in reinforcement learning, this research focuses on generalizing both state and action space simultaneously. The current approach thus aims at estimating the Q-values by use of a tree induction method based on experienced (state, action, Q-value)-triplets. These triplets constitute the examples needed as input of the selected supervised learning technique. Because the target variable is the continuous Q-value, regression tree induction emerges. The improved learning algorithm now looks like this: Initialize the Q-tree. Repeat N times (N = number of learning episodes) Select random state s0. Set s = s0. Repeat until the end of the learning episode Select action a. Choose exploration parameter randomly. If exploration parameter > exploration rate pexplore Choose best action. Populate list of attainable Q-value and their corresponding action boundaries. Select action a from this list matching the highest Q-value. Else Choose random action. Choose action a randomly from set of feasible actions A(s). Receive immediate reward R(s,a). Observe next state s’. Calculate Q-value of state-action pair (s,a) according to equation (2). Save (state, action, Q-value)-triplet [s, a, Q(s,a)] to knowledge base B. Set s = s’. Fit Q-tree based on knowledge base B. The key differences to the simple reinforcement learning algorithm enclose the selection of the best action and the Q-tree induction and will be explained into more detail infra.
DATA The data are gathered in the course of the on-going project described in Arentze et al (19), aiming at collecting individual activity-travel data across Flanders (Belgium). The dataset is composed of weekly activity-travel diaries, complemented with individual and household questionnaires. To the purpose of investigating the applicability of the prototype described above, only rather complete weekly activity-
Vanhulsel, Janssens, Wets, Vanhoof
7
travel diaries of full-time working individuals being part of a four-member household are examined. As a result after filtering, carefully cleaning and completing the activity diaries, the data of ten individuals are considered. These activity-travel diaries are processed so that each activity-travel episode is defined by: • starting time; • activity type: daily shopping (1), non-daily shopping (2), education (3), social activities (4), leisure (5), bring/get activities (6), touring (7), working (8), services (9), out-of-home eating (10), sleeping (11), in-home activities (12) and a residual category, other (13); • activity duration; • day of the week; • activity history: reflects the amount of time elapsed between two consecutive episodes of the same activity category and is estimated based on the frequency that a particular activity occurs in an individual’s activity pattern as questioned in the individual survey part; • activity location: is characterized by the operating base (either the home (0) or work location (1)) and the distance from this base location; • travel mode: none (0), on foot (101), bike (102), moped (103), motor (104), car (105), train (106), bus (107), tram/subway (108), taxi (109) and a remainder category, other (110); • travel time.
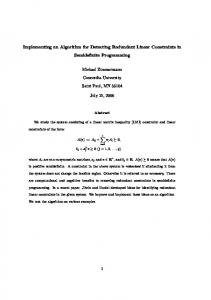
IMPLEMENTATION General Within the algorithm described here, the state dimensions enclose the starting time, weekday, current location, including location base and distance from this location base, travel mode used to get to this location and also the activity history for each activity. The action variables cover the activity type, duration, location and transport mode. Reward function The results of reinforcement learning depend largely on the design of the function defining the size of the immediate reward that the agent receives after having executed the selected action. Since this immediate reward cannot be observed directly from the activity-travel diaries, a stated preference experiment seems appropriate to capture the desired data. However, given the amount of variables and the granularity of these variables, this type of survey does not allow questioning the required level of detail. Therefore, the current research attempts to deduce this reward from statistics within the available activity-travel data (11). Besides, this reward function enables capturing differences in activity patterns according to socioeconomic variables because it entirely depends on the underlying data. Components The structure of the reward function is founded on the utility concept used in Charypar and Nagel (20). Its components are described hereafter. Firstly, the duration reward, plotted in the upper part of figure 1, reflects the extent to which the activity duration matches the average duration for that activity. When the duration approaches the average duration, the duration reward reaches its maximum value. If the duration drifts away from its average towards the minimum or maximum, the duration reward decreases. The duration reward eventually even becomes negative when the activity duration falls below the observed minimum or when it exceeds the observed maximum activity duration.
Vanhulsel, Janssens, Wets, Vanhoof
8
FIGURE 1 Duration reward and flexibility.
The reward based on the starting time of the activity attempts to capture the effect of the preferred starting time of an activity. Similar to the duration reward, the starting time reward drops when the starting time of the activity moves away from the preferred starting time. This reward accounts for the fact that activities are usually executed within certain time windows. Additionally, the weekday reward indicates the individual’s preference to execute a particular activity on a certain day of the week. For instance, an individual usually performs his daily shopping activity on Saturday, but occasionally -for a number of reasons-, he will go for grocery shopping on Monday. The weekday reward is calculated based on the relative number of activity episodes occurring on the same weekday. The fourth reward component, depending on the activity location, is divided into two separate rewards: a reward based on the base location and one based on the distance from this base location. The rationale behind this separation is supported by the fact that some locations, such as the home and work location, are stationary and serve as starting points from which other activities are organized. (21) Moreover in this research, it is assumed that individuals tend to undertake certain activities leaving from a fixed location base. To this end, the base location reward captures this preference for each activity. Furthermore in this context of activity-travel analysis, it is self-evident that the distance from the base location also plays an important role in determining the immediate reward of an action. The distance reward records the divergence of the distance between the selected location and the base location from the average distance observed in the dataset for the activity into consideration. Further, the travel time penalty, displayed in the upper part of figure 2 covers the disutility of the time required to bridge the distance between the current location and the location selected to perform the chosen activity. For travel times exceeding the observed minimum, the travel time penalty is negative and reaches its minimum when the travel time approaches the average time traveled to perform a certain activity. But for travel times below the observed minimum, the travel time penalty may become positive.
Vanhulsel, Janssens, Wets, Vanhoof
9
FIGURE 2 Travel time reward and flexibility for traveling by car.
Next to the travel time, other travel-related preferences are incorporated in the reward function by inferring a reward based on the travel mode used to get to the desired location. This reward tries to capture a number of variable properties inherent in each travel mode, which determine the individual preference to utilize a particular travel mode to execute a certain activity or to go to a certain location. Such properties include for instance safety, comfort, convenience and flexibility. The history reward is inspired by the work of Kasturirangan et al (22) investigating the extent to which activity engagement is history dependent. It is generally hypothesized that the amount of time elapsed since the last episode of a particular activity (i.e. activity history), influences the decision of undertaking the same activity as well as the duration of this activity. The history reward, shown in the upper part of figure 3, thus accounts for the consistency of activity patterns by calculating the deviation of the activity history with respect to the observed average history for each activity.
Vanhulsel, Janssens, Wets, Vanhoof
10
FIGURE 3 History reward and flexibility.
At last, the reward function includes a penalty assigned to the time spent waiting to be able to perform an activity. The waiting time penalty arises as temporal constraints limit the feasible time windows in which particular activities need to be executed. For example, daily shopping can only be executed between 8am and 8pm, whereas non-daily shopping has to take place between 9am and 6pm. Instead of assigning a large penalty to waiting, the size of the negative value of waiting is rather low for small waiting times but rises quickly with increasing waiting time, as it might be more useful to wait a few minutes, e.g. for a shop to open, instead of performing another activity with a lower overall reward first. (20) Flexibility weights Above described reward components are weighted according to the flexibility measures elaborated in Doherty (23) before aggregation. The research presented there proposes that activity-travel analysis should take into account the spatial, temporal and interpersonal flexibility of activities rather than the activity types to complement traditional dimensions, such as frequency, duration, involved persons, travel time and location. The current research defines spatial and temporal flexibility measures for each activity type matching each of the components of the reward function. On the one hand temporal flexibility captures the variability of the time dimensions, such as activity duration, starting time and activity history, with respect to the average value for these time dimensions. The activity duration flexibility is equal to the difference of the maximum duration and the minimum duration divided by the average duration for a particular activity type. The starting time and activity history flexibility values are calculated similarly, utilizing the values of 25th and 75th percentile instead of the minimum and maximum. In addition to these temporal flexibility measures, a fourth measure is computed based on the number of different days an activity has been executed in the observed activity-travel diaries. For all of these criteria, low scores indicate a relatively low temporal flexibility. The duration and history flexibility are visualized in the lower parts of figure 1 and figure 3.
Vanhulsel, Janssens, Wets, Vanhoof
11
On the other hand, spatial flexibility refers to the number of locations and their spatial distribution. To this end, two flexibility measures are determined. The first one is founded on the average number of distinct activity locations from each base location considered in the activity-travel diaries. The second one is estimated by dividing the difference between the maximum and minimum distance from one of the base locations by the average distance from this base location. The higher the value is, the more spatially flexible the activity is with respect to the distance from the considered base location. The lower part of figure 2 shows the flexibility calculated based on the average, minimum and maximum travel times. This measure is somewhat different form the ones defined in the previous paragraphs as it contains both temporal and spatial attributes. Because these flexibility measures are all used as weighting factors, reflecting the relative importance of the corresponding reward, these measures have to be redesigned. As a result, if an activity is rather fixed (low flexibility) with respect to one of the variables, the flexibility weight assigned to this dimension is rather high.
Parameter settings After having implemented the improved reinforcement learning algorithm described above, the algorithm needs to be trained. Therefore, the algorithm will iterate over 1500 learning episodes to learn the optimal activity-travel sequence. Furthermore, the step size parameter α is defined so that it decreases as the learning process progresses. The discounting factor γ has been 0.10 set to in this research. In addition, the exploration rate used in the current research remains rather high at the start and decreases slowly towards the end of the learning process, forcing the algorithm to explore at first, and switching to exploitation after a while. Regression tree The implementation of the regression tree constitutes the novel part of the improved reinforcement learning technique presented here. As opposed to the simple reinforcement learning approach -in which the Q-table is updated after having executed the selected action and observed the reward and the subsequent state- the current algorithm stores all the (state, action, Q-value)-triplets encountered in the course of the learning episode in-between and induces the Q-tree only at the end of the learning episode. This artifice has been adopted due to the fact that constructing the Q-tree every time a new example is added to the knowledge base proved to be too time consuming compared to the information gain resulting from the change in the Q-tree. The regression tree induction applied in this research is based on the CART-algorithm formulated in Breiman et al (24), based on the 5000 most recently encountered examples within the knowledge base. However, the adjustment of the traditional approach attracting the most attention is the selection of the best action in the observed state based on the Q-tree. In this stage, the agent has to assign values to all the action dimensions given the values of the state variables so as to maximize the Q-value. The essential part of the algorithm consists of populating a list of attainable Q-values starting from the known values of the state variables, and determining for each of these Q-values the corresponding boundaries, or so-called condition set, for the values of the action dimensions. The outline of this method is represented in figure 4.
Vanhulsel, Janssens, Wets, Vanhoof
12
FIGURE 4 Flow diagram of population of list containing attainable Q-values and corresponding action boundaries.
After having composed this list, the reinforcement learning agent selects the action condition set matching the highest Q-value within the list. Subsequently, the agent derives the values for all of the action dimensions to define the best action. The Q-tree in the example shown in figure 5 is based on the observed activity-travel diary data of one individual.
Vanhulsel, Janssens, Wets, Vanhoof
FIGURE 5 Example of selection of best action.
13
Vanhulsel, Janssens, Wets, Vanhoof
14
RESULTS The reinforcement algorithm has been applied to match the ten observed activity-travel sequences. The time required to learn a single weekly activity-travel patterns does not exceed 45 minutes. As figure 6 shows, the learning time per episode starts at approximately 0.1106 seconds and increases rapidly to smooth down at 1.8059 seconds. This progress has been expected in advance because the amount of examples utilized to deduce the Q-tree grows with the number of learning episodes and stabilizes at the preset limit of 5000 (cf. supra). Nevertheless, taking into consideration the amount of variables and the variable’s resolutions included in the current prototype study, the proposed learning algorithm does prove to learn rather quickly.
FIGURE 6 Run times per learning episode number
Furthermore for the purpose of validating the implemented technique, each of the simulated activity-travel patterns is matched to the corresponding observed one. To this end, the (dis)similarity of these patterns is assessed, based on the activity type, location and travel mode dimensions. The first distance measure is supplied by the Euclidean-Hamming distance. In addition, the Sequence Alignment Method (SAM) developed by Joh et al (25) -indicating how much effort (inserting, deleting or substituting elements within the pattern) is needed to equalize patterns-, is computed as well. This SAMmeasure can be determined for each dimension of the sequence separately (i.e. unidimensional SAM), but it can also estimate the pattern dissimilarity by examining all dimensions simultaneously (i.e. multidimensional SAM). Table 1 displays the results of these comparisons. Both the Euclidean-Hamming distances and the dynamic programming-based multidimensional SAM-measures reveal that the simulated patterns do not diverge considerably more from the corresponding observed ones than the observed patterns between
15
Vanhulsel, Janssens, Wets, Vanhoof
themselves. As opposed to these results, the sum of the unidimensional SAM-measure indicates that the simulated patterns do differ significantly more from the observed ones. TABLE 1 Descriptive statistics of distance measures
Observed Euclidean-Hamming
Sum of unidimensional SAM
Dynamic programming-based multidimensional SAM
Min. Max. Avg. St.dev. Min. Max. Avg. St.dev. Min. Max. Avg. St.dev..
88 162 120.18 18.94 84 230 144.24 36.59 43 120 78.08 18.46
Observed vs. simulated 85 180 139.00 30.40 108 334 240.00 64.65 64 152 107.80 26.98
CONCLUSIONS AND FUTURE RESEARCH In its goal of designing a reliable algorithm for simulating dynamic activity-travel sequences, the current paper has introduced an algorithm based on a reinforcement learning approach. This technique has been supplemented with a regression-tree function approximator to fit the needs of activity-based microsimulation. In addition, the key component of the reinforcement learning algorithm, the reward function, has been formulated so as to reflect the individual’s preferences and tendencies based on salient activity attributes. To test the applicability of this approach, a prototype model has been implemented and applied to fit observed weekly activity-travel sequences. The results have proven to be rather promising. First, the algorithm has been found to learn rather quickly. Next, the technique has been validated by comparing the resulting sequences to the observed ones based on a number of distance measures (25). The EuclideanHamming distance and the multidimensional SAM-measure have shown that the improved reinforcement learning algorithm is capable at simulating weekly activity-travel patterns that match the corresponding observed patterns quite well. To end with, some issues for future research remain. Most importantly, a revision of the regression tree induction emerges as the current implementation involves some drawbacks. After all, when the learning process progresses both the amount of memory used to store the examples and the amount of time needed to estimate the Q-tree and retrieve information from this Q-tree, increase. In addition, previously experienced examples become outdated or even invalid in the continuously changing environment, and should thus be excluded from the Q-tree estimation. Therefore, the application of other (incremental) approaches will be examined. Secondly, the improved reinforcement learning algorithm will be utilized to simulate more clusters of individuals based on the available socio-demographic and activity-travel data. Moreover, the algorithm will be adjusted to enable incorporating interactions between agents to enhance its realism. REFERENCES (1) Bowman, J.L. The Day Activity Schedule Approach to Travel Demand Analysis. PhD Dissertation, Massachusetts Institute of Technology, Cambridge, Massachusetts, USA, 1998.
Vanhulsel, Janssens, Wets, Vanhoof
16
(2) Kitamura, R. and Fujii, S. Two Computational Process Models of Activity-Travel Behavior. In T. Garling, T. Laitila and K. Westin (eds.) Theoretical Foundations of Travel Choice Modeling, 1998, pp. 251-279. (3) Kulkarni, A. and McNally, M.G. A Microsimulation of Daily Activity Patterns. Presented at the 80th Annual Meeting of the Transportation Research Board, Washington, D.C, 2001. (4) Ettema, D., Borgers, A. and Timmermans, H. SMASH (Simulation Model of Activity Scheduling Heuristics): Some Simulation. Transportation Research Record: Journal of the Transportation Research Board, No. 1551, TRB, National Research Council, Washington, D.C., 1996, pp. 88-94. (5) Bhat, C.R., Guo, J.Y., Srinivasan, S. and Sivakumar, A. A Comprehensive Econometric MicroSimulator for Daily Activity-Travel Patterns (CEMDAP). Transportation Research Record: Journal of the Transportation Research Board, No. 1894, TRB, National Research Council, Washington, D.C., 2004, pp. 57-66. (6) Anderson, R., Al-Akhras, A. and Gill, N. Implementation of a Tour-Based Microsimulation Regional Travel Demand Model. Presented at the 9th TRB Conference on the Application of Transportation Planning Methods, Louisiana, 2003, pp. 12-24. (7) Timmermans, H. ALBATROSS: a Learning-Based Transportation Oriented Simulation System. Koninklijke bibliotheek, Den Haag, Netherlands, 2000. (8) Joh, C.-H., Arentze, T. and Timmermans, H. Estimating Non-Linear Utility Functions of Time Use in the Context of an Activity Schedule Adaptation Model. Presented at the 10th International Conference on Travel Behaviour Research, Lucerne, Swiss, 2003. (9) Roorda, M.J. Activity-Based Modelling of Household Travel. PhD Dissertation, Graduate Department of Civil Enigineering, University of Toronto, Toronto, Canada, 2005. (10) Charypar, D. and Nagel, K. Q-Learning for Flexible Learning of Daily Activity Plans. Presented at the 84th Annual Meeting of the Transportation Research Board, Washington, D.C., 2005. (11) Janssens, D. Calibrating Unsupervised Machine Learning Algorithms for the Prediction of ActivityTravel Patterns. Doctoral dissertation, Hasselt University, Faculty of Applied Economics, Belgium, 2005. (12) Arentze, T.A. and Timmermans, H.J.P. Modelling Learning and Adaptation Processes in ActivityTravel Choice. Transportation, Vol. 30, No. 1, 2003, pp. 37-62. (13) Vanhulsel, M., Janssens, D. and Wets, G. Calibrating a new reinforcement learning mechanism for modeling dynamic activity-travel behavior and key events. Presented at the 86th Annual Meeting of the Transportation Board, Washington, D.C., 2007. (14) Arentze, T., Pelizaro, C. and Timmermans, H. Implementation of a Model of Dynamic ActivityTravel Rescheduling Decisions: an Agent-Based Micro-Simulation Framework. Presented at the 9th International Conference on Computers in Urban Planning and Urban Management, London, UK, 2005. (15) Arentze, T. and Timmermans, H. Modelling Learning and Adaptation in Transportation Contexts. Transportmetrica, Vol. 1, No. 1 - Special issue: Some Recent Advances in Transportation Studies, 2005, pp. 13-22. (16) Kaelbling, L.P., Littman, M.L. and Moore, A.W. Reinforcement Learning: A Survey. Journal of Artificial Intelligence Research, Vol. 4, 1996, pp. 237-285. (17) Sutton, R.S. and Barto, A.G. Reinforcement Learning: An Introduction. The MIT Press, Cambridge, Massachusetts/London, England, 1998. (18) Smart, W.D. and Kaelbling, L.P. Practical Reinforcement Learning in Continuous Spaces. Presented at the Seventeenth International Conference on Machine Learning, 2000, pp. 903-910. (19) Arentze, T., Timmermans, H., Janssens, D. and Wets, G. Modeling Short-Term Dynamics in Activity-Travel Patterns: From AURORA To FEATHERS. Presented at the Innovations in Travel Modelling Conference, Austin, Texas, 2006. (20) Charypar, D. and Nagel, K. Generating Complete All-Day Activity Plans with Genetic Algorithms. Transportation, Vol. 32, No. 4, 2005, pp. 269-397. (21) Schwanen, T. and Dijst, M. Time Windows in Workers' Activity Patterns: Empirical Evidence from the Netherlands. Transportation, Vol. 30, No. 3, 2003, pp 261-283.
Vanhulsel, Janssens, Wets, Vanhoof
17
(22) Kasturirangan, K., Pendyala, R.M. and Koppelman, F.S. History Dependency in Daily Activity Participation and Time Allocation for Commuters. Transportation Research Record: Journal of the Transportation Research Board, No. 1807, TRB, National Research Council, Washington, D.C., 2002, pp. 129-136. (23) Doherty, S.T. Should We Abandon Activity Type Analysis? Redefining Activities by Their Salient Attributes. Transportation, Vol. 33, No. 6, 2006, pp. 517-536. (24) Breiman, L., Friedman, J., Olshen, R., Stone, C. Classifcation and Regression Trees. Wadsworth, 1984. (25) Joh, C.-H. Arentze, T.A. and Timmermans, H.J.P. Pattern Recognition in Complex Activity-Travel Patterns: A Comparison of Euclidean Distance, Signal Processing Theoretical, and Multidimensional Sequence Alignment Methods. Presented at the 80th Annual Meeting of the Transportation Research Board, Washington, D.C., USA, 2001.