Noname manuscript No. (will be inserted by the editor)
Geng Deng · Michael C. Ferris
Variable-Number Sample-Path Optimization
the date of receipt and acceptance should be inserted later
Abstract The sample-path method is one of the most important tools in simulation-based optimization. The basic idea of the method is to approximate the expected simulation output by the average of sample observations with a common random number sequence. In this paper, we describe a new variant of Powell’s UOBYQA (Unconstrained Optimization BY Quadratic Approximation) method, which integrates a Bayesian Variable-Number Sample-Path (VNSP) scheme to choose appropriate number of samples at each iteration. The statistically accurate scheme determines the number of simulation runs, and guarantees the global convergence of the algorithm. The VNSP scheme saves a significant amount of simulation operations compared to general purpose ‘fixed-number’ sample-path methods. We present numerical results based on the new algorithm. Keywords sample-path method, simulation-based optimization, Bayesian analysis, trust region method Dedication This paper is dedicated to Stephen Robinson on the occasion of his 65th birthday. The authors are grateful for his encouragement and guidance over the past two decades, and the inspirational work he has done in the topic of this paper. 1 Introduction Computer simulations are used extensively as models of real systems to evaluate output responses. The choice of optimal simulation parameters can lead to improved operation, but configuring them well remains a challenging problem. Historically, the parameters are chosen by selecting the best from a set of candidate parameter settings. Simulation-based optimization [12,13, 20] is an emerging field which integrates optimization techniques into simulation analysis. The corresponding objective function is an associated measurement of an experimental simulation. Due to the complexity of the simulation, the objective function may be difficult and expensive to evaluate. Moreover, the inaccuracy of the objective function often complicates the optimization process. Indeed, derivative information is typically unavailable, so many derivative-dependent methods are not applicable to these problems. This material is based on research partially supported by the National Science Foundation Grants DMI0521953, DMS-0427689 and IIS-0511905 and the Air Force Office of Scientific Research Grant FA9550-04-10192 G. Deng Department of Mathematics, University of Wisconsin, 480 Lincoln Drive, Madison, WI 53706, USA, E-mail:
[email protected] M. C. Ferris Computer Sciences Department, University of Wisconsin, 1210 West Dayton Street, Madison, WI 53706, USA, E-mail:
[email protected]
Although real world problems have many forms, in this paper we consider the following unconstrained stochastic formulation: min f (x) = E [F (x, ξ(ω))] .
x∈Rn
(1.1)
Here, ξ(ω) is a random vector defined on a probability space (Ω, F, P ). The sample response function F : Rn ×Rd → R takes two inputs, the simulation parameters x ∈ Rn and a random sample of ξ(ω) in Rd . Given a random realization ξi of ξ(ω), F (x, ξi ) can be evaluated via a single simulation run. The underlying objective function f (x) is computed by taking an expectation over the sample response function and has no explicit form. A basic assumption requires that the expectation function f (x) is well defined (for any x ∈ Rn the function F (x, ·) is measurable, and either E[F (x, ξ(ω))+ ] or E[F (x, ξ(ω))− ] is finite, see page 57 of [31]). The sample-path method is a well-recognized technique in simulation-based optimization [11, 14, 15,25,26, 30]. It is sometimes called the Monte Carlo sampling approach [34] or the sample average approximation method [16,17,19,33,35,36]. The sample-path method has been applied in many settings, including buffer allocation, tandem queue servers, network design, etc. The basic idea of the method is to approximate the expected value function f (x) in (1.1) by averaging sample response functions N 1 ∑ f (x) ≈ fˆN (x) := F (x, ξi ), (1.2) N i=1 where N is an integer representing the number of samples. Note that by fixing a sequence of i.i.d. samples ξi , i = 1, 2 . . . , N in (1.2), the approximate function fˆN is a deterministic function. This advantageous property allows the application of deterministic techniques to the averaged samplepath problem (1.3) minn fˆN (x), x∈R
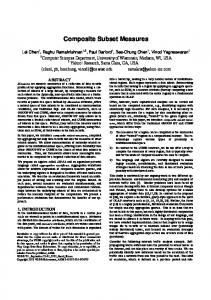
which serves as a substitute for (1.1). An optimal solution x∗,N to the problem (1.3) is then treated as an approximation of x∗ , the solution of (1.1). Note that the method is not restricted to unconstrained problems as in our paper, but it requires appropriate deterministic tools (i.e., constrained optimization methods) to be used. Convergence proofs of the sample-path method are given in [30, 32]. Suppose there is a unique solution x∗ to the problem (1.1), then under assumptions such as the sequence of functions {fˆN } epiconverges to the function f , the optimal solution sequence {x∗,N } converges to x∗ almost surely for all sample paths. Note that a sample path corresponds to a sequence of realized samples {ξ1 , ξ2 , . . .}. The almost sure statement is defined with respect to the generated probability measure P˜ of the ˜ = Ω ×Ω ×· · · . See Figure 1 for the illustration of the sample-path optimization sample path space Ω method. Our purpose in this paper is to introduce a Variable-Number Sample-Path (VNSP) scheme, an extension of sample-path optimization. The classical sample-path method is criticized for its excessive simulation evaluations: in order to obtain a solution point x∗,N , one has to solve an individual optimization problem (1.3) and at each iterate xk of the algorithm fˆN (xk ) is required (with N large). The new VNSP scheme is designed to generate different numbers of samples (N ) at each iteration. Denoting Nk as the number of samples at iteration k, the VNSP scheme integrates Bayesian techniques to determine a satisfactory Nk , which accordingly ensures the accuracy of the approximation of fˆN (x) to f (x). The numbers {Nk } form a non-decreasing sequence within the algorithm, with possible convergence to infinity. The new approach is briefly described in Figure 2. Significant computational savings accrue when k is small. There is an extensive literature on using Bayesian methods in simulation output analysis. For example, Chick and Inoue [3, 4] has implemented Bayesian estimation in ordering discrete simulation systems (ranking and selection [1, 18]). Deng and Ferris [8] propose a similar Bayesian analysis to evaluate the stability of surrogate models. Another ‘variable-sample’ scheme for sample-path optimization is proposed by Homem-de-Mello in [16]. The work proposes a framework for iterative algorithms that use, at iteration k, an estimator f Nk of the true function f constructed via the sample average of Nk samples. It is shown in [16] that, if the convergence of such an algorithm requires that f Nk (x) → f (x) almost surely for all sample 2
Fig. 1 Mechanism of the sample-path optimization method. Starting from x0 , for a given N , a deterministic algorithm is applied to solve the sample-path problem. The sequence of solutions {x∗,N } converges to the true solution x∗,∞ = x∗ almost surely.
Fig. 2 Mechanism of the new sample-path method with the VNSP scheme. Starting from x0 , the algorithm generates its iterates across different averaged sample functions. In an intermediate iteration k, it first computes a satisfactory Nk which guarantees certain level of accuracy, then an optimization step is taken exactly the same as in problem (1.3), with N = Nk . The algorithm has a globally convergent solution x∗,N∞ , where N∞ := limk→∞ Nk . The convergence is almost sure for all the sample paths, which correspond to different runs of the algorithm. The solution, we will prove later, matches the solution x∗,∞ .
paths, then it is necessary that Nk → ∞ at a certain rate. Our VNSP scheme is significantly different: Nk in our scheme is validated based on the uncertainty of the iterate xk . We require xk → x∗ almost surely, but we do not impose the convergence condition fˆNk → f . As a consequence, {Nk } is a nondecreasing sequence with the limit value N∞ being either finite or infinite. Here is a toy example showing that the limit sample number N∞ in our algorithm can be finite. Consider a simulation system with only ‘white noise’: F (x, ξ(ω)) = φ(x) + ξ(ω), where φ(x) is a deterministic function and ξ(ω) ∼ N (0, σ 2 ). As a result, the minimizer of each piece F (x, ξi ) = φ(x) + ξi coincides with the minimizer of f (x) = φ(x) (thus the solutions of fˆk are: x∗,1 = x∗,2 = · · · = x∗,∞ ). In this case, our VNSP scheme turns out to use a constant sequence of sample numbers Nk : N1 = N2 = · · · = N∞ < +∞. We obtain limk→∞ xk = x∗,N1 = · · · = x∗,N∞ = x∗ , but obviously limk→∞ fˆNk 6= f . However, the ‘variable-sample’ scheme in [16] still requires limk→∞ Nk = ∞ on this example. More details about this toy example can be found in the numerical example section. Sections of the paper are arranged as follows. In Section 2.1 we detail the underlying quadratic models that we will use and outline properties of the model construction that are relevant to the 3
sequel. In Section 2.2 we will provide the outline of the new algorithm, with a realization of the VNSP scheme. In Section 2.3, we describe the Bayesian VNSP scheme to determine the suitable value of Nk at iteration k. Section 3 provides an analysis of the global convergence properties of the algorithm. Finally, in Section 4, we discuss several numerical results on test functions. 2 The Extended UOBYQA Algorithm We apply Powell’s UOBYQA (Unconstrained Optimization BY Quadratic Approximation) algorithm [27] as our base sample-path optimization solver. The algorithm is a derivative-free approach and thus is a good fit for the optimization problem (1.3). It is designed to solve nonlinear problems with a moderate number of dimensions. The general structure of UOBYQA follows a model-based approach [5, 6], which constructs a chain of local quadratic models that approximate the objective function. The method is an iterative algorithm in a trust region framework [24], but it differs from a classical trust region method in that it creates quadratic models by interpolating a set of sample points instead of using the gradient and Hessian values of the objective function (thus making it a derivative-free tool). Besides UOBYQA, other model-based software include WEDGE [21] and NEWUOA [28]. A general framework for the model-based approach is given by Conn and Toint [6], and convergence analysis is presented in [5]. In our extension of UOBYQA, we inherit several basic assumptions regarding the nature of the objective function from [5]. Assumption 1 For a fixed y ∈ Rd the function F (·, y) is twice continuously differentiable and its gradient and Hessian are uniformly bounded on Rn ×Rd . There exist constants κF g > 0 and κF h > 0, such that the following inequalities hold: ° ° 2 ° ° ° ∂F (x, y) ° ° ∂ F (x, y) ° ° ° ≤ κF g and ° sup ° sup ° ∂x ° ° ∂ 2 x ° ≤ κF h . x∈Rn ,y∈Rd x∈Rn ,y∈Rd Assumption 2 For a given y ∈ Rd , the function F (·, y) and the underlying function f (·) are bounded below on Rn . 2.1 Interpolating quadratic model properties At every iteration of the algorithm, a quadratic model ( N )T 1 N (x − xk ) + (x − xk )T GN QN k (x) = ck + gk k (x − xk ), 2
(2.1)
is constructed by interpolating a set of adequate points (see explanation below) Ik = {y 1 , y 2 , . . . , y L }, i ˆN i QN k (y ) = f (y ),
i = 1, 2, . . . , L.
(2.2)
We will indicate how to generate the number of samples N in Section 2.3 using a Bayesian VNSP scheme. N The point xk acts as the center of a trust region, the coefficient cN k is a scalar, gk is a vector in n N R , and Gk is an n × n real symmetric matrix. The interpolation model is expected to approximate N N fˆN well around the base point xk , such that the parameters cN k , gk and Gk approximate the Taylor series expansion coefficients of fˆN around xk . Thus, gkN is used as a derivative estimate for fˆN . To ensure a unique quadratic interpolator, the number of interpolating points should satisfy L=
1 (n + 1)(n + 2). 2
(2.3)
Note that the model construction step (2.1) does not require evaluations of the gradient or the Hessian. However, for each quadratic interpolation model, we require that the Hessian matrix is uniformly bounded. 4
Assumption 3 The Hessian of the quadratic function QN k is uniformly bounded for all x in the trust region, i.e., there exists a constant κQh > 0 such that n kGN k k ≤ κQh , for all x ∈ {x ∈ R | kx − xk k ≤ ∆k }.
The notion of adequacy of the interpolation points in a ball Bk (d) := {x ∈ Rn | kx − xk k ≤ d} is defined in [5]. As a key component of the analysis, Conn, Scheinberg, and Toint address the difference of using the classical Taylor expansion model 1 T T 2 ˆN ˆN ˆN ˆN Q k (x) = f (xk ) + ∇f (xk ) (x − xk ) + (x − xk ) ∇ f (xk )(x − xk ) 2 ˆN ˆN and the interpolative quadratic model QN k . The model Qk shares the same gradient ∇f (xk ) at N xk with the underlying function, while for the interpolative model QN , its gradient g k k is merely an approximation. The error in this approximation is shown in the following lemma to decrease quadratically with the trust region radius. As an implication of the lemma, within a small trust region, the model QN k is also a decent approximation model. Lemma 1 (Theorem 4 in [5]) Assume Assumptions 1-3 hold and Ik is adequate in the trust region ˆN Bk (∆k ). Suppose at iteration k, QN k is the interpolative approximation model for the function f , then the bias of the function value and the gradient are bounded within the trust region. There exist constants κem and κeg , for each x ∈ Bk (∆k ), the following inequalities hold 2 3 |fˆN (x) − QN k (x)| ≤ κem max[∆k , ∆k ]
(2.4)
||∇fˆN (x) − gkN || ≤ κeg max[∆k , ∆2k ].
(2.5)
and
In fact, the proof of Lemma 1 is associated with manipulating Newton polynomials instead of the Lagrange functions that UOBYQA uses. Since the quadratic model is unique via interpolation (by choice of L), the results are valid regardless of how the model is constructed. Implicitly, adequacy relates to good conditioning of an underlying matrix, which enables the interpolation model to work well. Improving the adequacy of the point set involves replacing a subset of points with new ones. The paper [5] shows a mechanism that will generate adequate interpolation points after a finite number of operations. UOBYQA applies a heuristic procedure, which may not guarantee these properties, but is very effective in practice. Since this point is unrelated to the issues we address here, we state the theory in terms of adequacy to be rigorous, but use the UOBYQA scheme for our practical implementation. ˆN at the points in Ik . Let Q∞ be the ‘expected’ We have seen that QN k interpolates the function f k quadratic model interpolating the function f at the same points. The following lemma provides ∞ convergence of QN k to Qk . ∞ Lemma 2 QN k (x) converges pointwise to Qk (x) with probability 1 (w.p.1) as N → ∞.
Proof The Law of Large Numbers (LLN) guarantees the pointwise convergence of fˆN (x) to f (x) w.p.1 [31]. By solving the system of linear equations (2.2), each component of the coefficients of N N N ˆN i QN k , ck , gk (i), Gk (i, j), i, j = 1, 2, . . . , n, is uniquely expressed as a linear combination of f (y ), N i N j fˆ (y )fˆ (y ), i, j = 1, 2, . . . , L. (The uniqueness of solution requires the adequacy of the interpolaN N ∞ ∞ ∞ tion points.) Therefore, as N → ∞ the coefficients cN k , gk , Gk converge to ck , gk , Gk w.p.1 because N i i the values fˆ (y ) converge to f (y ), i = 1, 2, · · · , L, w.p.1. Finally, for a fixed value x ∈ Rn , QN k (x) converges to Q∞ (x) w.p.1. u t k 5
In the remainder of the section, we focus on deriving the posterior distributions of Q∞ k and computing the Bayes risk. These distributions will be used in Section 2.3; they are summarized in the penultimate paragraph of this subsection for a reader who wishes to skip the technical details. Assume the simulation output at points of Ik F = (F (y 1 , ξ(ω)), F (y 2 , ξ(ω)), . . . , F (y L , ξ(ω))) is a multivariate normal variable, with mean µ = (µ(y 1 ), . . . , µ(y L )) and covariance matrix Σ : µ, Σ ). F ∼ N (µ
(2.6)
Since the simulation outcomes are correlated, the covariance matrix is typically not a diagonal matrix. The existing data X N can be accumulated as an N × L matrix, with N Xi,j = f (y j , ξi ), i = 1, . . . , N, j = 1, . . . , L,
and L is the cardinality of the set Ik defined in (2.3). The data is available before the construction ˆ denote the sample mean and sample covariance matrix of the ¯ and Σ of the model QN k . Let µ data. For simplicity, we introduce the notation s i = (F (y 1 , ξi ), . . . , F (y L , ξi )), i = 1, . . . , N , so that s1 s2 XN = .. . The sample mean and sample covariance matrix are calculated as . sN ¯= µ
and
N 1 ∑ si N i=1
= (fˆN (y 1 ), . . . , fˆN (y L )),
(2.7)
1 ∑ ¯ )T (ssi − µ ¯ ). (ssi − µ N − 1 i=1
(2.8)
N
ˆ = Σ
We delve into the detailed steps of quadratic model construction in the UOBYQA algorithm. The quadratic model Q∞ k is expressed as a linear combination of Lagrange functions lj (x), Q∞ k (x)
=
L ∑
j
f (y )lj (x) =
j=1
L ∑
µ(y j )lj (x),
x ∈ Rn .
(2.9)
j=1
Each piece of lj (x) is a quadratic polynomial from Rn to R 1 lj (xk + s) = cj + gjT s + sT Gj s, 2
j = 1, 2, . . . , L,
that has the property lj (y i ) = δij ,
i = 1, 2, . . . , L,
where δij is 1 if i = j and 0 otherwise. It follows from (2.1) and (2.9) that the parameters of Q∞ k are derived as T ∞ T c∞ k = cµ , g k = g µ ,
and G∞ k =
L ∑
µ(y j )Gj ,
(2.10)
j=1
where c = (c1 , . . . , cL ) and g = (g1 , . . . , gL ). Note that the parameters cj , gj , and Gj in each Lagrange function lj are uniquely determined when the points y j are given, regardless of the function f . 6
Since we do not have any prior assumption for the distributions of µ and Σ , we assign noninformative prior distributions for them. In doing this, the joint posterior distributions of µ and Σ are derived as ˆ , N + L − 2), Σ |X N ∼ W ishartL (Σ Σ , X N ∼ N (¯ µ |Σ µ , Σ /N ).
(2.11)
Here the Wishart distribution W ishartp (νν , m) has covariance matrix ν and m degrees of freedom. The Wishart distribution is a multivariate generalization of the χ2 distribution. The distribution of the mean value µ is of most interest to us. When the sample size is large, we ˆ and asymptotcan replace the covariance matrix Σ in (2.11) with the sample covariance matrix Σ Σ, ically derive the posterior distribution of µ |X N as ˆ /N ). µ |X N ∼ N (¯ µ, Σ
(2.12)
It should be noted that, with an exact computation, the marginal distribution of µ |X N inferred by (2.11) (eliminating Σ ) is, ˆ −1 , N − 1), µ |X N ∼ StL (¯ µ, N Σ (2.13) µ, κ , m) has mean µ , precision κ , and where a random variable with Student’s t-distribution StL (µ m degrees of freedom. The normal formulation (2.12) is more convenient to manipulate than the t-version (2.13), and the results of both versions turn out to be close [9]. Therefore, in our work, we will use the normal distribution (2.12). ∞ ∞ Combining (2.10) and (2.12), the posterior distributions of c∞ k , gk and Gk are normal-like distributions: N ˆ c T /N ), ¯ T , cΣ ∼ N (ccµ c∞ k |X ˆ g T /N ), ¯ T , gΣ g ∞ |X N ∼ N (ggµ k
L ∑
N G∞ ∼ MN( k |X
ˆ P /N, P T Σ ˆ P /N ), µ ¯(y j )Gj , P T Σ
(2.14) (2.15) (2.16)
j=1
µ, ν 1 , ν 2 ) has where the L × N matrix P = (G11 , . . . , GL1 )T . The matrix normal distribution M N (µ parameters mean µ , left variance ν 1 , and right variance ν 2 [7]. In (2.16), because Gj are symmetric, the left variance and right variance coincide. While the multivariate normal assumption (2.6) is not always valid, several relevant points indicate that it is likely to be satisfied in practice [2]. – The form (2.6) is only used to derive the (normal) posterior distribution µ |X. – Other types of distribution assumptions may be appropriate in different circumstances. For example, when a simulation output follows a Bernoulli 0-1 distribution, then it would be easier to perform parameter analysis using beta prior and posterior distributions. The normal assumption (2.6) is the more relevant to continuous simulation output with unknown mean and variance. – The normal assumption is asymptotically valid for many applications. Many regular distributions, such as distributions from the exponential family, are normal-like distributions. The analysis using normal distributions is asymptotically correct.
2.2 The core algorithm In this section, we present an algorithm outline based on the general model-based approach, omitting specific details of UOBYQA. Interested readers may refer to Powell’s paper [27] for further details. Starting the algorithm requires an initial trial point x0 and an initial trust region radius ∆0 . As in a classical trust region method, a new promising point is determined from a subproblem: min QN k (xk + s),
s∈Rn
subject to ksk ≤ ∆k . 7
(2.17)
The new solution s∗,N is accepted (or not) by evaluating the ‘degree of agreement’ between fˆN and QN k : fˆN (xk ) − fˆN (xk + s∗,N ) . (2.18) ρN k = N ∗,N ) QN k (xk ) − Qk (xk + s N If the ratio ρN k is large enough, which indicates a good agreement between the quadratic model Qk N ∗,N ˆ and the function f , the point xk + s is accepted into the set Ik . We introduce the following lemma concerning the ‘sufficient reduction’ within a trust region step. This is an important but standard result in the trust region literature.
Lemma 3 The solution s∗,N of the subproblem (2.17) satisfies k QN k (xk )
−
QN k (xk
∗,N
+s
)≥
κmdc kgkN k min
[
kgkN k , ∆k κQh
] (2.19)
for some constant κmdc ∈ (0, 1) independent of k. Proof For the Cauchy point xk + sN c defined as the minimizer of the model in the trust region along the steepest decent direction, we have a corresponding reduction [22] [ N ] 1 N kgk k N ∗,N QN (x ) − Q (x + s ) ≥ kg k min , ∆ (2.20) k k k . k k c 2 k κQh Since the solution s∗,N of the subproblem yields an even lower objective value of QN k , we have the inequality (2.19). The complete proof can be found in [24]. u t ∞ Comment 1: Lemma 3 is generally true for models QN k and Qk . Comment 2: There are issues concerning setting the values of κmdc and κQh in an implementation. For κmdc , we use a safeguard value of 0.49, which is slightly smaller than 12 . This value is true for Cauchy points, so is valid for the solutions of the subproblem. For κQh , we update it as the algorithm proceeds ) ( (2.21) κQh := max κQh , kGN k k ,
that is, κQh is updated whenever a new GN k is generated. Assumption 3 ensures the boundedness of the sampled Hessian and prevents the occurrence of ill-conditioned problems. It is hard to find a good value of κQh satisfying Assumption 3, but in practice the above scheme updates the value very infrequently. It may happen that the quadratic model becomes inadequate after a potential step. Accordingly, UOBYQA first checks and improves the adequacy of Ik before the trust region radius is updated following standard trust region rules. Whenever a new point x+ enters (the point x+ may be the solution point xk +s∗,N or a replacement point to improve the geometry), the agreement is rechecked to determine the next iterate. We now present the extended UOBYQA algorithm that uses the VNSP scheme that we describe in the next section. The constants associated with the trust region update are: 0 < η0 ≤ η1 < 1, 0 < γ0 ≤ γ1 < 1 ≤ γ2 , ²1 > 0 and ²2 ≥ 1. Algorithm 1 Choose a starting point x0 , an initial trust region radius ∆0 and a termination trust region radius ∆end . 1. Generate initial trial points in the interpolation set Ik . Determine the first iterate x1 ∈ Ik as the best point in Ik . 2. For iterations k = 1, 2, . . . (a) Determine Nk via the VNSP scheme in Section 2.3. Nk k (b) Construct a quadratic model QN k of the form (2.1) which interpolates points in Ik . If kgk k ≤ Nk ²1 and Ik is inadequate in Bk (²2 kgk k), then improve the quality of Ik . (c) Solve the trust region subproblem (2.17). Evaluate fˆNk at the new point xk +s∗,Nk and compute k the agreement ratio ρN in (2.18). k 8
∗,Nk k (d) If ρN into Ik . If a point is added to the set Ik , another element in k ≥ η1 , then insert xk +s k Ik should be removed to maintain the cardinality |Ik | = L. If ρN k < η1 and Ik is inadequate in Bk , improve the quality of Ik . (e) Update the trust region radius ∆k : k ∈ [∆k , γ2 ∆k ], if ρN k ≥ η1 ; k (2.22) ∆k+1 ∈ [γ0 ∆k , γ1 ∆k ], if ρN k < η1 and Ik is adequate in Bk (∆k ); = ∆k , otherwise.
(f ) When a new point x+ is added into Ik , if k ρˆN k =
fˆNk (xk ) − fˆNk (x+ ) ≥ η0 , k ∗,Nk ) − QN k (xk + s
k QN k (xk )
(2.23)
then xk+1 = x+ , otherwise, xk+1 = xk . (g) Check whether any of the termination criteria is satisfied, otherwise repeat the loop. The termination criteria include ∆k ≤ ∆end and hitting the maximum limit of function evaluations. 3. Evaluate and return the final solution point. Note that in the algorithm a successful iteration is claimed only if the new iterate xk+1 satisfies the condition k ρˆN k ≥ η0 , otherwise, the iteration is called unsuccessful.
2.3 Bayesian VNSP scheme We have implemented the VNSP scheme within UOBYQA because UOBYQA is a self-contained algorithm that includes many nice features such as initial interpolation point design, adjustment of the trust region radii and geometry improvement of the interpolation set. The goal of a VNSP scheme is to determine the suitable sample number Nk to be applied at iteration k. As a consequence, the algorithm, performing on averaged sample function fˆNk , produces solutions xk that converge to x∗,N∞ = x∗,∞ (see Figure 3).
Fig. 3 Choose the correct Nk and move the next iterate along the averaged sample function fˆNk .
9
N ∗,N In our algorithm, QN ) is the observed model reduction, which serves to k (xk ) − Qk (xk + s promote the next iterate (i.e., used to compute the agreement ρN k in (2.18)). The key idea for the global convergence of algorithm is that, by replacing gkN with gk∞ in (2.19), we force the model N ∗,N reduction QN ) to regulate the size of kgk∞ k, and so drive kgk∞ k to zero. We k (xk ) − Qk (xk + s present the modified ‘sufficient reduction’ criterion: ] [ ∞ kgk k N N ∗,N ∞ , ∆k . (2.24) Qk (xk ) − Qk (xk + s ) ≥ κmdc kgk k min κQh
Lemma 2 and 3 imply that increasing the replication number N lessens the bias between the quadratic ∞ ∗,N models QN , close to s∗,∞ . The k and Qk , and is likely to produce a more precise step length s criterion will be eventually satisfied when N → ∞. To ensure the ‘sufficient reduction’ criterion (2.24) is satisfied accurately, we require ]) ( [ ∞ kgk k N ∗,N ∞ , ∆ P r(EkN ) = P r QN (x ) − Q (x + s ) < κ kg k min k k k mdc k k k κQh ≤ αk , (2.25) where the event EkN is defined as the failure of (2.24) for the current N and αk is the significance ˜ In practice, the risk P r(E N ) is difficult level. The probability is taken over the sample path space Ω. k to evaluate because 1) it requires multiple sample paths, while the available data is limited to one ∞ sample path, and 2) we do not know the explicit form of Q∞ k (and hence gk ). By adapting knowledge from Bayesian inference, we approximate the risk value by a Bayesian posterior estimation based on the current observations X N P r(EkN ) ≈ P r(EkN |X N ).
(2.26)
The value P r(EkN |X N ) is thus called Bayes risk, which depends on a particular sample path. In the Bayesian perspective, the unknown quantities, such as f (x) and gk∞ , are considered as random variables, whose posterior distributions are inferred by Bayes’ rule. Given the observations X N , we have [ ∞ ( ] ) kgk k ∗,N ∞ N N k min (x + s ) < κ kg (x ) − Q P r(EkN |X N ) = P r QN X , ∆ k mdc k k k k k κQh [ ∞ N ( ]) kgk |X k N ∗,N ∞ N |X k min (x + s ) < κ kg (x ) − Q = P r QN , ∆ . k mdc k k k k k κQh (2.27) N ∗,N The left hand side QN ) of the inequality becomes a fixed quantity given X N . k (xk ) − Qk (xk + s The probability evaluation is computed with respect to the posterior distribution gk∞ |X N . Here we show the fact:
Lemma 4 The Bayes risk P r(EkN |X N ) converges to zero as N → ∞. ] [ ∞ N kgk |X k , ∆k be a sequence of random Proof For simplicity in notation, let AN = kgk∞ |X N k min κQh N ∗,N variables, and bN = QN ) be a sequence of scalars. As shown in (2.15), as N → ∞ k (xk )−Qk (xk +s the distribution g ∞ |X N converges to a delta distribution. AN also converges to a delta distribution ] [ ∞ kgk k A∞ centered at kgk∞ k min κQh , ∆k . Therefore, A∞ is essentially a constant with zero variance.
We can rewrite the Bayes risk in (2.27) as follows: ( ) P r(EkN |X N ) = P r bN < κmdc AN ( ( ) ( ) ) 1 1 ∞ = P r (bN − b∞ ) + b∞ − A∞ + A − κmdc A∞ < κmdc (AN − A∞ ) 2 2 ) ( N ∞ ∞ (b − b ) + (b − 12 A∞ ) + ( 12 A∞ − κmdc A∞ ) N ∞ . = Pr A − A > κmdc 10
As N → ∞, bN − b∞ converges to zero, b∞ − 12 A∞ ≥ 0 by Lemma 3, and 12 A∞ − κmdc A∞ converges to a strictly positive value because κmdc < 12 . Thus the right hand side of the inequality converges to a strictly positive value. Showing the Bayes risk converges to zero is equivalent to showing the random variable AN converges to A∞ in probability. If we denote aN = E[AN ], then aN → E[A∞ ] = A∞ (Theorem (3.8) p17 [10]). For a given positive value ε > 0, there exists a large enough N 0 such that when N > N 0 we have |aN − A∞ | ≤ ε/2. If N > N 0, P r(AN − A∞ > ε) ≤ P r(|AN − A∞ | > ε) = P r(|AN − aN + aN − A∞ | > ε) ≤ P r(|AN − aN | + |aN − A∞ | > ε) ≤ P r(|AN − aN | > ε/2) ≤ (2/ε)2 var(AN ). The last inequality is by the Chebyshev’s inequality [10]. Because var(AN ) decreases to zero, we have P r(AN − A∞ > ε) decreases to zero and AN converges to A∞ in probability. The proof of the lemma follows. u t Lemma 4 guarantees that P r(EkN |X N ) ≤ αk will eventually be satisfied when N is large enough. In Section 2.1, we derived the posterior distributions for the parameters of Q∞ k . These distributions can be plugged in (2.27) to evaluate the Bayes risk. However, the exact evaluation ] [ of the probkg ∞ |X N k
k , ∆k . ability is hard to compute, especially involving the component κmdc kgk∞ |X N k min κQh Instead we use the Monte Carlo method to approximate the probability value: we generate M random samples from the posterior distribution of gk∞ |X N . Based on the samples, we check the event of ‘sufficient reduction’ and make a count on the failed cases: Mf ail . The probability value in (2.27) is then approximated by Mf ail P r(EkN |X N ) ≈ . (2.28) M The approximation becomes accurate as M increases. Normally, we use a large value M = 500. Note that this does not require any new evaluations of the sample response function, but instead samples from the inferred Bayesian distribution gk∞ |X N . We actually enforce a stricter accuracy on the fraction value for reasons that will be described below: Mf ail αk ≤ . (2.29) M 2 A complete description of our Bayesian VNSP scheme follows:
The VNSP scheme At the kth iteration of the algorithm, start with N = Nk−1 . Loop 1. Evaluate N replications at each point y j in the interpolation set Ik , to construct the data matrix X N . Note: data from previous iterations can be included. ∗,N 2. Construct the quadratic model QN . k and solve the subproblem for xk + s 3. Update the value of κQh by (2.21). 4. Compute the Bayesian posterior distributions for the parameters of Q∞ k as described above. 5. Validate the Monte Carlo estimate (2.29). If the criterion is satisfied, then stop with Nk = N ; otherwise increase N , and repeat the loop. Since a smaller Nk is preferable, a practical approach is to sequentially allocate computing resources: starting with N = Nk−1 , we decide to increase N or keep N by checking (2.29). If rejected, N is updated as N := N · β, where β is an incremental factor. Otherwise, the current N is used as the sample number Nk at iteration k. Two approximation steps (2.26) and (2.28) are employed in the computation. The following assumptions formally guarantee that risk P r(EkN ) is eventually approximated by the Monte Carlo fraction value Mf ail /M . 11
Assumption 4 The difference between the risk P r(EkN ) and the Monte Carlo estimation value is bounded by α2k ¯ ¯ ¯ ¯ ¯P r(EkN ) − Mf ail ¯ ≤ αk . ¯ M ¯ 2 M
f ail When M → ∞, M approaches the Bayes risk P r(EkN |X N ). The assumption essentially guarantees the Bayes risk P r(EkN |X N ) is a good approximation of the real risk P r(EkN ). Under this assumption and the criterion (2.29), it implies ¯ ¯ ¯ ¯ ¯ αk Mf ail ¯¯ ¯¯ Mf ail ¯¯ αk + ≤ + = αk , |P r(EkN )| ≤ ¯¯P r(EkN ) − M ¯ ¯ M ¯ 2 2
which guarantees the accuracy of the ‘sufficient reduction’ criterion (2.25). The algorithm enforces (2.29) and the convergence proof can thus use the criterion (2.25). Assumption 5 The sequence of significance level values {αk } satisfy the property: ∞ ∑
αk < ∞.
(2.30)
k=1
The assumption necessitates a stricter accuracy to be satisfied as the algorithm proceeds, which allows the use of the Borel-Cantelli Lemma in probability theory. Lemma 5 ((1st) Borel-Cantelli Lemma) Let {EkN } be a sequence of events, and the sum of the probabilities of EkN is finite, then the probability of infinitely many EkN occur is 0. t Proof See the book by Durrett [10]. u Consider the event EkN to be the failure to satisfy the ‘sufficient reduction’ criterion (2.24). Given the error rate (2.25) and Assumption 5, the Borel-Cantelli Lemma provides that the events EkN only happen finitely many times w.p.1. Therefore, if we define K as the first successful index after all failed instances, then (2.24) is satisfied w.p.1 for all iterations k ≥ K. We will use this without reference in the sequel. Finally, we will require the following uniformity assumptions to be valid in the convergence proof. Assumption 6 Given two points x1 , x2 ∈ Rn , the sample response difference of the two points is F (x1 , ξ(ω)) − F (x2 , ξ(ω)). We assume that the 2nd and 4th central moments of the sample response difference are uniformly bounded. For simplicity, we denote the ith central moment of a random variable Z as ϕi (Z), that is ϕi (Z) = E[(Z − EZ)i ]. Then the assumptions are, for any x1 , x2 ∈ Rn , ϕ2 (F (x1 , ξ(ω)) − F (x2 , ξ(ω))) ≤ κσ2 ϕ4 (F (x1 , ξ(ω)) − F (x2 , ξ(ω))) ≤ κσ4
(2.31) (2.32)
for some constants κσ2 and κσ4 . Note that difference of the underlying function is the mean of the sample response difference f (x1 ) − f (x2 ) = E[F (x1 , ξ(ω)) − F (x2 , ξ(ω))]. The assumptions in fact constrain the gap between the change of the sample response function and the change of the underlying function. The 4th central moment exists for almost all statistical distributions. In Assumption 6, we consider two points x1 and x2 , because we would like to constrain their correlations (covariance, high order covariance) as well. 12
Moreover, for the averaged sample function fˆN (x), ) ( ϕ4 fˆN (x1 , ξ(ω)) − fˆN (x2 , ξ(ω)) 1 3(N − 1) 2 ϕ4 (F (x1 , ξ(ω)) − F (x2 , ξ(ω))) + ϕ2 (F (x1 , ξ(ω)) − F (x2 , ξ(ω))) 3 N ( N3 ) 1 3(N − 1) 2 1 = 2 ϕ4 (F (x1 , ξ(ω)) − F (x2 , ξ(ω))) + ϕ2 (F (x1 , ξ(ω)) − F (x2 , ξ(ω))) N N N ) 1 ( ≤ 2 κσ4 + 3κ2σ2 . (2.33) N =
Therefore, Assumption 6 implies that the 4th central moment of the change of averaged sample function decreases quadratically fast with the sample number N .
3 Convergence Analysis of the Algorithm Convergence analysis of the general model-based approach is given by Conn, Scheinberg, and Toint in [5]. Since the model-based approach is in the trust region framework, their proof of global convergence follows general ideas for the proof of the standard trust region method [22, 24]. We start by showing that there is at least one stationary accumulation point. The stationary point of a function is a point at which the gradient of the function is zero. The idea is to first show that the gradient gk∞ , driven by the ‘sufficient reduction’ criterion (2.24), converges to zero, and then prove that k∇f (xk )k converges to zero as well. Lemma 6 Assume Assumptions 1–6 hold. If kgk∞ k ≥ ²g for all k and for some constant ²g > 0, then there exists a constant ²∆ > 0 such that w.p.1, ∆k > ²∆ , for all k ≥ K.
(3.1)
Proof Given the condition kgk∞ k ≥ ²g , we will show that the corresponding ∆k cannot become too small, therefore, we can derive the constant ²∆ . Let us evaluate the following term associated with the agreement level ¯ ¯ ¯ fˆNk (x + s∗,Nk ) − QNk (x + s∗,Nk ) ¯ ¯ ¯ k k Nk k (3.2) |ρk − 1| = ¯ ¯. Nk k ∗,Nk ) ¯ ¯ (x + s (x ) − Q QN k k k k By Lemma 1, we compute the error bound for the numerator ¯ ¯ ¯ ¯ ˆNk N ¯f (xk + s∗,Nk ) − Qk k (xk + s∗,Nk )¯ ≤ κem max[∆2k , ∆3k ]. Note that when ∆k is small enough, satisfying the condition [ ] κmdc ²g (1 − η1 ) ∆k ≤ min 1, , max[κQh , κem ]
(3.3)
(3.4)
according to the facts η1 , κmdc ∈ (0, 1) and kgk∞ k ≥ ²g , we deduce ∆k ≤
kgk∞ k . κQh
(3.5)
For the denominator in (3.2), our ‘sufficient reduction’ criterion (2.24) provides a lower bound for Nk ∗,Nk k ). When k ≥ K the inequality holds w.p.1 QN k (xk ) − Qk (xk + s [ ∞ ] kgk k Nk Nk ∞ ∗,Nk ) ≥ κmdc kgk k min Qk (xk ) − Qk (xk + s , ∆k = κmdc kgk∞ k∆k . (3.6) κQh 13
Combining (3.2), (3.3), (3.4) and (3.6), the following inequality holds w.p.1 for iteration k ≥ K ¯ ¯ ¯ fˆNk (x + s∗,Nk ) − QNk (x + s∗,Nk ) ¯ ¯ ¯ k k k k |ρN ¯ k − 1| = ¯¯ Nk Nk ∗,N k ¯ Qk (xk ) − Qk (xk + s ) κem max[∆2k , ∆3k ] κmdc kgk∞ k∆k κem ∆k ≤ κmdc kgk∞ k ≤ 1 − η1 .
≤
(3.7)
Nk k The criterion ρN k ≥ η1 implies the identification of a good agreement between the model Qk Nk ˆ and the function f , which will induce an increase of the trust region radius ∆k+1 ≥ ∆k (2.22). We thus have k ρN k ≥ η1 valid w.p.1 for all k ≥ K.
According to (3.4), it is equivalent to say that ∆k can shrink only when [ ] κmdc ²g (1 − η1 ) ∆k ≥ min 1, . max[κQh , κem ] We therefore derive a lower bound for ∆k : [ ] κmdc ²g (1 − η1 ) ∆k > ²∆ = γ0 min 1, , for k ≥ K. max[κQh , κem ]
(3.8)
u t Theorem 1 Assume Assumptions 1–6 hold. Then, w.p.1 lim inf kgk∞ k = 0. k→∞
(3.9)
Proof We prove the statement (3.9) by contradiction. Suppose there is ²g > 0 such that kgk∞ k ≥ ²g .
(3.10)
By Lemma 6, we have w.p.1, ∆k > ²∆ for k ≥ K. We first show there exists only finitely many successful iterations. If not, suppose we have infinitely many successful iterations. At each successful iteration k ≥ K, by (2.18), (2.24), (3.10) and ∆k > ²∆ , the inequality [ ] Nk ∗,Nk k fˆNk (xk ) − fˆNk (xk+1 ) ≥ η0 QN (x ) − Q (x + s ) k k k k [ ] ²g ≥ η0 κmdc ²g min , ²∆ (3.11) κQh holds w.p.1. We will discuss two situations here: (a) when the limit of the sequence limk→∞ Nk = N∞ is a finite number, and (b) when N∞ is infinite. Both situations are possible in our algorithm. For simplicity, we denote S as the index set of successful iterations and define [ ] ²g ²d := η0 κmdc ²g min , ²∆ , κQh the positive reduction in right hand side of (3.11). 14
˜ ≥ K such that Nk = N∞ for k ≥ K. ˜ Since Situation (a): If N∞ < ∞, then there exists an index K N∞ ˆ ˜ is monotonically decreasing {f (xk )| k ≥ K} ∑
)≥ fˆN∞ (xK˜ ) − fˆN∞ (xK+1 ˆ
fˆN∞ (xk ) − fˆN∞ (xk+1 )
˜ ˆ k≥K,k≤ K, k∈S
ˆ d, ≥ t(K)²
(3.12)
ˆ is a large index in S and t(K) ˆ is a count number of indexes in the summation term. Since where K N∞ ˆ f is bounded below (Assumption 2), we know that fˆN∞ (xK˜ ) − fˆN∞ (xK+1 ) is a finite value. ˆ However, the right hand side goes to infinity because there are infinitely many indexes in S w.p.1 ˆ → ∞, as K ˆ → ∞ ). This induces a contradiction, therefore, there are only a finite number of (t(K) successful iterations. Situation (b): For this situation, N∞ = ∞. Let us define a specific subsequence of indexes {kj 0 | kj 0 ≥ K} (see Figure 4), indicating where there is a jump in Nk , i.e., a truncated part of subsequence is · · · < Nkj0 = Nkj 0 +1 = · · · = Nkj0 +1 −1 < Nkj 0 +1 = · · · . Let S 0 be a subset of {kj 0 }, including kj 0 if there is at least one successful iteration in {kj 0 , . . . , kj 0 +1 − 1}.
Fig. 4 Illustration of the subsequence {kj 0 }
This implies
{ xkj0 +1
6 xkj0 , = for kj 0 ∈ S 0 ; = xkj0 (unchanged) , for kj 0 ∈ / S 0.
For kj 0 ∈ S 0 , sum the inequality (3.11) for k ∈ {Nkj0 , . . . , Nkj0 +1 −1 } to derive ∑
N N fˆ kj 0 (xkj0 ) − fˆ kj 0 (xkj0 +1 ) ≥
N N fˆ kj0 (xk ) − fˆ kj0 (xk+1 )
k≥kj 0 ,k≤kj 0 +1 −1 k∈S 0
≥ ²d .
(3.13)
N N We want to quantify the difference between fˆ kj0 (xkj 0 ) − fˆ kj0 (xkj 0 +1 ) and f (xkj 0 ) − f (xkj 0 +1 ). N The idea behind this is that moving from xkj0 to xkj0 +1 , the function fˆ kj0 decreases, and so does the underlying function f . Since infinitely many decrement steps for f are impossible, we derive a contradiction.
15
ˆk 0 as the occurrence of fˆNkj 0 (xk 0 ) − fˆNkj0 (xk 0 ) ≥ ²d while f (xk 0 ) − Define the event E j j j +1 j ²d f (xkj 0 +1 ) ≤ 2 . The probability of event ( ) ˆk 0 Pr E j ) ( ) ² ) (( N N d ≤ P r fˆ kj0 (xkj0 ) − fˆ kj0 (xkj0 +1 ) − f (xkj0 ) − f (xkj 0 +1 ) ≥ 2 ) ( )¯ ² ) (¯( N ¯ ¯ N d ≤ P r ¯ fˆ kj 0 (xkj0 ) − fˆ kj0 (xkj0 +1 ) − f (xkj0 ) − f (xkj0 +1 ) ¯ ≥ 2 ((( ) ( ))4 ( ² )4 ) Nk 0 Nk 0 d ˆ ˆ j j f (xkj0 ) − f (xkj0 +1 ) − f (xkj0 ) − f (xkj0 +1 ) ≥ = Pr 2 ) ( )]4 [( 16 N N ≤ 4 · E fˆ kj 0 (xkj 0 ) − fˆ kj 0 (xkj0 +1 ) − f (xkj0 ) − f (xkj0 +1 ) ²d ) ( 16 N N = 4 · ϕ4 fˆ kj0 (xkj 0 ) − fˆ kj 0 (xkj0 +1 ) ²d ( ) 16 κσ4 + 3κ2σ2 ≤ . ²4d (Nkj0 )2 N N The third inequality is due to Markov’s inequality [10]. The random quantity fˆ kj0 (xkj0 )−fˆ kj 0 (xkj0 +1 ) has mean value f (xkj 0 ) − f (xkj0 +1 ). The last inequality is due to the implication of Assumption 6, see (2.33). ˆk decreases quadratically fast with k. Since the The result implies that probability of the event E sum of the probability values is finite ∞ ∑
(
ˆk 0 Pr E j
j 0 =1 kj 0 ∈S 0
)
( ) ∞ ∑ 16 κσ4 + 3κ2σ2 ≤ < ∞, ²4d (Nkj 0 )2 0 j =1 kj 0 ∈S 0
ˆk 0 occurs only finitely many times w.p.1. applying the Borel-Cantelli Lemma again, the event E j ¯ Thus, there exists an index K, such that f (xkj0 ) − f (xkj0 +1 ) ≥
²d ¯ kj 0 ∈ S 0 } w.p.1. , for all {kj 0 |kj 0 ≥ K, 2
¯ we derive that w.p.1 Playing the same trick as before, by summing over all kj 0 ≥ K, ∑
f (xK¯ ) − f (xK+1 )≥ ˆ
f (xkj 0 ) − f (xkj 0 +1 )
ˆ ¯ kj 0 ≥K,k j 0 ≤K kj 0 ∈S 0
ˆ ≥ t(K)
²d . 2
(3.14)
The left hand side is a finite value, but the right hand side goes to infinity. This contradiction also shows that the number of successful iterations is finite. Combining the two situations above, we must have infinitely many unsuccessful iterations when k is sufficiently large. As a consequence, the trust region radius ∆k decreases to zero lim ∆k = 0,
k→∞
which contradicts the statement that ∆k is bounded below (3.8). Thus (3.10) is false, and the theorem is proved. u t 16
Theorem 2 Assume Assumptions 1–6 hold. If lim inf kgk∞j k = 0 w.p.1 j→∞
(3.15)
holds for a subsequence {kj }, then we also have lim inf k∇f (xkj )k = 0 w.p.1. j→∞
(3.16)
Proof Due to the fact limj→ ∆kj = 0, Lemma 1 guarantees that the difference between kgk∞j k and k∇f (xkj )k is small. Thus the assertion (3.16) follows. The details of the proof refer to Theorem 11 in [5]. u t Theorem 3 Assume Assumptions 1–6 hold. Every limit point x∗ of the sequence {xk } is stationary. Proof The procedure of proof is essentially the same as given for Theorem 12 in [5]. However, we use the ‘sufficient reduction’ inequalities (3.12) when N∞ is finite and (3.14) when N∞ is infinite. u t
4 Numerical Results We apply the new UOBYQA algorithm implementing the VNSP scheme to several numerical examples. The noisy test functions are altered from deterministic functions with artificial randomness. The first numerical function we employed was the well-known extended Rosenbrock function. The random term was added only to the first component of the input variable. Define x ˆ(x, ξ(ω)) := (x(1) ξ(ω), x(2) , . . . , x(n) ) and the corresponding function becomes F (x, ξ(ω)) =
n−1 ∑
100(ˆ x(i+1) − x ˆ2(i) )2 + (ˆ x(i) − 1)2 .
(4.1)
i=1
We assume ξ(ω) is a normal variable centered at 1: ξ(ω) ∼ N (1, σ 2 ). As a general setting, the initial and end trust region radius ∆0 , ∆end were set to 2 and 1.0e − 5, respectively. Implementing the algorithm required a starting value N0 = 3, which was used to estimate the initial sample mean and sample covariance matrix. We believe such a value is the minimum required for reasonable estimates. Larger values of N0 would in most cases lead to wasted evaluations. M = 500 (see (2.28)) trials samples were generated to evaluate the Bayes probability (2.27) in the VNSP procedure. To satisfy Assumption 5, the sequence {αk } was pre-defined as αk = 0.5 × (0.98)k . Table 1 presents the details about a single-run of the new algorithm on the two-dimensional Rosenbrock function with σ 2 = 0.01. The starting point was chosen to be (-1,1.2), and the maximum number of function evaluations was 10000. We recorded the iteration number k when there was a change in Nk . For example, Nk remained at 3 in iterations 1–19, and Nk changed to 4 at iteration 20. Since in the first 19 iterations, the averaged sample function was fˆ3 , all the steps were taken regarding fˆ3 as the objective function. Therefore, it was observed that the iterates xk moved toward the solution x∗,3 of the averaged sample problem (1.3) with N = 3. In Table 2 we present the corresponding sample-path solution of the optimization problem (1.3). For example, x∗,3 = (0.5415, 0.2778). Note 17
Table 1 The performance of the new algorithm for the noisy Rosenbrock function, with n = 2 and σ 2 = 0.01. Iteration k 0 19 20 21 22 23 24 29 30 31 32 33 35 36 37
Nk 3 3 4 5 22 22 30 30 113 113 221 604 604 845 1183
FN 3 81 91 102 226 248 326 476 1087 1200 1848 4750 5958 8249 10277
xk (-1.0000,1.2000) (0.5002,0.2449) (0.5002,0.2449) (0.5208,0.2904) (0.5082,0.2864) (0.5082,0.2864) (0.5082,0.2864) (0.4183,0.1862) (0.4328,0.1939) (0.4328,0.1939) (0.4328,0.1939) (0.4328,0.1939) (0.4276,0.1837) (0.4197,0.1774) (0.4172,0.1760)
f¯Nk (xk ) 11.7019 0.3616 0.4904 0.4944 0.4018 0.4018 0.5018 0.4447 0.4290 0.4290 0.4437 0.4601 0.4569 0.4556 0.4616
∆k 2.0 0.1 0.05 0.02 0.02 0.02 0.02 0.04 0.02 0.02 0.02 0.01 0.0125 0.0101 0.0101
that, in order to derive the solution to f in the two dimensional problem, the noisy Rosenbrock function was rearranged as [ ] f (x) = E 100(ˆ x(2) − x ˆ2(1) )2 + (ˆ x(1) − 1)2 = 100x2(2) + 1 − 2x(1) E[ξ] + (−200x(2) x2(1) + x2(1) )E[ξ 2 ] + 100x4(1) E[ξ 4 ]. By plugging the values E[ξ] = 1, E[ξ 2 ] = 1.01, and E[ξ 4 ] = 1.0603, we obtained the solution x∗,∞ = (0.4162, 0.1750), which was different from the deterministic Rosenbrock solution (1, 1). For different Nk , the averaged function fˆNk might vary greatly. In Table 1, we observe that x19 = x20 = (0.5002, 0.2449). The value of fˆN19 (x19 ) is 0.3616, while the value of fˆN20 (x20 ) is 0.4904. It shows that the algorithm actually worked on objective functions with increasing accuracy. Table 2 Averaged sample-path solution with different sample number N N 3 4 5 22 30 113 221 604 845 1183 ∞
x∗,N (0.5415,0.2778) (0.4302,0.1922) (0.4218,0.1936) (0.4695,0.2380) (0.4222,0.1896) (0.4423,0.2027) (0.4331,0.1910) (0.4226,0.1798) (0.4236,0.1807) (0.4174,0.1761) (0.4162,0.1750)
fˆNk (x∗,N ) 0.3499 0.4412 0.4395 0.3892 0.4446 0.4286 0.4427 0.4567 0.4556 0.4615 0.4632
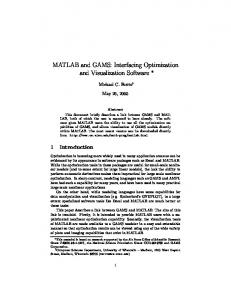
As shown in Table 1, the algorithm used a small Nk to generate new iterates in the earlier iterations. Only 476 function evaluations were applied for the first 29 iterations. This implies that when noisy effects were small compared to the large change of function values, the basic operation of the method was unchanged and Nk = N0 samples were used. As the algorithm proceeded, the demand for accuracy increased, therefore, Nk increased as well as the total number of function evaluations. We obtained very good solutions. At the end of the algorithm, we generated a solution x37 = (0.4172, 0.1760), which is close to the averaged sample-path solution x∗,N =1183 = (0.4174, 0.1761) and is better than the solution x∗,N =845 = (0.4236, 0.1807). In a standard sample-path optimization method, assuming that there are around 40 iterations in the algorithm, we need 845 × 40 = 33800 18
function evaluations for the solution x∗,N =845 and 1183 × 40 = 43720 for the solution x∗,N =1183 . Our algorithm indeed saved a significant amount of function operations. To study the changes of Nk , in Figure 5, we plot Nk against the iteration number for two problems. One is a high volatility case with σ 2 = 1 and the other is a low volatility case with σ 2 = 0.01. In both problems, Nk was 3 for the first 20 iterations, when the noise is not the dominating factor. In the later iterations, the noise became significant and we observe that the demand for Nk increased faster for the high volatility case. If we restricted the total function evaluations to be 10000, the high volatility case resulted in a early termination at the 34th iteration.
1000 900 800 σ2=0.01
700
σ2 = 1
N
k
600 500 400 300 200 100 0
0
5
10
15
20 iteration #
25
30
35
Fig. 5 Compare changes of Nk with different levels of noise
We applied the algorithm to both 2 and 10 dimensional problems. Increasing the dimension significantly increased computational burden. The problem with dimension n = 10 is already very hard to tackle. Even in the deterministic case, the standard UOBYQA requires around 1400 iterations to terminate at ∆end = 0.0001. In Table 3, we record a summary of the algorithm applied to the Rosenbrock function with different dimensions and noise levels. For comparisons, we include the result of the standard sample-path methods with fixed numbers of samples: 10, 100, and 1000. The statistical results are based on 10 replications of the algorithm. The variance of the error is small, showing that the algorithm was generally stable. For n = 10 and σ 2 = 1, we notice a big mean error 2.6 and a relatively small variance of error 0.10. This is due to the earlier termination of the algorithm when σ 2 is large (we used a limit of 20000 function evaluations in this case). There are two reasons why the standard sample-path methods yield relatively larger errors. 1) Methods SP(10) and SP(100) do not provide accurate averaged sample functions fˆN . 2) For a large sample number N , the iteration number of the algorithm is limited. For example, we can expect SP(100) is limited to 200 iterations and SP(1000) is limited to 20 iterations. Increasing the total number of function evaluations can significantly improve the performance of the sample path optimization methods. For example, if we allow 2,000,000 total function evaluations for the 10 dimensional case and the noise level σ 2 = 1, the mean error of SP(100) and SP(1000) are 1.6, 7.5, respectively. The VSNP method performs better than this. 19
Table 3 Statistical summary n 2 2 2 10 10 10
Noise level σ 2 0.01 0.1 1 0.01 0.1 1
VNSP Mean er- Variance ror error 1.1e-5 1.2e-5 8.9e-5 3.3e-5 1.1e-4 8.2e-5 0.054 0.067 0.087 0.060 2.6 0.10
of
SP(10) Mean error 0.035 0.079 0.098 0.44 2.1 14
SP(100) Mean error 0.0045 0.0067 0.0088 28 44 32
SP(1000) Mean error 7.9e-5 4.2e-4 8.9e-4 120 129 145
For another test example, we refer back to the toy example in Section 1. The objective function is only affected by ‘white noise’ F (x, ξ(ω)) = φ(x) + ξ(ω). We will show Nk is unchanged for every iteration, that is, N1 = N2 = · · · = N∞ . At iteration k, the function outputs at points y j in Ik are entirely correlated. As a result, the sample covariance matrix ˆ (2.8) is a rank-one matrix, whose elements are all identical Σ ˆ j) = a, i, j = 1, 2, . . . , L, where Σ Σ(i, a = var[(ξ1 , . . . , ξNk )]. Thus, the matrix can be decomposed as ˆ = 1 · a · 1T . Σ
(4.2)
Plug (4.2) into (2.15), we obtain the posterior covariance of gk∞ cov(gk∞ |X N ) = (gg · 1 ) · a · (gg · 1 ) = (00) · a · 0 = 0 L×L , T
T
which implies gk∞ is not random and gk∞ = gkNk . As a consequence, in the VNSP scheme, the mechanism will not increase Nk because the criterion (2.24) is always satisfied. ∑L The fact g ·11 = j=1 gj = 0 is a property of Lagrange functions. The proof is simple - the sum of ∑L Lagrange functions j=1 lj (x) is the unique quadratic interpolant of a constant function gˆ(x) = 1 ∑L at the points y j , because j 0 =1 lj 0 (y j ) = 1 = gˆ(y j ), j = 1, . . . , L. Therefore, the gradient of the ∑L interpolant j=1 gj = 0 . In practice, the behavior of the toy example occurs rarely. We present it here to show that our algorithm indeed checks the uncertainty of each iterate xk , but not that of objective value fˆNk (xk ). 5 Conclusions This paper proposes and analyzes a variable number sample-path scheme for optimization of noisy functions. The VNSP scheme applies analytical Bayesian inference to determine an appropriate number of samples Nk to use in each iteration. For the purpose of convergence, we only allow Nk to be non-decreasing. As the iterations progress, the algorithm automatically increases Nk and thus adaptively produces more accurate objective function evaluations. The key idea of choosing an appropriate Nk in the VNSP scheme is to test the Bayes risk of satisfying a ‘sufficient reduction’ criterion. Under appropriate assumptions, the global convergence of the algorithm is guaranteed: lim xk = x∗,N∞ = x∗,∞ .
k→∞
UOBYQA implements the Mor´e and Sorensen method [23] to handle the trust region subproblem. Extending our algorithm to constrained optimization problems requires corresponding tools to solve a constrained subproblem min Qk (x), s.t. kx − xk k ≤ ∆k , x ∈ S, x∈S
where S is a feasible set for x. An efficient derivative free algorithm for obtaining a global solution to the problem is not yet available. On the other hand, the techniques outlined here have potential 20
even for constrained optimization problems, because they are couched in standard trust region theory which has become prevalent in algorithm design for such problems. The VNSP scheme can be generalized to other model-based algorithms, such as the WEDGE algorithm. Our modifications are not intended to be applied to linear model based algorithms, since linear models are more sensitive to noise. In a stochastic situation, quadratic models are robust against noise and preferable to use. Some algorithms may use less than L = 12 (n + 1)(n + 2) initial points to construct quadratic models. For example, NEWUOA uses 2n + 1 points for the initial model and updates the models while minimizing the change in Frobenius norm of the curvature. The VNSP scheme should be altered to accommodate this different approach, but this will require further analysis. The new algorithm has broad practical applications. For example, we have successfully applied it to seek the optimal design of an interstitial coaxial antenna, which is used in microwave ablation treatment for hepatic cancer [29]. Since the permittivity and electric conductivity vary among patients, the optimal design is required to perform well in the averaged sense. Further applications will be addressed in future work. Acknowledgements The authors would like to thank three anonymous referees for detailed comments that helped improve the accuracy and correctness of the paper.
References 1. H.-C. Chen, C.-H. Chen, and E. Yucesan. An asymptotic allocation for simultaneous simulation experiments. In Proceedings of the 1999 Winter Simulation Conference, pages 359–366, 1999. 2. S. Chick. Personal communication. 3. S. E. Chick and K. Inoue. New procedures to select the best simulation system using common random numbers. Management Science, 47(8):1133–1149, 2001. 4. S. E. Chick and K. Inoue. New two-stage and sequential procedures for selecting the best simulated system. Operations Research, 49:1609–1624, 2003. 5. A. R. Conn, K. Scheinberg, and P. L. Toint. On the convergence of derivative-free methods for unconstrained optimization. Approximation Theory and Optimization, Tributes to M. J. D. Powell, edited by M. D. Buhmann and A. Iserles, pages 83–108, 1996. 6. A. R. Conn and Ph. L. Toint. An algorithm using quadratic interpolation for unconstrained derivative free optimization. In G. Di Pillo and F. Giannessi, editors, Nonlinear Optimization and Applications, pages 27–47. Plenum Press, New York, 1996. 7. A. P. Dawid. Some matrix-variate distribution theory: Notational considerations and a bayesian application. Biometrika, 68(1):265–74, 1981. 8. G. Deng and M. C. Ferris. Adaptation of the UOBYQA algorithm for noisy functions. In L. F. Perrone, F. P. Wieland, B. G. Lawson J. Liu, D. M. Nicol, and R. M. Fujimoto, editors, Proceedings of the 2006 Winter Simulation Conference, pages 312–319. 9. G. Deng and M. C. Ferris. Extension of the DIRECT optimization algorithm for noisy functions. 2007. Submitted to 2007 Winter Simulation Conference. 10. R. Durrett. Probability: Theory and Examples. Duxbury Press, Pacific Grove, California, 3rd edition, 2004. 11. M. C. Ferris, T. S. Munson, and K. Sinapiromsaran. A practical approach to sample-path simulation optimization. In J. A. Joines, R. R. Barton, K. Kang, and P. A. Fishwick, editors, Proceedings of the 2000 Winter Simulation Conference, pages 795–804, Orlando, Florida, 2000. Omnipress. 12. M. Fu. Optimization via simulation: A review. Annals of Operations Research, 53:199–248, 1994. 13. A. Gosavi. Simulation-Based Optimization: Parametric Optimization Techniques and Reinforcement Learning. Kluwer Academic Publishers, Norwell, MA, USA, 2003. ¨ 14. G. G¨ urkan, A. Yonca Ozge, and S. M. Robinson. Sample-path solution of stochastic variational inequalities, with applications to option pricing. In D. T. Brunner J. M. Charnes, D. J. Morrice and J. J. Swain, editors, Proceedings of the 1996 Winter Simulation Conference, pages 337–344, 1996. ¨ urkan, A. Yonca Ozge, and S. M. Robinson. Solving stochastic optimization problems with stochastic 15. G. G¨ constraints: An application in network design. In P. A. Farrington, H. B. Nembhard, D. T. Sturrock, and G. W. Evans, editors, Proceedings of the 1999 Winter Simulation Conference, pages 471–478, 1999. 16. T. Homem–de–Mello. Variable-sample methods for stochastic optimization. ACM Transactions on Modeling and Computer Simulation, 13(2), 2003. 17. T. Homem–de–Mello. On rates of convergence for stochastic optimization problems under non-I.I.D. sampling. submitted for publication, 2006. 18. S.-H. Kim and B. L. Nelson. Selecting the best system: Theory and methods. In Proceedings of the 2003 Winter Simulation Conference, pages 101–112, 2003.
21
19. A. J. Kleywegt, A. Shapiro, and T. Homem–de–Mello. The sample average approximation method for stochastic discrete optimization. SIAM Journal on Optimization, 12:479–502, 2001. 20. A. Law and W. Kelton. Simulation Modeling and Analysis. McGraw-Hill, New York, third edition, 2000. 21. M. Marazzi and J. Nocedal. Wedge trust region methods for derivative free optimization. Mathematical Programming, 91:289–305, 2002. 22. J. J. Mor´e. Recent developments in algorithms and software for trust region methods. In Mathematical Programming: The State of the Art, pages 258–287. Springer Verlag, 1983. 23. J. J. Mor´e and D. C. Sorensen. Computing a trust region step. SIAM Journal on Scientific and Statistical Computing, 4:553–572, 1983. 24. J. Nocedal and S. J. Wright. Numerical Optimization. Springer, New York, second edition, 2006. 25. E. L. Plambeck, B. R. Fu, S. M. Robinson, and R. Suri. Throughput optimization in tandem production lines via nonsmooth programming. In J. Schoen, editor, Proceedings of the 1993 Summer Computer Simulation Conference, pages 70–75, San Diego, California, 1993. Society for Computer Simulation. 26. E. L. Plambeck, B. R. Fu, S. M. Robinson, and R. Suri. Sample-path optimization of convex stochastic performance functions. Mathematical Programming, 75:137–176, 1996. 27. M. J. D. Powell. UOBYQA: Unconstrained optimization by quadratic approximation. Mathematical Programming, 92:555–582, 2002. 28. M. J. D. Powell. The NEWUOA software for unconstrained optimization with derivatives. DAMTP Report 2004/NA05, University of Cambridge, 2004. 29. P. Prakash, G. Deng, M. C. Converse, J. G. Webster, David M. Mahvi, and M. C. Ferris. Design optimization of a robust sleeve antenna for hepatic microwave ablation. Working paper. 30. S. M. Robinson. Analysis of sample-path optimization. Mathematics of Operations Research, 21:513–528, 1996. 31. A. Ruszczy´ nski and A. Shapiro. Stochastic programming models. In Stochastic Programming, pages 1–63. Elsevier, Amsterdam, Netherlands, 2003. 32. A. Shapiro. Asymptotic behavior of optimal solutions in stochastic programming. Mathematics of Operations Research, 18:829–845, 1993. 33. A. Shapiro. Statistical inference of stochastic optimization problems. In S. P. Uryasev, editor, Probabilistic Constrained Optimization: Methodology and Applications, pages 91–116. Kluwer Academic Publishers, 2000. 34. A. Shapiro. Monte Carlo sampling approach to stochastic programming. In J. P. Penot, editor, ESAIM: Proceedings, volume 13, pages 65–73, 2003. 35. A. Shapiro. Monte Carlo sampling methods. In Stochastic Programming, pages 1–63. Elsevier, Amsterdam, Netherlands, 2003. 36. A. Shapiro and T. Homem–de–Mello. A simulation-based approach to two-stage stochastic programming with recourse. Mathematical Programming: Series A, 81(3):301–325, 1998.
22