Multiple View Image Denoising Li Zhang Sundeep Vaddadi University of Wisconsin
[email protected]
[email protected]
Abstract We present a novel multi-view denoising algorithm. Our algorithm takes noisy images taken from different viewpoints as input and groups similar patches in the input images using depth estimation. We model intensity-dependent noise in lowlight conditions and use the principal component analysis and tensor analysis to remove such noise. The dimensionalities for both PCA and tensor analysis are automatically computed in a way that is adaptive to the complexity of image structures in the patches. Our method is based on a probabilistic formulation that marginalizes depth maps as hidden variables and therefore does not require perfect depth estimation. We validate our algorithm on both synthetic and real images with different content. Our algorithm compares favorably against several state-of-the-art denoising algorithms.
1. Introduction Capturing a pinhole image (large depth-of-field) is important to many computer vision applications, such as 3D reconstruction, motion analysis, and video surveillance. For a dynamic scene, capturing pinhole images however is difficult: we have often to make a tradeoff between depth-of-field and motion blur. For example, if we use a large aperture and short exposure to avoid motion blur, the resulting images will have small depth-of-field; otherwise, if we use a small aperture and long exposure, the depth-of-field will be large, but at the expense of motion blur. In this work, we propose a new approach to acquiring pinhole images using many pinhole cameras. The cameras can be distributed spatially to monitor a common scene, or compactly assembled as a camera array. Each camera uses a small aperture and short exposure to ensure minimal optical defocus and motion blur. Under such camera settings, the incoming light is very weak and the images are extremely noisy. We cast pinhole imaging as a denoising problem and seek to restore all the pinhole images by jointly removing noise in different viewpoints. Using multi-view images for noise reduction has a unique advantage: pixel correspondence from one image to all other images is determined by its single depth map. This advantage contrasts with video denoising, where motion between frames in general has many more degrees of freedom. Although this observation is a common sense in 3D vision, we are the first to use it for finding similar image patches in multi-view denoising. Specifically, our denoising method is built upon the recent development in image denoising literature, where similar image patches are grouped together and “collaboratively” filtered to reduce noise. When considering whether a pair of patches
Hailin Jin Adobe Systems Inc.
Shree K. Nayar Columbia University
[email protected]
[email protected]
in one image is similar or not, we simultaneously consider the similarity between corresponding patches in all other views using depth estimation. This depth-guided patch matching improves patch grouping accuracy and substantially boosts denoising performance, as demonstrated later in this paper. The main contributions of our work include: • Depth-guided denoising: Using depth estimation as a constraint, our method is able to group similar image patches in the presence of large noise and exploit data redundancy across views for noise removal. • Removing signal-dependent noise: In low-light conditions, photon noise is manifest whose variance depends on its mean. We propose to use the principal component analysis and tensor analysis to remove such noise. • Adaptive noise reduction: For both PCA and tensor analysis, we propose an effective scheme to automatically choose dimensionalities in a way that is adaptive to the complexity of image structures in the patches. • Tolerance to depth imperfection: Our method is based on a probabilistic formulation that marginalizes depth maps as hidden variables and therefore does not require perfect depth estimation. From an application perspective, our approach does not require any change in camera optics or image detectors. All it uses is a set of pinhole cameras, such as those equipped on cell phones. Such flexibilities make our method applicable to places that can only take miniaturized cameras with simple optics, such as low-power video surveillance networks, portable camera arrays, and multi-camera laparoscopy. In all cases, the baselines between different cameras can be appreciable, making it possible to reconstruct the 3D scene structure from the denoised images, which can then be used in other applications, such as refocusing, new view synthesis, and 3D object detection and recognition.
2. Related Work In the last decade, great progress has been made in image denoising, for example [17, 2, 7, 14, 6, 19, 8], just to name a few. We refer the readers to the previous work sections in [2, 6] for excellent reviews of the literature. Among these methods, several produce very impressive results, such as non-local mean [2], BM3D [6], and SA-DCT [8]. All these methods are built upon the same observation that local image patches are often repetitive within an image. Similar patches in an image are grouped together and “collaboratively” filtered to remove noise. While these methods have different algorithmic details, their performance is comparable. Although there
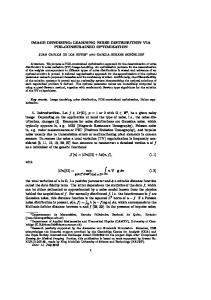
3. Problem Statement and Solution Overview Let I = {Im }M m=1 be a set of images taken from M different viewpoints at the same time instant. We model each image as a sum of its underlying noiseless image, Gm , and zero-mean noise, nm : Im = Gm + nm . (1) Figure 1. The relationship between pixel mean (horizonal-axis) and variance (vertical-axis) for Nikon D50 (left) and PointGrey Dragonfly Express (right). Each red point represents the (mean,variance) of a pixel estimated from multiple images of a static scene. The blue lines are the linear regression of the red points. This figure validates our noise variance model of Eq. (2).
is no theoretic proof, we conjecture that the performance limit of single-image denoising has probably been reached. One approach to break this limit is to use more input images, such as video denoising [1, 5, 3]. To exploit redundant data in a video, similar patches need to be matched over time for noise removal. Another way of leveraging more input images is to reconstruct a clean image from noisy measurements from multiple viewpoints, proposed by Vaish et al. [20]. Only image redundancy across viewpoints is exploited in [20], and patch similarity within individual images is however neglected. In [10], Heo et al. proposed to combine NL-mean denoising with binocular stereo matching, therefore exploiting data redundancy both across views and within each image. Heo et al.’s main idea is to apply NL-mean to both left and right images and then use the estimated depth to average the two denoised images. Note that, when applying NL-mean, their method matches patches in each image independently; such an approach is fragile in the presence of large image noise. Indeed, their method has only been evaluated using images with a noise standard deviation up to 20. Our method matches patches simultaneously among all input images using depth as a constraint, which is robust to much more severe noise (standard deviation of 50), as shown in our paper and supplemental material. A comparison between patch matching using a single image versus multiple images is shown in Figure 2. Using multiple input images to improve the accuracy of patch matching is the key idea in multi-baseline stereo [16] for depth estimation. In this paper, we use depth estimation as a constraint to group similar patches in multi-view images for denoising. Patch repetitiveness is also the cornerstone of Epitome analysis [4], which can be used for compression and super-resolution, in addition to denoising. There has been no evaluation between epitome-based denoising and state-of-theart denoising methods. Recently, light field cameras [15] have been proposed to achieve large depth of field and high signal-to-noise ratio, at the expense of reduced image resolution. Such an approach requires modifications to existing camera construction, while our method uses only off-the-shelf cameras.
Our goal is to recover G = {Gm }M m=1 from I. There are five major sources of image noise [9]: fixed pattern noise, dark current noise, shot noise, amplifier noise, and quantization noise. Since fixed pattern noise and dark current noise can be precalibrated and quantization noise is usually much smaller than other noise, we focus on amplifier noise and shot noise and model the noise variance as σ 2 = τ 2 + κG,
(2)
2
where τ represents the amplifier noise whose variance is independent of intensity and κG represents the shot noise whose variance is proportional to intensity G. We verified this noise variance model on two camera models, Nikon D50 and PointGrey Dragonfly Express,1 shown in Figure 1. To jointly reduce noise in all input images, we seek to exploit patch correspondences across different viewpoints using depth estimation. Let Zm be the depth map for image Im , which determines the pixel correspondence between Im and all other images in I. Let Z = {Zm }M m=1 be the set of depth maps for all the input images, which is unknown and needs to be estimated from I. It is well understood in stereo vision that depth estimation is often ambiguous in practice [12] and the true depth map is challenging to compute. With this fact in mind, we formulate the multi-view denoising problem by taking into account a family of likely depth solutions. Specifically, we consider the conditional probability of noiseless images G given noisy input images I, marginalizing over all possible depth hypothesis: Z Z P(G|I) = P(G, Z|I) = P(G|Z, I)P(Z|I). (3) Z
Z
To estimate G, we have two choices: Maximum Likelihood (ML) solution Gˆ = argG max P(G|I) and conditional mean solution Gˆ = EP(G|I) (G|I). For either choice, an analytical solution is hard to find. We note however that the last term in Eq. (3), P(Z|I), is the probability of depth maps Z given input images I and many formulations have been proposed for it in stereo matching literature [18]. We can sample depth maps based on P(Z|I) and then approximate P(G|I) using the sampled depth maps. For example, given a sample of depth maps, Zi , we can use it to jointly denoise all the input images, therefore, generating a sample of noiseless images Gi . After a sequence of depth samples, we can compute a weighted average of all Gi as the approximate conditional mean solution. 1 The noise model in Eq. (2) assumes linear camera response; the two cameras we used have near-linear response and do not require pre-linearization.
Gˆ =
Z GP(G, Z|I) ≈ G,Z
X
Gi P(Gi |Zi , I)P(Zi |I).
(4)
Gi ,Zi
A special case of Eq. (4) is to take only a single sample for Z, e.g., the ML solution of P(Z|I), and then use it to denoise the input images. We report our results using both ML depth estimation and random depth sampling. Computing depth maps from a set of input images is not a contribution of this paper; we use the simple window matching to compute or sample depth maps [16]. Next, we present our multi-view denoising method using the depth maps.
4. Depth-Guided Multi-View Image Denoising In this section, we present a novel method for denoising multi-view images given depth map estimation. Leveraging multi-view data, our method addresses two key challenges in single image denoising. First, multi-view images provide more measurements for noise cancelation, thereby enabling denoising patches that are non-repetitive within a single image. Second, we use depth-induced constraints among different views during patch matching, thereby improving the patch grouping accuracy in the presence of large noise.
4.1. Joint Multi-View Patch Matching Given multiple images, we choose one of them as a reference image, I1 for example.2 Consider one image patch bp (say 8x8) centered at pixel p in the reference image. We call this patch a reference patch. To denoise this reference patch, we search for patches that are similar to bp in all the input images, including the reference image itself. One way to achieve this goal is to compare the reference patch to all other patches, using a distance metric such as L2 norm. Such an approach however is susceptible to large image noise, as shown in Figure 2(a,b). The inaccuracy in patch grouping lowers the performance of image denoising. In practice, perfect patch matching is unobtainable as the noiseless image is unknown. However, we can improve the accuracy of patch matching using multi-view images as follows. When deciding whether a patch A1 is similar to a patch B1 in the reference image I1 , we find their corresponding patches A2 and B2 , respectively, in the second image I2 using the depth map. If A1 is similar to B1 , A2 should also be similar to B2 . Additionally, if we have more views, we have more measurements to verify whether A1 and B1 in the reference view are indeed similar. Specifically, we compute the similarity measure between patches bp and bq at locations p and q in the reference view as follows. We sum up the distances between patch pairs in all views that correspond to bp and bq : M X Φ(bp , bq ) = kbWm (p) − bWm (q) k2 , (5) m=1 2 We
use the notion of reference image to facilitate algorithm description. Our method is able to symmetrically denoise all input images.
(a)
(b)
(c)
Figure 2. Comparison between patch grouping using a single image versus multiple images. (a) The green patches are the closest K = 35 patches to the reference patch (shown in red) in a clean image. (b) After the image is corrupted by noise with standard deviation τ = 65, for the same reference patch, the closest K = 35 patches are scattered around, and do not correspond to the closest patches that would be found in the clean image. (c) Using 25 noisy images taken from multiple viewpoints (only one shown here), the K = 35 closest patches to the same reference patch better resemble those in (a). In short, depth-guided multi-view patch matching improves patch grouping accuracy in the presence of large noise. The patches are best viewed electronically in color.
where Wm (p) is the warped location of pixel p from the reference image I1 to image Im using its depth, and bWm (p) is the patch centered at Wm (p) in image Im . Under this notation, W1 (·) is the identity warp for the reference image I1 itself. Using Φ(bp , bq ) in Eq. (5) as a metric, we can select K most similar patch locations for each patch in the reference image. After warping these K locations to all other M − 1 views, we collect a group of KM similar patches for noise reduction. Figure 2(c) shows an example of this method.
4.2. Joint Multi-View Patch Denoising Given the KM patches {bq }KM q=1 with similar underlying image structures, we now seek to remove their noise. Let the size of each patch be S × S = D; We treat each patch bq as a D-dimensional vector.3 We explore two methods for denoising: PCA and tensor analysis. 4.2.1 Patch Denoising using PCA Since all the patches in the set have similar underlying image structures, we assume that their noiseless patches lie in a low dimensional subspace, centered at u0 and spanned by bases ˆ {ud }C d=1 . Let bq be the noiseless patch for patch bq : C X ˆ bq = u0 + ud fq,d , (6) d=1
ˆ q along basis ud . where fq,d is the coefficient of patch b We estimate the subspace by minimizing the difference between noisy patches and denoised patches: KM X
ˆ q k2 , kbq − b σ
(7)
q=1
where kxk2σ =
D P i=1
x2i σi2
is an element-wise variance-normalized
L2 norm that accounts for the intensity-dependent noise. We 3 For
color images, we treat each patch as a 3D-dimensional vector.
0.8 0.6 0.4 0.2 0
5 10 15 20 25 30
Eigenvalue
1.0
Eigenvalue
Eigenvalue
1.0
0.8 0.6 0.4 0.2 0
1.0 0.8
d=C+1
0.6 0.4 0.2 0
5 10 15 20 25 30
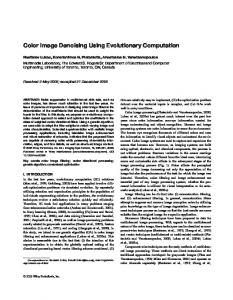
ing image structure. Our basic idea is that if we choose the right dimension for the subspace, the average squared residuals between noisy patches and denoised patches should be very close to the the noise variance. Recall that we have KM patches, each having D pixels, and the average residual errors (scaled by variance) is KM D X X 1 1 ˆ q k2 = kbq − b λ2d , (8) σ KM D q=1 KM D
5 10 15 20 25 30
(a) (c) (e) Figure 3. Illustration of eigenvalues for different collections of patches. (a) we show a reference patch in red and its 35 most similar patches in green. The eigenvalues for this set of patches is shown in the inset. Since this collection of patches is on the bust, the residual patches after mean removal approximately correspond to noise. The eigenvalues therefore correspond to noise power along the components. (b) The reference patch contains an intensity edge. The top component captures the subtle variation of these edge patches. The rest of the small eigenvalues correspond to noise power along these components. (c) The reference patch has an irregular intensity pattern and more components are needed to capture patch variation within the collection. We propose an automatic way of determining the number eigenvectors for patch denoising (Section 4.2.1). The patches are best viewed electronically in color.
approximate σi2 as σi2 = τ 2 + κ[u0 ]i , where [u0 ]i is the intensity for pixel i in the patch u0 . In Eq. (7), if all σi are the same, the subspace can be directly computed using SVD.In the presence of varying σi , we KM P 1 first compute the mean patch u0 = KM bq and subtract it q=1
from the input patches to obtain b0q = bq − u0 . Afterward, for each b0q , we multiply its i’th element by σ1i . Then we apply SVD on the matrix B0 = [b01 , b02 , · · · , b0KM ] to com0 pute C bases {u0d }C d=1 . Note that these bases are for {bq } but not for {bq }. Finally, we obtain the subspace bases {ud }C d=1 by multiplying each u0d with [σ1 , σ2 , · · · , σD ] element-wise. ˆ q is Once we have the subspace bases, the denoised patch b computed using Eq. (6). We remark that our minimization of Eq. (7) is provably optimal if we approximately evaluate perpixel noise variance using the mean image patch. Without this approximation, the optimization is nonlinear and needs an iterative solution. Finding Dimensionality C In practice, we need to determine the subspace dimension C. One choice is to use a fixed value, e.g., C = 1. However, different groups of patches require different numbers of principal components for best reconstruction, as shown in Figure 3. In general, too many components tend to introduce noise in the results and too few components tend to over-smooth the results. We propose a new way of choosing the dimension of the subspace for each patch stack that is adaptive to the underly-
0 where {λd }D d=1 are the singular values of the matrix B . We therefore look for C such that Eq. (8) is closest to 1. Since Eq. (8) monotonically increases as C decreases from D to 1, a binary search can be used to quickly find an optimal C.
4.2.2 Patch Denoising using Tensor Analysis Inspired by its successful application in modeling textures [21], we have also explored using tensor analysis for patch denoising. Specifically, rather than stacking patches from different images in a single matrix, we put patches from the same image in a stack, and view the patches from multiple images as a multi-dimensional array. Let this array be B and [B]i,k,m be the intensity of pixel i in the patch k in the view m. Since all the patches are similar, we assume that the underlying noiseless patch array Bˆ lie in a multi-linear subspace centered J L at u0 and spanned by bases {ui }C i=1 ⊗ {vk }k=1 ⊗ {wm }m=1 , where ui , vk , and wm are the basis vectors for the three modes: i, k, and m, which is written as J X L C X X fi,k,m ui ⊗ vk ⊗ wm , (9) Bˆ = u0 ⊕1 i=1 k=1 m=1
where u0 ⊕1 X means “adding u0 to each mode-1 vector of the tensor X ”, and fi,k,m is the tensor coefficient. Similar to the PCA denoising, we estimate this multi-linear subspace by minimizing the difference between noisy patches and denoised patches as in Eq. (7), with the exception that ˆ q is computed using Eq. (9), rather than Eq. (6). We follow b the same procedure as PCA denoising to estimate the multilinear subspace, except that we replace matrix SVD with tensor SVD [13]. We also apply the same method of choosing subspace dimension in PCA denoising to each mode of the tensor SVD separately to determine C, J, and L. We compare PCA and tensor denoising in Section 5.
4.3. From Denoised Patches to Denoised Images By applying the patch grouping and patch denoising to each patch in input images, we can denoise all of them; We now use the denoised patches to form denoised images. Each pixel is often covered by several denoised patches. To determine the value of a particular pixel in a denoised image, we take a weighted average of denoised patches at this pixel. The weight reflects our belief in the likelihood that the denoised patch resembles the true underlying noiseless image. Since the denoised patch is computed from the PCA or tensor analysis, a lower dimension of the subspace suggests less image structure variation in the patch collection and the noise has a better
chance to be canceled out. Therefore, we have experimented 1 with using C1 as patch weight for the PCA denoising and CJL for tensor denoising. We have also experimented with other ˆ 2 ) which favors deweighting choices, such as exp(−kb − bk noised patches that are closer to the original patches. We found these different choices have comparable performance. It is worth noting that the depth estimation we use does not model occlusion explicitly. As a result, for a reference patch near an occlusion boundary, its patch collection may include patches from other views that have considerably different intensity pattern. Using a weighting scheme that favors more compact patch collections helps to reduce artifacts near occlusion boundaries.
5. Experimental Results We have implemented our method in C++ and evaluated it on different images. We present only a subset of our results in the paper. Please refer to our supplemental materials for additional results. By default, we use M = 25 views, set patch size to be D = 8 × 8 pixels, and choose a reference patch for every 4 pixels. For each reference patch, we choose K = 28 most similar patch locations.
5.1. Input Image Data Our experiments include images with synthetic noise as well as real noise. To create an noisy image I from a clean image G, we use I = κpoissrnd( G κ ) in Matlab, where κ is a scalar parameter. poissrnd(x) generates a Poisson random number with mean x and variance x. This operation simulates the process that incoming light is darkened by a factor of κ1 , recorded by a photoreceptor, and then amplified by a factor of κ. At the end, I has mean G and variance κG. We generated synthetic noisy images using two image sets: Ohta and Tarot Card. Ohta images are from the Middlebury Stereo website,4 and were taken from a grid of 5x5 viewpoints. For each image, we added Poisson noise with κ = 38. Tarot Card images are from Stanford Light Field Archive.5 The original data set has 17x17 images, and we used a subset of 5x5 and added noise with κ = 18. We also captured a sequence of 25 noisy images for a board with texts and line arts using PointGrey Dragonfly Express at the highest gain. The camera moves about 5mm between neighboring images and the scene is approximately 1.5 meters away from the camera. We use Voodoo software6 to calibrate the 3D camera path. Please refer to our supplemental materials for these testing images in full size as well as additional ones. We only show insets in the paper due to the lack of space.
5.2. Comparison to Other Denoising Approaches We first applied our denoising method to the Ohta images and the Tarot Card images. Figure 4 shows our results, compared with the results generated by BM3D, one of the state-of4 http://vision.middlebury.edu/stereo/data/ 5 http://lightfield.stanford.edu/ 6 http://www.digilab.uni-hannover.de/index.html
Error rate(6.5%)
Error rate(2.4%)
Ground truth
Figure 6. An application of our multi-view denoising algorithm for depth estimation. Left: the depth map estimated from the 25 noisy Ohta images. Middle: the depth map estimated from the 25 denoised images produced by our denoising algorithm. In both cases, the depth maps are estimated using graph cuts [11]. Right: the ground truth depth map. The error rate is defined as the percentage of the pixels with over one disparity difference compared to the ground truth. The benefit of using our algorithm for depth estimation is clear.
the-art single image denoising methods [6], and a multi-view image reconstruction method [20]. Our method substantially outperforms the other two methods both visually and quantitatively. (PNSR measurements are given in our supplemental material due to the lack of space.) Note that the improvement of our approach over single image denoising is substantial, much more dramatic than the performance difference between various state-of-the-art denoising methods evaluated on a single image. We attribute this performance gain to more accurate patch grouping and more data for noise cancelation. We believe our work can inspire the image denoising community to design algorithms that can be conveniently extended to leverage multi-view images for significant performance gain. We also applied our method to the text board images. Figure 5 shows our results, compared with the results by BM3D, and its video denoising extension, VBM3D [5]. Our method has an clear advantage over these two. This comparison suggests that if patches cannot be accurately grouped over time, additional image measurements may not contribute significantly to the denoising performance. As an application of our denoising algorithm, we have tested depth estimation on both noisy and denoised images and report the results in Figure 6. The benefit of using denoised images for depth estimation is clear.
5.3. Intensity-Dependent Variance We have evaluated the effectiveness of modeling intensitydependence variance for images with Poisson noise. Using intensity-dependence variance reduces noise in all regions without losing details in dark regions, as shown in Figure 7.
5.4. PCA versus Tensor Analysis We have compared denoising results using PCA versus Tensor analysis. Both have comparable performance, as shown in Figure 8. Tensor denoising yields smoother results because it tends to treat appearance variation across viewpoints due to occlusion or reflectivity as noise, while PCA is more flexible to preserve these variations.
5.5. How Many Views Are Enough? Figure 9 illustrates the performance of our approach as a function of the number of input views. The performance is
Noisy patch
Dabov et al. [6]
Vaish et al. [20]
Our method (PCA)
Ground truth
Figure 4. Comparison between our 25-view denoising and a state-of-the-art single image denoising (Dabov et al. [6] applied on one image) and an existing multi-view denoising (Vaish et al. [20] applied on all 25 images). (Best viewed electronically in color.)
measured in terms of peak signal-to-noise ratio (PSNR). It steadily improves as the number of views increases till 15-20, after which it flattens. The cause for this phenomena remains an open question for future study.
5.6. Optimizing versus Sampling Depth Maps All our results presented so far use only a single depth map, which is computed with a window-based winner-take-all approach [16]. We have also experimented with using randomly sampled depth maps for denoising. When sampling for a depth map, we assume that depth for each pixel is independent and use the window-based stereo matching cost to compute depth distribution. Specifically, the probability that pixel p has depth M z is X P(z) ∝ exp(− kbp − bWm (p) k2σ ) (10) m=2
where Wm (p) is the warped location of pixel p from image 1 to image m using depth z, and bWm (p) is the patch centered at
Wm (p) in image m. Figure 10 shows denoising results using a sampled depth map. These results are very comparable to our results in Figure 8, which use window-based winner-take-all depth estimation. The similarity between Figure 10 and 8 is because depth distribution P(z) is highly peaked for patches that have a unique intensity pattern and is more spread out for ambiguous patches. Taking a solid white image region as an extreme example, depth sampling has large uncertainty, but any depth value works equally well for grouping patches in this region for denoising. We have also tried averaging denoising results using multiple sampled depth maps, and found that the results do not differ much from those obtained using a single depth map. This experiment suggests that imperfect depth estimation can be good enough for multi-view image denoising. How to rigourously aggregate different denoising results using sam-
Noisy patch
Dabov et al. [6]
Dabov et al. [5]
Our method (Tensor)
Ground truth
Figure 5. Comparison between our 25-view denoising and a state-of-the-art single image denoising (Dabov et al. [6] applied on one image) and its extension to video denoising (Dabov et al. [5] applied on all 25 images as a video sequence). (Best viewed electronically.)
Noisy patch
σ ≡ 50
σ ≡ 98
σ 2 = 38G
Ground truth
Noisy patch
σ ≡ 50
σ ≡ 68
σ 2 = 18G
Ground truth
Figure 7. Comparison of multi-view denoising for images with Poisson noise using a fixed variance versus an intensity-dependent variance. Using a small and fixed noise variance keeps image details but is unable to reduces large noise over bright regions. Using a large and fixed noise variance reduces noise in all regions but over-smoothes the details in the dark regions. Using intensity-dependent variance reduces noise in all regions without losing details in dark regions. (Best viewed electronically in color.)
pled depth maps remains a theoretic question for future study.
6. Discussion and Future Work In this paper, we cast multi-view pinhole imaging as a multi-view denoising problem and seek to restore all the pinhole images by jointly removing noise in different viewpoints. We believe our work opens several interesting venues for future work. First, our current method does not model occlusion between different views. This has not generated very objectionable artifacts in the results, due to the weighting scheme in Section 4.3. However, in the Ohta example, we do see a small
amount of color bleeding of the red lamp arm into the background poster board. We believe that adopting robust PCA or tensor analysis to patch denoising will address this issue. Second, our current implementation does not consider patch deformation when matching patches across views. An affine transformation model with subpixel matching will improve the performance of our algorithm. Third, it is intriguing to note that our performance curve flattens after 15-20 views. We would like to design algorithms that always benefit from more input views. Last, we are interested in more principled ways
References
Our method (PCA) Our method (Tensor)
Ground truth
Figure 8. Comparison between patch denoising using PCA versus tensor analysis. Both have comparable performance. Ohta
Cards
32
Board 34
PSNR (db)
28 30 26 28
32
24 26 0
10
20
22
0 10 20 Number of Input Views
30
0
10
20
Figure 9. The performance of our multi-view denoising as a function of the number of input views. The performance improves as the number of views increases till 20, after which it flattens.
Figure 10. Our multi-view image denoising using depth maps randomly sampled from the depth distribution of Eq. (10). These results are very comparable to those in the left column of Figure 8. This experiment suggests that imperfect depth maps due to matching ambiguity can be used to generate good denoising results.
of using depth map sampling for multi-view denoising, for example, using MRF to define global depth map probability, and aggregating multiple denoising results more rigorously.
Acknowledgement The authors are thankful for the discussion with Siwei Lyu. This work is supported in part by Adobe Systems Inc.
[1] E. P. Bennett and L. McMillan. Video enhancement using perpixel virtual exposures. In SIGGRAPH, 2005. [2] A. Buades, B. Coll, and J. M. Morel. A review of image denoising algorithms, with a new one. Simulation, 4, 2005. [3] J. Chen and C.-K. Tang. Spatio-temporal markov random field for video denoising. In CVPR, 2007. [4] V. Cheung, B. J. Frey, and N. Jojic. Video epitomes. IJCV, 76(2), 2008. [5] K. Dabov, A. Foi, and K. Egiazarian. Video denoising by sparse 3d transform-domain collaborative filtering. In Proc. 15th European Signal Processing Conference, 2007. [6] K. Dabov, R. Foi, V. Katkovnik, K. Egiazarian, and S. Member. Image denoising by sparse 3d transform-domain collaborative filtering. TIP, 16:2007, 2007. [7] M. Elad and M. Aharon. Image denoising via learned dictionaries and sparse representation. In CVPR, 2006. [8] A. Foi, V. Katkovnik, and K. Egiazarian. Pointwise shapeadaptive dct for high-quality denoising and deblocking of grayscale and color images. TIP, 16(5):1395–1411, 2007. [9] G. Healey and R. Kondepudy. Radiometric ccd camera calibration and noise estimation. TPAMI, 16(3):267–276, 1994. [10] Y. S. Heo, K. M. Lee, and S. U. Lee. Simultaneous depth reconstruction and restoration of noisy stereo images using non-local pixel distribution. In CVPR, pages 1–8, 2007. [11] V. Kolmogorov and R. Zabih. Multi-camera scene reconstruction via graph cuts. In ECCV, 2002. [12] K. N. Kutulakos and S. M. Seitz. A theory of shape by space carving. IJCV, 38(3):199–218, 2000. [13] L. D. Lathauwer, B. D. Moor, and J. Vandewalle. On the best rank-1 and rank-(r1;r2; : : : ;rn) approximation of higher-order tensors. SIAM J. Matrix Analysis and Applications, 21(4):1324– 1342, 2000. [14] S. Lyu and E. P. Simoncelli. Statistical modeling of images with fields of gaussian scale mixtures. In NIPS, 2006. [15] R. Ng. Fourier slice photography. ACM Trans. Graph., 24(3), 2005. [16] M. Okutomi and T. Kanade. A multiple-baseline stereo. TPAMI, 15(4):353–363, 1993. [17] S. Roth and M. J. Black. Fields of experts: A framework for learning image priors. In CVPR, pages 860–867, 2005. [18] D. Scharstein and R. Szeliski. A taxonomy and evaluation of dense two-frame stereo correspondence algorithms. IJCV, 47(13), 2002. [19] M. F. Tappen, C. Liu, E. H. Adelson, and W. T. Freeman. Learning gaussian conditional random fields for low-level vision. In CVPR, pages 1–8, 2007. [20] V. Vaish, M. Levoy, R. Szeliski, C. L. Zitnick, and S. B. Kang. Reconstructing occluded surfaces using synthetic apertures: Stereo, focus and robust measures. In CVPR, pages 2331– 2338, 2006. [21] M. A. O. Vasilescu and D. Terzopoulos. Tensortextures: multilinear image-based rendering. ACM Trans. Graph., 23(3), 2004.