Variable Reduction for Multi-Objective Optimization Using Data Mining Techniques; Application to Aerospace Structures
Mahdi Esmaeili,
Amirhosein Mosavi
Department of Computer Science Islamic Azad University (Kashan branch) Kashan, Iran
[email protected]
Faculty of Informatics University of Debrecen Debrecen, Hungary
[email protected]
Abstract — Aerospace engineering optimization process in real multidisciplinary design problems is done by multi-objective optimization tools. Multi-objective optimization tools in aerospace structures have to face the huge number variables and objectives. High number of variables cases high computation cost to optimization process. In this regard a variable reduction tool which could remove the less effective variables and priority arrange them appear to be vital. In this paper some data mining tools are applied for reason of variable reduction.
Meanwhile identification of the optimum design of an industrial problem is often not possible because of the size of the problem and lack of knowledge about variables. In this situation, design optimization is essentially seen as design improvement in order to identify and classify the effective variables.
Keywords-Multi-objective shape optimization, data mining, variables reduction
I. INTRODUCTION The applications in aerospace engineering have different disciplines into consideration. In aerospace engineering, the structural simulation is tightly integrated more than one discipline. Meanwhile, the trend nowadays is to utilize independent computational codes for each discipline [1][2]. In this situation, the aim of multi-objective optimization is to develop methods in order to guarantee that all physical variables be involved. In order to approach the optimal shapes in aerospace engineering optimization problems, the multi-objective optimization techniques are necessary to deal with all objectives efficiently [3]. In a real engineering optimization problem there are a lot of variables and objectives involved which couldn’t be ignored. In this situation just a multi-objective optimization technique could deal with this condition. Recently some new techniques of the multi-objective optimization algorithm have been introduced which are more robust and effective. The project of YIN Bo et al [4] of aerodynamic optimization of a 3D wing is one of them. In this optimization the challenge is to identify as many optimal designs as possible to provide a choice of better solution. The task is very complicated with an increase in the number of design variables. The optimization identifies several solutions that are good considering the objective functions, they are called Pareto solutions. The multiobjective optimization becomes more difficult with increasing number of variable.
II.
MULTI-OBJECTIVE OPTIMIZATION
The three below sections review the tools of multi-objective optimization and the condition of variables in each of them. A. General workflow of the multi-objective optimization Initializing is done by giving some values and limitations to the input variables, output variables and objectives. For the reason of simulation, there are software packages such as Computer Aided Design (CAD) and Computer Aided Engineering (CAE) which are integrated in the workflow. Performing the Finite Element Analysis (FEA) and Computational Fluid Dynamic (CFD) each of them takes hours. Limited number of simulations could be run in the limited time. In order to find the optimal design in shorter time there is need to run minimum number of simulations. One way is to apply some methods of optimization package's tools such as Design of Experiment (DOE) for getting maximum information from minimum number of simulations. Fig.1 shows the general workflow of multiobjective optimization.
Variables Identificaion
Simulations
Optimal achieved ?
New variables configuration
Optimal geometry
Figure1. General workflow of multi-objective optimization
In this workflow the variables in first step are identified and initialized. Then it goes directly the next process of simulation. Therefore, there is not any control and
monitoring on the input variable. Compressor blade optimization is an example [5] for this workflow. B. Design of experiment-based design optimisation DOE is one tool for multi-objective optimization. It explores the design space and automatically chooses the minimum set of designs which contains the maximum amount of information. Each single CAE simulation takes hours or even days. Finding the optimal configuration of the products could be shortened if some virtual time-consuming simulation is applied. Some simulations are as expensive as it is not possible to run those for more than a limited number of calculations. DOE can deliver enough initial calculations which allow the optimization algorithm learns the behavior of design parameters in order to take the best decision. DOE starts from values of variables. Variables variation and properties identify the governing parameters. Varying the governing parameters from their initial values to the maximum possible limitation gives the different designs with a variety of characteristics. Furthermore, through the large number of experiences gained the several simulations run by the optimizer generate virtual database of shape configurations, allowing the designer to find laws, functions and correlations between input parameters and output performance, with a further and deeper insight into the specific optimization problem. In this situation minimizing the number of variables could help the process. C. Genetic algorithms(GA) for design optimisation Genetic algorithm (GA), Ant colony optimization (ACO) and Particle swarm optimization (PSO) are of great importance in the developing of modern optimization technique. The GA works with a random population of the variables. The variables are evaluated using an objective or fitness function. The variables are manipulated by GA functions such as crossover and mutation. GA is more popular for multi-objective design optimization than classical optimization algorithms. GA is mostly utilized for design variable optimization of shape optimization [8]. In most of GA applications in multi-objective problems there are more than 20 design variables but when it comes to constraints, it is observed that the number of constraints is typically less than 5. Most of the applications involve mixed type variables. GA in shape optimization is characterized by a larger number of variables and expensive evaluation. It is observed that shape optimization with a larger number of design variables requires numerical simulation to evaluate the designs, thus making it often computationally expensive. Therefore as a result of this section minimum number of variables in GA based optimization process makes it less complicated.
I.
VARIABLES REDUCTION METHODS IN MULTI-OBJECTIVE OPTIMIZATION
In this issue, there hasn’t been much work yet. But the ideal workflow of multi-objective optimization is presented in Fig.2 which has a step more for variable reduction.
Variables Reduction
Simulations
Optimal achieved?
Y
Variables Identification
New variables configuration
Optimal geometry
Figure 2. General workflow of multi-objective optimization including variable reduction step
Feature subset selection is an important problem in knowledge discovery, not only for the insight gained from determining relevant modeling variables, but also for the improved understandability, scalability, and, possibly, accuracy of the resulting models. The role of feature selection in machine learning is (a) to reduce the dimensionality of the feature space, (b) to speed up a learning algorithm, (c) to improve the predictive accuracy of a classification algorithm, and (d) to improve the comprehensibility of the learning results. II.
STATE OF THE PROBLEM
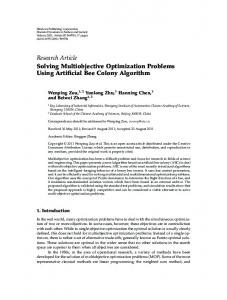
The airfoil of Fig.3 part a) is subjected for shape optimization process. The shape needs to be optimized in order to deliver minimum displacement distribution in terms of applied pressure on the surface. Fig.3 part b) shows the basic curves of the surface modeled by s-plines. For modeling the surface four profiles have been utilized with 42 points. The coordinates of all points are supplied by a digitizer, each point includes 3 dimensions of X, Y, and Z. consequently there are 126 columns plus 3 objectives. Purpose of the optimization is to satisfy the three identified objectives. Objectives are listed as follow: Objective1: Minimizing the displacements distribution in the airfoil in constant pressure value of Objective2: Minimizing the displacements distribution in the airfoil in constant pressure value of 2 Objective3: Minimizing the displacements distribution in the airfoil in constant pressure value of 4 An optimal configuration of 42 variables could satisfy 3 described objectives.
better with lower-dimensional data with the removal of irrelevant or redundant attributes compared to higherdimensional data. Irrelevant or redundant attributes as useless information often interfere with useful ones [8, 11]. The problem of data reduction is to select a subset of attributes which represents the concept of data without losing important information. a)
IV.
METHODOLOGY AND EXPERIMENTAL RESULTS
The workflow of methodology is described in Fig.4 In this work, classification method is utilized to create several classifiers (decision trees). In the next step the best variables are selected. Finally, the output of the process could be produced by selected variables. b) Figure 3. Airfoil geometry modeled by S-plines.
III.
APPLICATION OF DATE MINING IN VARIABLE REDUCTION
Evolutionary computation can be applied to obtain a number of Pareto solutions for multi-objective optimization. However, it is difficult to analyze many solutions one by one. Data mining techniques applicable to engineering data are needed to analyze the Pareto front and contributions of design variables. The dataset will likely be huge and complex data analysis and mining on huge amounts of data can take a long time, making such analysis impractical or infeasible. Large-scale data can only be handled with the aids of computers. However, processing commands may need to be entered manually by data analysts and data mining results can be fully used by decision makers only when the results can be understood explicitly. The removal of irrelevant or redundant attributes could benefit us in making decisions and analyzing data efficiently. Data reduction techniques can be applied to obtain a reduced representation of the dataset that is much smaller in volume yet closely maintains the integrity of the original data. That is, mining on the reduced dataset should be more efficient yet produce the same (or almost the same) analytical results [11]. The field of knowledge discovery in databases, or Data Mining (DM), has evolved in the recent past to address the problem of automatic analysis and interpretation of larger and larger amounts of data. Data miners are expected to present discovered knowledge in an easily understandable way. Data reduction is an essential part in the data mining processes. Data reduction is developed to fulfill objectives such as improving accuracy of prediction models, scaling the data mining models, reducing computational cost, and providing a better understanding of knowledge extracted. Data reduction plays an important role in data mining tasks since those semi-automated or automated methods perform
Figure 4. proposed methodology workflow
Regression and model trees are constructed by first using a decision tree induction algorithm to build an initial tree. However, whereas most decision tree algorithms choose the splitting attribute to maximize the information gain, it is appropriate for numeric prediction to instead minimize the intra subset variation in the class values down each branch. The splitting criterion is used to determine which variable is the best to split that portion T of the training data. It is based on treating the standard deviation of the objective values in T as a measure of the error and calculating the expected reduction in error as a result of testing each variable. The variable that maximizes the expected error reduction is chosen for splitting. The splitting process terminates when the objective values of the instances vary very slightly, that is, when their standard deviation is only a small fraction (say, less than 5%) of the standard deviation of the original instance set. Splitting also terminates when just a few instances remain. Experiments show that the results obtained are not very sensitive to the exact choice of these thresholds. Weka package provides implementations of learning algorithms and dataset could be preprocessed, feed it into a learning scheme, and analyze the resulting classifier and its performance. The workbench includes methods for all the standard data mining problems: regression, classification, clustering, association rule mining, and attribute selection. Weka also includes many data visualization facilities and data preprocessing tools. Three different algorithms are applied (J48, BFTree, LADTree) and compare their performance in order to choose attribute importance, on the other words, for selecting relevant variables in the data. The Mean Absolute Error (MAE) and Root Mean Squared Error (RMSE) of the class probability estimated and assigned by the algorithm output. The root mean squared error is the
square root of the average quadratic loss and the mean absolute error is calculated in a similar way using the absolute instead of the squared difference. TABLE I.
VARIABLES IMPORTANCE RANKING FOR THREE CLASSIFICATION METHODS
Classification method
BFTree
J48
LADTree
MAE
0.370 0.412 0.418 0.309 0.482 0.378 0.277 0.604 0.365
RMSE
0.517 0.519 0.555 0.514 0.642 0.590 0.500 0.769 0.584
Variables importance
Objective
15 23 41 15,24 13 35,41 15,24,2,32,41,39,3 23,22,18,15,42,2,17,20 41,35,9,17,11,38,37,16
O1 O2 O3 O1 O2 O3 O1 O2 O3
The comparison between importance ranking results obtained by our experiments in Table 1 we can conclude, in the worst case, we have more than 55% reduced variables. As one can see, BFTree and J48 algorithms classify dataset with less number of variables. While in LADTree algorithms, at least 7 variables utilize to classify dataset. Variables 15 and 24 play an important role to change first objective (O1) and variables 41 and 35 affect on third objective (O3) as well. According to the experimental results, we can optimize model by changing 45% variables. In Tables I two types of classification error (MAE, RMSE) are shown for all algorithms corresponding to different class of objective. In this paper, data reduction is also carried out in order to reducing computational cost and to reduce the number of attributes as well as scaling the models. V. CONCLUSION AND FUTURE WORK In order to manage the number of optimization variables and reduce them in a reasonable way, data mining tools have been applied. Variables were reduced and organized utilizing three different classification algorithms. The
presented results as reduced variables could speed up and scale up the process of optimization as a preprocessing step. Data mining tools has found to be effective in this regards. For future works studying the effectiveness introduced data reduction process is suggested. Also trying other tools of the data mining such as clustering, association rules, and comparison the results could be beneficial. REFERENCES [1]
A. Albers and N. Leon-Rovira, "Development of an engine crankshaft in a framework of computer-aided innovation", Computers in Industry , vol.60, pp. 604–612, 2009 [2] Rajan Filomeno Coelho, Piotr Breitkopf, Catherine Knopf-Lenoir, Pierre Villon, "Bi-level model reduction for coupled problems", Struct Multidisc Optim, vol.43, pp. 401–418, 2009 [3] Rajan Filomeno Coelho, Piotr Breitkopf, Catherine Knopf-Lenoir, "Model reduction for multidisciplinary optimization - application to a 2D wing", Struct Multidisc Optim, Vol.152, pp. 29–48, 2008 [4] YIN Bo, XUDian, ANY, "Aerodynamic optimization of 3D wing based on iSIGHT", Appl. Math. Mech. -Engl. Ed, vol.38, pp. 603– 610, 2008 [5] Xinwei SHU, Chuangang GU, Jun XIAO, Chuang GAO, "Centrifugal compressor blade optimization based on uniform design and genetic algorithms", Front Energy Power Eng China Vol.47, pp. 453–456, 2008 [6] Gaia Franceschini, Sandro Macchietto, "Model-based design of experiments for parameter precision: State of the art", Chemical Engineering Science, vol. 85, pp. 4846 – 4872, 2008 [7] Janushevskis, A.Auzins, J.Janushevskis, Viba, "optimization of subsonic aerodynamic shape", Proc. Industrial Engineering Conference, Tallinn , pp. 57-6, April 2006 [8] Rajkumar Roy, Srichand Hinduja, Roberto Teti, "Recent advances in engineering design optimisation: Challenges and future trends", CIRP Annals - Manufacturing Technology, pp. 697–715, 2008 [9] Arularasan & Velraj, "modeling and simulation of a parallel plate heat sink using computational fluid dynamics", springer, Int J Adv Manuf Technol, pp.172-183, 2008 [10] Brian H. Dennis, Igor N. Egorov, George S. Dulikravich, Shinobu Yoshimura, "optimization of a large number of coolant passage", Proc. Turbo Expo 2003 ASME Turbo Expo Atlanta, Georgia Conference, , pp. 312-330, June 2003 [11] M.Esmaeili, F.Gabor, "Feature selection as an improving step for decision tree construction", Proc. of international conf. on machine learnining and computing, , pp. 35-39, July 2009
TABLE II . TRAINING DATASET INCLUDING NINE SAMPLES
Variables Configuration : V1V42
No.1
No.2
No.3
No.4
No.5
No.6
No.7
No.8
No.9
0,1,1.2,1,0.8,0.4,0.2,0,-0.4,0.48, 0.6,-0.8,-0.72, 0,0.84,0.99,0.84,0.62,0.26,0,0.20,-0.40,-0.36,-0.70,-0.58, 0,0.59,0.78,0.56,0.30,0,-0.21,0.24,-0.38,-0.38 0,0.26,0.50,0.39,-0.03,-0.10,0.12, 0,1.1,1.21,.9,0.82,0.42,0.18,.1, -0.41,-0.46,-0.62,-0.81,-0.70, 0,0.86,0.1,0.82,0.60,0.25,0.01, -0.20,-0.39,-0.39,-0.70,-0.58, 0,0.58,0.76,0.57,0.32,0,-0.21,0.23,-0.37,-0.39 0,0.26,0.54,0.40,-0.03,-0.1,0.1,
0,1,1.2,1,0.8,0.4,0.2,0,-0.4,-0.48,0.6,-0.8,-0.72, 0,.88,0.99,0.84,0.62,0.26,0,-0.23,0.35,-0.37,-0.70,-0.54, 0,0.58,0.76,0.58,0.31,0,-0.23,-0.23,0.37,-0.37 0,0.24,0.50,0.40,-0.03,-0.13,-0.10,
0,1.3,1.23,1.06,0.83,0.41,0.28,0.07,0.41,-0.48,-0.6,-0.8,0.78,0,0.84,.92,0.84,0.62,0.26,0,0.23,-0.39,-0.37,-0.70,0.54,0,0.58,0.76,0.58,0.31,0,-0.24,0.22,-0.36,-0.38, 0,0.24,0.52,0.38,0.02,-0.12,-0.12,
0,1.01,1.21,1,0.8,0.4,0.21,0,-0.41,0.47,-0.59,-0.79,-0.69, 0,0.80,1.01,0.86,0.64,0.26,-0.01,0.20,-0.40,-0.40,-0.72,-0.56, 0,0.58,0.76,0.58,0.31,0,-0.23,-0.23,0.37,-0.37 0,0.24,0.52,0.38,-0.06,-0.10,-0.10,
0,1,1.2,1,0.8,0.4,0.2,0,-0.39,-0.50,0.61,-0.78,-0.70, 0,0.86,1.02,0.84,0.59,0.26,0,-0.21,0.39,-0.39,-0.68,-0.58, 0,0.58,0.76,0.58,0.31,0,-0.23,-0.23,0.37,-0.37 0,0.20,0.52,0.40,-0.02,-0.15,-0.15, 0,1,1.2,1,0.8,0.4,0.2,0,-0.4,-0.48,0.6,-0.8,-0.72, 0,0.84,0.95,0.83,0.63,0.25,0,-0.20,0.35,-0.39,-0.72,-0.56, 0,0.58,0.76,0.58,0.31,0,-0.23,-0.23,0.37,-0.37 0,0.20,0.52,0.38,-0.04,-0.13,-0.13,
0,1,1.2,1,0.8,0.4,0.2,0,-0.4,-0.48,0.6,-0.8,-0.72, 0,0.84,1.03,0.86,0.62,0.27,0,-0.19,0.41,-0.41,-0.66,-0.50, 0,0.58,0.76,0.58,0.31,0,-0.23,-0.23,0.37,-0.37 0,0.24,0.52,0.38,-0.02,-0.08,-0.09, 0,1.1,1.4,1.2,0.9,0.4,0.2,0.01,-0.39,-0.49,0.63,-0.81,-0.68, 0,0.80,0.91,0.84,0.62,0.24,0,-0.25,0.34,-0.39,-0.72,-0.56, 0,0.58,0.76,0.57,0.31,0,-0.23,-0.23,0.37,-0.37 0,0.24,0.52,0.38,-0.18,-0.1,-0.1,
CAD Model
Simulation results/ Displacement Distribution
Objective Results objective1=c objective2=c objective3=c
objective1=b objective2=c objective3=d
objective1=b objective2=c objective3=b
objective1=d objective2=c objective3=b
objective1=c objective2=d objective3=e
objective1= b objective2= c objective3= d
objective1=a objective2=c objective3=d
objective1= b objective2= b objective3= c
objective1= c objective2= b objective3= c