Acta Cybernetica 22 (2015) 35–56.
Variance of Source Code Quality Change Caused by Version Control Operations Csaba Faragó∗
Abstract Software maintenance consumes huge efforts. Its cost strongly depends on the quality of the source code: an easy-to-maintain code needs much less effort than the maintenance of a more problematic one. Based on experiences, the maintainability of the source code tends to decrease during its lifetime. However, in most of the cases, this decrease is not a smooth linear one, but there are larger and smaller ups and downs, and the net root of these changes generally results in a negative tendency. Detecting common development patterns which similarly influence the maintainability could help to stop or even turn back source code erosion. In this research the scale of the ups and downs are investigated, namely that which version control operations cause bigger and which smaller changes in the maintainability. We calculated the maintainability and collected the cardinality of each version control operation for every revision of four inspected software systems. With the help of these data we checked which version control operation causes higher absolute code quality changes and which lower. We found clear connection between version control operations and the variance of the maintainability changes. File Additions and file Deletions caused significantly higher variance in maintainability changes compared to file Updates. Commits containing higher number of operations – regardless of the type of the operation – caused higher variance in maintainability changes than those commits containing lower number of operations. As a practical conclusion, it is recommended to pay special attention to the quality of commits containing new file additions, e.g. with the help of a mandatory code review. Keywords: software maintainability, software erosion, source code version control, variance test, ISO/IEC 9126, case study
1
Introduction
Maintainability is one of the six sub-characteristics of software quality, as defined originally in the ISO/IEC 9126 standard [13]. Software maintenance consumes huge ∗ University of Szeged Department of Software Engineering, Árpád tér 2. Hungary, E-mail:
[email protected]
H-6720 Szeged,
36
Csaba Faragó
efforts – based on the experiences, about half of the total amount of software development costs are spent on this activity. As maintainability has a direct connection with maintenance costs, our motivation is to investigate the effect of development process on maintainability. The goal is to explore typical patterns causing similar changes in software quality, which could either help to avoid software erosion, or provide information about how to better allocate efforts spent on improving software quality. At first we focus on the information we can gain from the version control systems (VCS). The main rationale behind this is that calculating the maintainability is not trivial, furthermore, effort consuming, but obtaining information from VCS is relatively straightforward. By finding connections between these two data, we will be able to conclude on maintainability (hard to obtain) using VCS information (easy to obtain). We already performed some research work in this topic. In an earlier paper [9] we presented that strong connection exists between the version control operations and the maintainability of the source code. A previous study [8] revealed that file additions have rather positive, file updates have rather negative effect on maintainability, while a clear effect of file deletions was not identified. Version Control
Maintainability
operations
average value of maintainability change
file name
author
date
variance of maintainability change
comment
difference
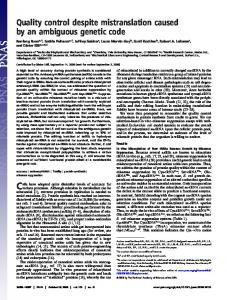
Figure 1: Overview In this paper we examine the variances of the maintainability changes caused by version control operations. Figure 1 provides an overview how this study fits into our longer term research. The solid line illustrates the the current study, and the dotted line the previous ones. We decided to investigate this for several reasons. First of all, if the net effect of one commit set is similar to another one, the difference in amplitudes can be important. The limited amount of efforts allowed
Variance of the Quality Change of the Source Code
37
to spent on source code quality improvements could be better allocated by focusing on those commits which cause higher maintainability change. This is analogous with the greenhouse effect. In the greenhouses the temperature is high because it does not decrease overnight. In software development, the elimination of the drastic maintainability decreases would result in a net maintainability increase. Therefore it is recommended to pay special attention to those commits which are likely to cause higher change of maintainability (high variance), compared to those likely causing lower change (low variance). A simulation of the possible gain of this strategy can be found in section 4.3. Second, discovering other dimensions of the connection between version control operations and quality change could help in fine-tuning the results of our long-term research. We were especially interested in the variance caused by file deletions, as in our earlier studies we found no clear impact of this operation on the maintainability. Lastly, by discovering new connections new questions may raise. These potential new questions lead to new research that might bring us closer and closer to our final goal; to create a formula describing the impact of developer’s interactions on the quality of the source code. Concisely, in this paper we investigate the following research questions: RQ1: What is the impact of operation Add on the variance of maintainability change? We strongly assumed that the presence of this operation increases the variance, meaning that both the maintainability increase and decrease are mostly caused by this operation. RQ2: What is the impact of operation Update on the variance of maintainability change? Our assumption was that the presence of this operation reduces the maintainability deflection. RQ3: What is the impact of operation Delete on the variance of maintainability change? We hoped that we would find a clear connection between operation Delete and the variance of the maintainability change. We assumed that the presence of this operation increases it. The remaining of the paper is organized as follows. Section 2 introduces works that are related to this one. In Section 3 the methodology used to test the variance of maintainability change caused by version control operations is presented. In Section 4 we discuss the results of the performed statistical tests and summarize the findings. Section 5 lists the possible threats to the validity of the results, while in Section 6 we conclude the paper.
2
Related Work
Any connection between the version control operations and software quality – according to our knowledge – has not been studied directly before. However, this study lies between two widely investigated areas, namely software quality and mining software repositories. It is not possible to present all the papers from these areas, therefore we only give an overview of the somehow interesting or important studies that are closely related to ours.
38
2.1
Csaba Faragó
Software Quality and Fault Prediction
Several paper deal with various software metrics based fault prediction, most of them are object-oriented ones. The quality model used by us relies on such metrics that have been proven to highly correlate with fault occurrences. Brito and Melo [5] examined in their study how metrics of object-oriented design can be used for fault prediction. Among the 6 checked metrics 4 showed a strong negative correlation (method hiding factor, method inheritance factor, attribute inheritance factor, polymorphism factor), with the fault numbers, one of them showed a strong positive correlation (coupling factor), and one (attribute hiding factor) did not show any significant result. The results were evaluated using programming languages C++ and Eiffel. The metrics used in that study were quite different from the ones we are using, however, this relatively early study in this field pointed out an important direction. Briand et al. [4] also examined the impact of the object-oriented metrics on faults. They made a case study with the help of 8 groups of students, who implemented the same task in C++. They found that the coupling and inheritance measures are strongly related to the probability of fault detection in a class. They did not find significant impact of cohesion on fault proneness. Among others, the quality model used by us uses these factors, and other studies showed significant correlation between all the mentioned metrics and fault density in Java programming language. Subramanyan and Krishnan [22] examined the connection between the number of defects and the following object-oriented metrics: methods per class, coupling between objects, depth of inheritance tree and number of children. They validated the theory using both C++ and Java programming language. All of these metrics are applied by the quality model used by us. In their study [11], Gyimóthy et al. examined how various object-oriented metrics [7] can be used for fault prediction. They found a strong positive correlation between the number of faults and the following metrics: number of methods per class, depth of inheritance tree, response for class, coupling between objects, lack of cohesion and number of logical lines of code. Although the validation was performed on C++ programs, the results can be applied for Java as well. The quality model [1] used in this paper relies heavily on these previous results. Nagappan et al. [17] presented an universal quality model using software metrics. They used it for bug prediction; however, the method is adaptable to arbitrary measure of quality, i.e. maintainability as well. They found no single set of metrics that fitted all projects. The model used by us was shown to be an adequate one for several projects. Moser et al. [15] presented a comparative analysis of the predictive power of two different sets of metrics for defect prediction. The described methodology provided a classification of Java sources, based on if they are defective or defect-free, with high precision and high recall. The authors found that process metrics are more effective in defect prediction than code metrics. The quality model used by us currently relies on code metrics only, and the above study shows us a possible
Variance of the Quality Change of the Source Code
39
direction for fine-tuning the model. Software quality has also a direct impact on the cost of software development and maintenance. Bakota et al. [2] showed a converse exponential relationship between the maintainability of a software system and the overall cost of development supported by an empirical validation. This result is very important for this study as well, as we point out where great maintainability decrease might happen, and the above study shows that this maintainability decrease will cost more in the future. An earlier study of the cost of software quality was done by Slaughter et al. [21], financially justifying the investments in software quality. We go one step further by arguing how these investments can be used more efficiently. In this research we analyzed Java source code as the applied quality model handles that programming language. However, a quality model for C# was presented by Hegedűs [12], which makes it possible to perform these studies in the future on C# projects as well.
2.2
Mining Software Repositories
Mining software repositories is another large and evolving area that is related to this study. In the annual conference of MSR [16] a great number of studies appear in connection with this research field. Kagdi et al. provide a taxonomy of articles in this area [14], based on the following aspects: software evolution, purpose, representation and information sources. Gall et al. introduce their Relation Analysis [10] that performs a deep analysis of logical coupling of modules. With the evaluation of 28 releases of an industrial software, without analyzing the source code, they were able to discover design flaws like god classes or spaghetti code. We, on the other hand, analyzed the source code and considered the number of operations of every available revisions and commits of 4 systems. In the study [3] of Breu and Zimmermann a history-based aspect mining method is presented. Using version history, the aspect candidates (e.g. locking concerns) are identified. The precision increased with the size of the projects, e.g. for Eclipse they reached 90% for the top ten candidates. The quality model used by us considers lower level metrics of source code, which is aggregated to assess the maintainability. Papers of Ying et al. [24] and Zimmermann et al. [26] describe methodologies for determining change patterns (based on the change history), i.e. sets of files that were changed together frequently in the past. Similar investigation was done in the study by Rysselberghe and Demeyer [23] – frequently applied changes were mined from version control systems. Our study deals with commit type patterns, which is based on the number of commit operations. In the work [19] of Ratzinger et al. an empirical study of predicting refactoring is presented, based on historical data found in version control system. We, on the other hand, try to predict an aspect of the future maintainability change. Zaidman et al. investigate [25] whether production code and the accompanying tests co-evolve by exploring a project’s versioning system, code coverage reports
40
Csaba Faragó
and size-metrics. This study provides a good future direction candidate for further evolving the quality model used by us. Canfora et al. [6] present a method to derive the set of source files impacted by proposed change requests, based on data in version control (CVS) and issue tracking (Bugzilla) systems. Similar to us, they evaluated their concept on 4 software systems. In study [20] Robbes presents an alternative information repository, based on the IDE interactions, along with their implementation. They found it especially useful at refactoring detection. Utilization of data gained from the IDE and issue tracking system is also among out longer term plans.
3
Methodology
3.1
Maintainability Change
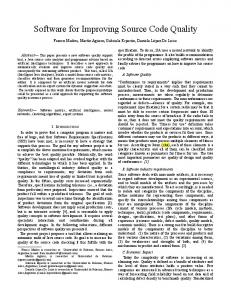
The estimation of the subject systems’ maintainability for each revision was performed by the ColumbusQM probabilistic software quality model [1] that is based on the ISO/IEC 9126 standard [13]. The model calculates an aggregate measure of the following source code metrics: logical lines of codes, the number of ancestors, the maximum nesting level, the coupling between object classes, clone coverage, number of parameters, McCabe’s cyclomatic complexity, number of incoming invocations, number of outgoing invocations, and number of coding rule violations. The calculation is based on expert weights and a statistical aggregation algorithm that uses a so-called benchmark as the basis of the qualification. The resulting maintainability value is expressed by a real number between 0.0 and 1.0. The higher number indicates better maintainability. We wanted to perform variance tests on the absolute change of maintainability, therefore we transformed the maintainability values provided by the model to absolute maintainability changes. It was done as follows: • The original value was transformed to an absolute one with the help of the quantile function calculated by the qnorm() R function [18]. Figure 2 illustrates how the quantile transformation works. Furthermore, the necessity of this step is illustrated as well: a step close to the middle is lower in absolute than the same size of step close to the margins. • The difference of the absolute maintainability value of the actual and the preceding commit was calculated. The maintainability change of the first commit is defined as 0.0. • The difference was multiplied with the actual size (Logical Lines of Code; LLOC) of the system. This was necessary for the following reason: without it the same amount of maintainability change (e.g. introducing 10 coding rule violation) would cause much bigger change compared to the same change in
41
2.054
1.555
0.100 0.202
Variance of the Quality Change of the Source Code
1.0
0.98 0.94
0.9 0.8 0.7
y
0.6
0.58 0.54
0.5 0.4 0.3 0.2 0.1 0.0 −3
−2
−1
0
1
2
3
qnorm(y)
Figure 2: Illustration why quantile conversion is necessary a bigger system. In order to make the maintainability change values really comparable, a normalization with the actual size of the systems was necessary, and we found the multiplication with LLOC as a straightforward and proper method. More details about this transformation can be found in our earlier paper [8].
3.2
Version Control Operation Based Divisions
The basis of the statistical tests performed on the maintainability changes was the number of version control operations. We considered the number of Java source code additions, updates and deletions in each commit. Commits containing no Java related operations (e.g. updating an xml file) were removed at the very beginning of the process. Based on these data triples (i.e. number of additions, updates and deletions) we formed two subsets of the commits in various manners. We performed the tests on each subset-pair combination. For every considered operation (Add, Update, Delete) we defined the divisions based on the existence, the absolute number and the proportion of the operation, considering either all commits, commits containing at least one such operation or commits containing exclusively that operation. By eliminating the trivial divisions the following 7 remained: • DIV1: Take all commits, divide them into two based on the absolute median of the examined operation. It checks if commits containing high number of the checked operation have better effect on maintainability than those containing low number of the same operation
42
Csaba Faragó
• DIV2: Take all commits, divide them into two based on the relative median of the examined operation. It checks if the commits, in which the proportion of the examined operation is high, have better effect on maintainability compared to those where the proportion of the examined operation is low. To illustrate the difference between DIV1 and DIV2 consider a commit containing 100 operations, 10 of them are the examined operation (the absolute number is high but the proportion is low) and a commit containing 3 operations, 2 of them are the examined operation (the absolute number is low, but the proportion is high). • DIV3: The first subset consists of those commits which contain at least one of the examined operations, and the second one consists of the commits without the examined operation. It checks if commits containing the examined operation have better effect on the maintainability than those containing no examined operation at all. • DIV4: Considering only those commits where at least one examined operation exists, divide them into two based on the absolute median of the examined operation. This is similar to DIV1 with the exception that those commits which do not contain any examined operation are not considered. This kind of division is especially useful for operation Add, as this operation is relatively rare compared to file modification, therefore this provides a finer grained comparison. • DIV5: Considering only those commits where at least one examined operation exists, divide them into two based on the relative median of the examined operation. Similar to DIV2; see the previous explanation. • DIV6: The first subset consists of those commits which contain the examined operation only, and the second one consists of the commits with at least one another type of operation. This checks if commits containing the examined operation exclusively have better effect on the maintainability compared to those containing at least one non examined operation. This division is also especially useful in case of file updates. • DIV7: Considering only those commits where all the operations are of the examined type, divide them into two based on the absolute median of the examined operation. This division is used to find out if it is true that commits which contain more file additions result better maintainability compared to those containing less number of additions. It is especially useful in case of file updates, as most of the commits contain exclusively that operation. Considering all 3 operations results in 3*7=21 combinations for every examined software system. More details about these divisions can be found in our previous paper [8].
Variance of the Quality Change of the Source Code
3.3
43
Handling Extreme Values
The variance test is very sensitive to the extreme values. A few, unusual commits (e.g. merging the resulting code of a development performed on another branch, adding code developed in another version control system or renaming a huge number of source files in two steps) cause drastic increase in variance. To neutralize this bias, the commits with very high absolute maintainability change values were eliminated from the analysis. Therefore we omitted commits where the absolute value of the maintainability change exceeded a considerably high value. We checked the absolute maintainability change values of these extraordinary commits, and we found they were at the magnitude of 10,000. On the other hand, the typical absolute maintainability change value is at the magnitude of 100 or lower. Therefore we omitted commits having maintainability change value higher than 1,000.0. Only a few commits per software system caused higher absolute maintainability change than this value (see the outliers in Table 2). We performed the tests with other limits, like 500.0 or 2,000.0, and the results were similar, therefore we found that the limit of round 1,000.0 is a sound one.
3.4
Variance Test
F-tests are a family of statistical tests. One of them is the F-test of equality of variances, which checks if two normal populations have the same or different variance. This test was performed on each division combinations using the var.test() function in R [18]. This function calculates both the ratio of variances, and the pvalue under the null-hypothesis that the variances are the same. The result of this test is the ratio of variances of the values in the sets defined by the divisions, along with the p-value. The p-value indicates the probability of the ratio of variance being at least as extreme as the calculated one, provided that the variances are equivalent. More specifically, the null-hypothesis is that the ratio of variances is 1.0. For better illustration the geometric mean of the ratios (per division basis, taking all the analyzed software) were also calculated. The variance test was not performed on the cases where the size of at least one of the subsets was below 5, because if the number of observations is low, then there is a high risk that the result is false.
4 4.1
Results Examined Software Systems
The tests were performed on the same 4 software systems which we used in our earlier studies ( [8], [9]) and which we use in studies parallel to this one. The original selection criteria were the following:
44
Csaba Faragó • Enough number of observations: the available number of commits containing at least one Java-related operation should be at least 1,000. • Significant code increase: the ratio of the maximum logical lines of code (this is typically the size of the system after the last available commit) and the minimum one (which is typically the size of the initial commit) should be at least 3.0. We analyzed the following 4 systems that fulfilled these criteria: • Ant – a command line tool for building Java applications.1 • Gremon – a greenhouse work-flow monitoring system (commercial).2 • Struts 2 – a framework for creating enterprise-ready java web applications.3 • Tomcat – an implementation of the Java Servlet and Java Server Pages technologies.4
Table 1 shows basic statistics of the selected systems, primarily related to the number of operations: • the name of the project, • the minimal and the maximal logical lines of code, • the total number of available commits, • the number of commits affecting at least one Java file, • the total number of each operations (3 columns), • number of commits affecting at least one particular operation (3 columns), and • the number of commits consisting of that operation exclusively (3 columns).
Table 1: Analyzed systems Name Ant Gremon Struts 2 Tomcat
Min. Max. TLLOC5 2,887 106,413 23 55,282 39,871 152,081 13,387 46,606
Total Java Commits 6,118 6,102 1,653 1,158 2,132 1,452 1,330 1,292
Total number of A U D 1,062 20,000 204 1,071 4,034 230 1,273 4,734 308 797 3,807 485
Rev. with A U 488 5,878 304 1,101 219 1,386 104 1,236
1+ D 55 89 94 77
Rev. with only A U D 196 5,585 19 42 829 8 41 1,201 12 32 1,141 23
Table 2 contains maintainability related statistics: 1 http://ant.apache.org 2 http://www.gremonsystems.com 3 http://struts.apache.org/2.x 4 http://tomcat.apache.org 5 Total
Logical Lines Of Code – Number of non-comment and non-empty lines of code
45
Variance of the Quality Change of the Source Code • the name of the project, • mean of all the maintainability changes, • variance of all the maintainability changes, • mean of maintainability changes without outliers, • variance of maintainability changes without outliers, • standard deviation of maintainability changes without outliers, • number of outliers, and • percentage of outliers.
Table 2: Maintainability statistics Name Ant Gremon Struts 2 Tomcat
With outliers Mean Variance 1.408 15,274.2 -5.505 11,136.0 -22.801 985,767.8 -4.719 138,819.5
Without outliers Mean Variance SD 1.782 5,663.9 75.26 -5.493 8,662.5 93.07 0.957 6,762.7 82.24 -0.555 3,431.7 58.58
Number of Percentage of outliers 10 0.164% 2 0.173% 7 0.400% 10 0.774%
With the outliers both the means and the variances are very hectic. There are outliers in all of the projects with similar magnitudes. By removing the outliers both the means and the variances tend to have similar magnitude of values. Without the outliers the distribution of the data is close to normal. Note that the means are close to 0, compared with the magnitude of standard deviation. Furthermore, the means of all subdivisions are close to 0 as well. There are significant differences between the means as indicated in [8], but these are much lower than their variances. This is an important information for interpreting the results.
4.2
Results of the Variance Tests
The variance tests were performed on all the defined 21 combinations for all the 4 analyzed systems. First, we examine the visual representation of the results illustrated in Figure 3. The figure was generated with the help of R and it contains 3 bar diagrams, one for each operation (Add, Update, Delete). The bars are divided into 7 subsets in all 3 cases, one for each division. In case of every operation division pair there are 5 bars: 4 indicating the results for each project (the thin gray ones), and one for their geometric mean (the thick black one). The data are illustrated on a logarithmic scale diagram. By using a normal scale, one could hardly see the difference between small absolute values, even could not see if it is above or below 1.0. The starting-point of the bars is at 1.0. This
46
Csaba Faragó
Add 100 10 1 0.1 0.01
DIV1
DIV2
DIV3
DIV4 Update
100 10
DIV5
DIV6
DIV7
Ant Gremon Struts 2 Tomcat Geometric mean
1 0.1 0.01
DIV1
DIV2
DIV3
DIV4
DIV5
DIV6
DIV7
DIV5
DIV6
DIV7
Delete 100 10 1 0.1 0.01
DIV1
DIV2
DIV3
DIV4
Figure 3: Illustration of variances
means the ratio of variances higher than 1.0 are represented with a bar on the positive direction (above 1.0), and those of less than 1.0 are represented with a bar on the negative direction (below 1.0). On this diagram the most important information, i.e. if the ratio of variances is above or below 1.0 is the most spectacular. Furthermore, one can really compare the same magnitude but opposite direction values: for example, the ratio of variance of 5.0 and 0.2 are practically the same magnitude with opposite direction; the logarithm scale diagram represents these values with the same absolute size of bars, one located above and the other located below 1.0. The results can be learned informally even from this diagram, without the necessity of studying the numerical values. In cases of operation Add and operation
47
Variance of the Quality Change of the Source Code
Delete, almost all the bars are located on the positive part of the diagram, meaning that these operations increase the variance. On the other hand, in case of operation Update the picture is mixed. Some of the bars (DIV1, DIV4 and DIV7) are positive, while the others are negative. In almost all cases the results are similar (i.e. the sizes and the directions of the bars are similar) for all the 4 projects. However, there are some exceptions; the most spectacular one is DIV5 in case of operation Delete. If the data is not available (operation Delete, DIV7, project Gremon), then a small empty gap can be found on this bar diagram. Note the difference between the value close to 1.0 (e.g. operation Update, DIV1, project Struts 2) and the missing result. Now we examine the results more formally. Table 3 contains the ratio of variances, where the last columns show the geometric means (GM) of the values in the rows. Table 3: Ratio of variances Operation
Add
Update
Delete
Division DIV1 DIV2 DIV3 DIV4 DIV5 DIV6 DIV7 DIV1 DIV2 DIV3 DIV4 DIV5 DIV6 DIV7 DIV1 DIV2 DIV3 DIV4 DIV5 DIV6 DIV7
Ant 8.74 8.74 8.74 2.68 1.54 5.73 2.47 1.91 0.091 0.132 2.98 0.093 0.091 2.72 9.08 9.08 9.08 10.64 3.61 22.19 26.04
Gremon 3.13 3.13 3.13 2.63 1.4 1.87 12.36 1.46 0.107 0.218 3.05 0.117 0.107 3.8 6.55 6.55 6.55 7.78 1.21 11.3 NA
Struts 2 10.01 10.01 10.01 2.37 1.95 8.16 34.17 0.97 0.043 0.084 5.32 0.063 0.043 8.43 8.02 8.02 8.02 4.78 1.41 11.2 11.72
Tomcat 4.18 4.18 4.18 2.63 2.2 0.868 2.63 5.29 0.099 0.745 6.08 0.071 0.099 8.8 9.8 9.8 9.8 5.27 0.407 2.18 4.7
GM 5.82 5.82 5.82 2.57 1.74 2.95 7.24 1.94 0.08 0.21 4.14 0.084 0.08 5.26 8.27 8.27 8.27 6.76 1.26 8.85 11.28
Table 4 contains the calculated p-values that represent the chances of the results being at least as extreme as in the table, provided that the null-hypothesis is true, i.e. the variances are the same. Please note that instead of executing a two-tailed test, we executed two times a one tailed test, and took the better result. The
48
Csaba Faragó
differences between the two methods can be neglected in most of the cases. We treat the p-values lower than 0.01 to be significant, which is indeed 0.02 in case of executing a two-tailed test. 0.0 means that the calculated p-value was so low that the R package was not able to handle it and resulted in zero. The lower limit R can handle is about 10−350 . In case of very low values the exponential format is used as the exponent of 10. All the values are rounded up. From this point on, to increase the readability, the term variance of maintainability change is simply referred to as variance. Table 4: p-values of the variance tests Operation
Add
Update
Delete
Division DIV1 DIV2 DIV3 DIV4 DIV5 DIV6 DIV7 DIV1 DIV2 DIV3 DIV4 DIV5 DIV6 DIV7 DIV1 DIV2 DIV3 DIV4 DIV5 DIV6 DIV7
Ant 0.0 0.0 0.0 −13 10 0.00040 0.0 10−4 0.0 0.0 10−187 0.0 0.0 0.0 0.0 0.0 0.0 0.0 10−8 0.0013 0.0 10−4
Gremon 0.0 0.0 0.0 10−8 0.019 0.00098 10−6 10−5 10−147 10−22 0.0 10−126 10−147 0.0 0.0 0.0 0.0 10−9 0.27 10−11 NA
Struts 2 0.0 0.0 0.0 10−6 10−4 0.0 0.0 0.35 0.0 10−159 0.0 10−242 0.0 0.0 0.0 0.0 0.0 10−8 0.11 0.0 10−4
Tomcat 0.0 0.0 0.0 0.00037 0.0032 0.34 0.039 0.0 −124 10 0.062 0.0 10−131 10−124 0.0 0.0 0.0 0.0 10−6 0.0049 0.0029 0.014
Operation Add. All the values, with one exception, are higher than 1.0 and almost all of them are significant, meaning that operation Add increases variance. This is true for all kinds of occurrences – the simple presence, the high absolute
Variance of the Quality Change of the Source Code
49
number and high proportion as well. For DIV1, DIV2 and DIV3 all the values within a project are the same, which is spectacular in the diagram as well. The reason is that the occurrence of operation Add is relatively low in the commits compared to operation Update. Therefore these are practically the cases where the first subset contains those commits which include at last one file addition, and the second one are those containing no file addition at all. This is the definition of DIV3; for the definitions of DIV1 and DIV2 see Section 3.2. These values are very high (the geometric mean of the values is 5.82, which is among the higher values in the table), meaning that the existence of operation Add heavily increases the variance. Among commits containing at least one file addition, the higher number of additions still increases the variance, see the values in row DIV4. The values found in this case (geometric mean of 2.57) is lower than those in the previous case; however, this is still significantly greater than 1.0. Considering the high proportion of operation Add within commits containing at least one Add, it increases the variance a bit, see the results of DIV5. All the values found in that row are slightly higher than 1.0 with a geometric mean of 1.74. One of the values had a lower significance (one-tailed p-value of 0.019). It is interesting that these values are much lower than those in case of absolute median division. Next row (DIV6) is a slightly contradictory: there is both a high value (8.16) and a value lower than 1.0 (0.868); however, the latter one is not significant. The relatively weak conclusion of this is that commits containing operation Add exclusively have a higher variance compared to those commits containing at least one other operation. Finally, based on the results of DIV7, among commits containing exclusively file additions the higher number of affected files resulted higher variance. The values are located on a wide scale. The highest value in the table (34.17) is found here, while 2 of the 4 values are around 2.5. The smaller values could be the effect of the natural fact that higher number of any operation causes higher variance (i.e. higher amount of work is more likely to cause code quality change compared to a one line modification). Furthermore, this is a good example why calculating geometric mean (7.24) was a better choice than arithmetic mean (that would be 12.91); the former one expresses the common result much better. Based on the above results, the answer of RQ1 is that the higher number of operation Add results in a higher variance in maintainability change. Operation Update. In case of the Update operation there are many values significantly lower than 1.0. The first row (DIV1) presents hectic results, containing a high value (5.29) and a value lower than 1.0 (0.97, not significant) as well. The geometric mean (1.94) meaningfully expresses the results, namely that the high number of operation Update slightly increases the variance. This result is caused by a mixture of two factors. First, higher number of operations increase the variance – having more lines of code changed it is more likely that the net maintainability change would be bigger. Second, operation Update basically lowers the variance in
50
Csaba Faragó
itself; for comparison see the results of operation Add above and operation Delete below. This hectic behavior is the root of these two contradicting factors. Next, DIV2 contains significantly lower values than 1.0, meaning that commits containing higher proportion of Updates cause a lower variance in maintainability change, compared to those containing lower proportion of them. For example, knowing the fact that the mean value of maintainability changes are close to 0, compared with their variance, this generally means that commits containing at least 80% Updates cause significantly lower absolute maintainability change than those of containing only at most 20% of Updates. Values in the next (DIV3) row are still significantly lower than 1.0, indicating that commits containing at least one file update cause lower variance compared to those containing no file updates at all. However, the values are higher (i.e. closer to 1.0, meaning less significant) than those found in case of DIV2. This result is surprising, a lower value (higher reciprocal) was expected. Based on values in row DIV4 it can be concluded that among commits containing at least one update, those of containing higher number of updates cause higher absolute maintainability changes. The values are relatively high (geometric mean is 4.14), and we have similar values in all cases. Comparing the values with those of DIV1, in DIV4 only one of the 2 factors described above is present – the higher number of operations; the other one is not, as all the commits contain Updates per definition. Values in row DIV5 are similar to values of DIV2, among commits containing at least one file Update, high proportion of the operation reduces the variance. Examining values found in row DIV6 we find that these are the same as those in row DIV2. This is because most of the commits contain at least one Update, and the relative median division is made with a 100% threshold (DIV2). This is exactly the same as the definition of DIV6. Reformatting the sentence learned based on this definition, commits containing exclusively Update operation causes lower variance compared with variance caused by those commits containing at least one other type of operation. Finally, the third kind of absolute median division (DIV7) also resulted values significantly higher than 1.0, meaning that among commits consisting of operation Update only, higher number of files affected causes significantly higher variance in maintainability change, compared with those of affecting lower number of files. Comparing the values first with other absolute median divisions of operation Update (DIV1 and DIV4), all the values are positive; second, with the results of DIV7 tests of operation Add, the variance of the values is similarly high. Taking into consideration all of the above results we can answer RQ2 as well. The presence of operation Update decreases the variance of the maintainability change. Absolute median division is an exception – commits containing more updates increase the variance compared to those commits containing less updates. Operation Delete. Operation Delete basically increases the ratio of variances. The first 3 division tests (DIV1, DIV2 and DIV3) gave the same results in all cases; the reason of this is the same as described in the case of file addition. The resulting
Variance of the Quality Change of the Source Code
51
values are high, even higher than in the case of operation Add, meaning that the presence of operation Delete causes even higher variance of maintainability change than caused by operation Add. Values in DIV4 are even higher, meaning that among commits containing at least one delete those containing higher number of this operation cause significantly higher variance. The values in the next row (DIV5) are controversial, having one significantly higher value than 1.0, one significantly lower than 1.0, and 2 of non-significant results. This means that based on these data we cannot formulate any statement about the variance caused by higher proportion of operation Delete among commits containing at least one of this operation. The geometric mean of the values is slightly above 1.0. Finally, DIV7 contains even higher values, meaning that among those commits containing Delete operation exclusively the higher absolute number causes significantly higher variance. The values are so high that it cannot be explained simply by “the more the higher” rule (i.e. more work causes higher variance), as it was the case with operation Update. Furthermore, the scale of variances is also high in this case. Please note the NA (not available) value in case of Gremon – since we found only 8 commits of this type (see Gremon row and last column of Table 1), we decided not to include this result. We left it out also when calculating the geometric mean. Based on the values above, we can answer RQ3 so that operation Delete increases the variance of maintainability change. The highest ratio of variances were caused by the presence of operation Delete.
4.3
Utilization of the Results
This section illustrates how the results can be utilized in practice. We try to simulate the maintainability tendency of software development. Suppose that we have a fixed budget for a deeper investigation of 10% of the program source code changes by an expert (beyond the normal code review). We expect that with the help of the expert’s hints the effect of maintainability decreasing changes will be reduced by 50%, but there will be no effect of the review on commits resulting maintainability increase anyway. The question is, how to use the limited budget most efficiently. In the below example we have 1,000 commits of 2 types: high number of low variance commits with negative expected value, and low number of high variance commits with positive expected value. For this reason, we generated 200 random numbers of normal distribution with a mean of +1.0 and standard deviation of 10.0, and 800 random numbers of normal distribution with a mean of -0.25 and standard deviation of 1.0. In this example these numbers represent the numeric value of maintainability change of the commit in question, i.e. the normalized difference of the maintainability value of the new and the actual revision. We can see that the sum of the low variance values is expected to be around -200, and the sum of the high variance values is expected to be around +200,
52
Csaba Faragó
therefore the sum of all the values together is expected to be about 0. Now let us check the possibilities how the effort of reviewing 100 commits (the 10% of total commits) can be distributed. 1. In the naive case the distribution of the review budget will be random, at least from the variance point of view. In this scenario the reviewed commits could be influenced by the following factors: the availability of the expert, the actual approach of the management and so on. We simulate this case by randomly choosing 100 commits for review. 2. One could argue that it is most likely to gain useful information if we focus only on the cases with negative expected value. We simulate this by selecting 100 random cases out of the 800 values of low variance and negative expected value. 3. We argue that the values of high variance should be considered, because by eliminating high decreases we gain much more, even along with the “missed shots”, compared to the previous cases (provided that the expected value is close to 0, compared with the amplitude of the variance, i.e. it is likely to have large negative values). Therefore we select 100 random cases out of the 200 values of high variance and positive expected value.
Table 5: Results of simulation Nr. 1 2 3 4 5 6 7 8 9 10
Initial 52.3 74.8 220.5 -170.5 118.5 -61.6 -159.0 91.3 11.4 -102.3
Random 124.6 130.4 254.1 -118.6 170.9 -9.9 -99.9 155.4 57.6 -56.1
Negative Mean Value 81.6 105.0 247.3 -140.4 145.7 -33.9 -130.7 114.0 35.6 -80.2
High Variance 181.7 227.5 406.5 7.8 286.7 132.8 52.7 289.8 156.7 80.2
We executed the simulation (programmed in R) of the above three strategies 10 times. Table 5 illustrates the results of these simulations. First column indicates the sequence number of the execution, the second one is the case without the code review (the total amount of maintainability change of the 1000 commit), the third one is the random case, the fourth focuses on the negative values, and the fifth focuses on the high variance. We can see that it was a waste of efforts focusing on the low variance commits with negative expected values comparing with the totally random base case
Variance of the Quality Change of the Source Code
53
(compare the values of the third and fourth columns), but the best strategy was to concentrate exclusively on the values with high variance (compare values in the last column with the other ones). Therefore knowing the expected variance of the values can help us using the limited efforts more efficiently.
5
Threats to Validity
Almost all the results of the research are statistically significant and in almost all cases the values calculated for all examined systems are similar. However, there are factors that might threaten the validity of the results presented above. There is a case where the test results are totally diverging (one of the seven divisions when investigating operation Delete) – we get significantly high values in one case but significantly low in the other. This divergence is caused most probably by the low cardinality of operation Delete; in case of low number of observations, even a few causal cases could lead to unexpected result. Therefore, we think this does not affect the final conclusion regarding that operation. There are some cases where for 3 out of the 4 projects the results are similar, but the fourth one does not support this, or at least not as strongly as the others. These cuckoo eggs also threaten the general validity of the results. But there might be other, not yet discovered correspondence which might provide a better explanation. The number of examined software systems is relatively low, which might lead to one-sided results, and potentially hide important differences between systems of various domains. Considering greater number of software systems, and examining the differences between them could be a direction of future investigations. Nevertheless, the global tendency of the results is convincing even with this number of systems.
6
Conclusions and Future Work
In this study a further step was made towards discovering the effect of the developers’ interactions on the maintainability of the source code. Specifically, the magnitude of the maintainability changes caused by commits were examined, regardless of the direction of these changes. In this research only the number of operations were considered from the available commit related data. The commits were partitioned based on the number of operations from several aspects. All of the resulting divisions were formed such a way to find out if higher number of an operation in the commits have significantly different effect on the variance of maintainability change compared to those commits containing lower number of this operation. As we described in paper [8], operation Update has negative effect on maintainability, operation Add has significantly better impact, and we could not find clear effect of operation Delete on maintainability. This research provided the following results. Operation Add and operation Delete increases, while operation Update decreases the variance of maintainability
54
Csaba Faragó
change. Higher absolute number of any operation causes higher variance. These results help us better allocating the efforts spent on code quality, as described in Section 4.3. It is recommended to pay special attention on commits containing operations which could cause drastic changes in maintainability. These are those of containing higher number of file Additions and file Deletions, especially if the proportion of these operation within the commit is question is high, or commits affecting several files anyhow (regardless by which operation). For example, it is recommended to mandate code review at least for these developments; or, if the code review is mandatory anyway, then it is recommended to do this in these cases with more strict rules. Note that the number of commits containing file Additions is relatively low compared to all the commits, and this is especially true for commits containing file Additions exclusively. In the next steps other available version control data is planned to be considered in the analysis: the files the operation was performed on, the magnitude of changes, the date of commit, the author, the comment, and maybe other direct or derived data as well. Finally, we plan to create a tool (most probably an IDE-plugin) which will discover the hot areas of the source code and indicate the likely effect of the actual commit on maintainability, warning the developers in the most critical ones. The results described in this study is planned to be integral part of the theory behind that utility.
Acknowledgments This work was supported by Lufthansa Systems Hungary. The author would like to thank Rudolf Ferenc and Péter Hegedűs for providing advices to this article.
References [1] Bakota, Tibor, Hegedűs, Péter, Körtvélyesi, Péter, Ferenc, Rudolf, and Gyimóthy, Tibor. A probabilistic software quality model. In Software Maintenance (ICSM), 2011 27th IEEE International Conference on, pages 243–252. IEEE, 2011. [2] Bakota, Tibor, Hegedűs, Péter, Ladányi, Gergely, Körtvélyesi, Péter, Ferenc, Rudolf, and Gyimóthy, Tibor. A cost model based on software maintainability. In Software Maintenance (ICSM), 2012 28th IEEE International Conference on, pages 316–325. IEEE, 2012. [3] Breu, Silvia and Zimmermann, Thomas. Mining aspects from version history. In Automated Software Engineering, 2006. ASE’06. 21st IEEE/ACM International Conference on, pages 221–230. IEEE, 2006.
Variance of the Quality Change of the Source Code
55
[4] Briand, Lionel C, Wüst, Jürgen, Daly, John W, and Victor Porter, D. Exploring the relationships between design measures and software quality in objectoriented systems. Journal of systems and software, 51(3):245–273, 2000. [5] Brito e Abreu, Fernando and Melo, Walcelio. Evaluating the impact of objectoriented design on software quality. In Software Metrics Symposium, 1996., Proceedings of the 3rd International, pages 90–99. IEEE, 1996. [6] Canfora, Gerardo and Cerulo, Luigi. Impact analysis by mining software and change request repositories. In Software Metrics, 2005. 11th IEEE International Symposium, pages 9–pp. IEEE, 2005. [7] Chidamber, Shyam R and Kemerer, Chris F. A metrics suite for object oriented design. Software Engineering, IEEE Transactions on, 20(6):476–493, 1994. [8] Faragó, Csaba, Hegedűs, Péter, and Ferenc, Rudolf. The impact of version control operations on the quality change of the source code. In Computational Science and Its Applications–ICCSA 2014, pages 353–369. Springer, 2014. [9] Faragó, Csaba, Hegedűs, Péter, Végh, Ádám Zoltán, and Ferenc, Rudolf. Connection between version control operations and quality change of the source code. Acta Cybernetica, 21:585–607, 2014. [10] Gall, Harald, Jazayeri, Mehdi, and Krajewski, Jacek. Cvs release history data for detecting logical couplings. In Software Evolution, 2003. Proceedings. Sixth International Workshop on Principles of, pages 13–23. IEEE, 2003. [11] Gyimóthy, Tibor, Ferenc, Rudolf, and Siket, István. Empirical validation of object-oriented metrics on open source software for fault prediction. Software Engineering, IEEE Transactions on, 31(10):897–910, 2005. [12] Hegedűs, Péter. A Probabilistic Quality Model for C# – an Industrial Case Study. Acta Cybernetica, 21(1):135–147, 2013. [13] ISO/IEC. ISO/IEC 9126. Software Engineering – Product quality 6.5. ISO/IEC, 2001. [14] Kagdi, Huzefa, Collard, Michael L, and Maletic, Jonathan I. A survey and taxonomy of approaches for mining software repositories in the context of software evolution. Journal of Software Maintenance and Evolution: Research and Practice, 19(2):77–131, 2007. [15] Moser, Raimund, Pedrycz, Witold, and Succi, Giancarlo. A comparative analysis of the efficiency of change metrics and static code attributes for defect prediction. In Software Engineering, 2008. ICSE’08. ACM/IEEE 30th International Conference on, pages 181–190. IEEE, 2008. [16] Mining Software Repositories (MSR) conference. http://www.msrconf.org.
56
Csaba Faragó
[17] Nagappan, Nachiappan, Ball, Thomas, and Zeller, Andreas. Mining metrics to predict component failures. In Proceedings of the 28th international conference on Software engineering, pages 452–461. ACM, 2006. [18] R Core Team. R: A Language and Environment for Statistical Computing. R Foundation for Statistical Computing, Vienna, Austria, 2013. [19] Ratzinger, Jacek, Sigmund, Thomas, Vorburger, Peter, and Gall, Harald. Mining software evolution to predict refactoring. In Empirical Software Engineering and Measurement, 2007. ESEM 2007. First International Symposium on, pages 354–363. IEEE, 2007. [20] Robbes, Romain. Mining a change-based software repository. In Proceedings of the Fourth International Workshop on Mining Software Repositories, page 15. IEEE Computer Society, 2007. [21] Slaughter, Sandra A, Harter, Donald E, and Krishnan, Mayuram S. Evaluating the cost of software quality. Communications of the ACM, 41(8):67–73, 1998. [22] Subramanyam, Ramanath and Krishnan, Mayuram S. Empirical analysis of ck metrics for object-oriented design complexity: Implications for software defects. Software Engineering, IEEE Transactions on, 29(4):297–310, 2003. [23] Van Rysselberghe, Filip and Demeyer, Serge. Mining version control systems for facs (frequently applied changes). In Proceedings of International Workshop on Mining Software Repositories (MSR’04), pages 48–52, 2004. [24] Ying, Annie TT, Murphy, Gail C, Ng, Raymond, and Chu-Carroll, Mark C. Predicting source code changes by mining change history. Software Engineering, IEEE Transactions on, 30(9):574–586, 2004. [25] Zaidman, Andy, Van Rompaey, Bart, Demeyer, Serge, and Van Deursen, Arie. Mining software repositories to study co-evolution of production & test code. In Software Testing, Verification, and Validation, 2008 1st International Conference on, pages 220–229. IEEE, 2008. [26] Zimmermann, Thomas, Zeller, Andreas, Weissgerber, Peter, and Diehl, Stephan. Mining version histories to guide software changes. Software Engineering, IEEE Transactions on, 31(6):429–445, 2005.