Mycologia, 95(5), 2003, pp. 809–819. q 2003 by The Mycological Society of America, Lawrence, KS 66044-8897
Variation among natural isolates of Neurospora on small spatial scales
Amy J. Powell
tion. Results also revealed that adjacent isolates from a single plant can possess different functional alleles at het-c, an observation meaningful in the context of the proposed role of het-c in self recognition. Key words: clonal and vegetative growth, colonization, ecology, het-c
Department of Biology, University of New Mexico, Albuquerque, New Mexico 87131
David J. Jacobson Department of Biological Sciences, Stanford University, Stanford, California 94305
Laura Salter Department of Mathematics and Statistics, University of New Mexico, Albuquerque, New Mexico 87131
INTRODUCTION
Neurospora crassa is among the best characterized organisms in laboratory genetics and biochemistry. In addition, substantial attention has been given to certain aspects of the distribution and systematics of N. crassa and other Neurospora species. More than 5000 isolates have been catalogued from worldwide collections (Turner et al 2001, Jacobson et al unpubl). Studies with these isolates have been fruitful in developing an understanding of species distribution on a global scale. On a local scale, studies have shown that multiple genetically distinct individuals of the same species and even members of different species can be found in a given location (Perkins et al 1976, Perkins and Turner 1988). However, the magnitude of variation in a given location has not been quantified and mechanisms of colonization and dispersal remain issues of debate. Most field collections of Neurospora species have been from tropical and subtropical regions after either planned or natural fires, and natural populations of Neurospora often occur where fire is a part of the ecosystem (Perkins et al 1976, Perkins and Turner 1988, Pandit and Maheshwari 1996, Turner et al 2001). Current evidence suggests that most Neurospora species respond dramatically to fires. Germination of ascospores (sexual propagules) requires either direct heat activation or activation by chemical byproducts in burned plant material (Perkins 1986, Pandit and Maheshwari 1996). In addition, fire appears to create ideal substrate conditions, in the form of scorched, dead plant material, for colonization. The extent of colonization of burned plants by species of Neurospora can be visually impressive. Within 2 wk of the Florida Everglades fires in spring 1999, conidiating species of Neurospora were observed in some places on nearly all plants, from grasses to woody stems ( Jacobson and Natvig, pers obs). For instance, in a single 1000 m2 area, it was possible to
Donald O. Natvig1 Department of Biology, University of New Mexico, Albuquerque, New Mexico 87131
Abstract: Although species of Neurospora are among the most studied model organisms in genetics and biochemistry, basic questions remain with respect to their ecology and population biology. In this study, we sought to clarify relationships among individuals over a small spatial scale, toward assessing both local variation and mode of colonization. Isolates of Neurospora were collected after fires in the Florida Everglades (May 1999), where abundant colonies appeared on diverse plants, including grasses and woody shrubs. Colonies were sampled in a linear fashion from two adjacent scorched sugarcane stems at one site and from a burned woody shrub at a distant second site. Species and mating types were assigned based on crossing behavior. Variation at two loci, het-c and frq, was determined by direct sequencing of PCR products. The results demonstrated substantial within- and among-species variation on a small scale, with up to three species and six different haplotypes occurring on a single stem. In total, four species and more than 10 genetically distinct individuals (haplotypes) were present across the three stems, often with multiple individuals occupying the same position. A permutation analysis revealed that individuals were not distributed randomly and that adjacent nodes on cane stems were more likely than chance to be colonized by the same haplotype. This suggests that visible eruptions of conidia on burned plants reflect substantial vegetative mycelial spread through subsurface tissues after primary colonizaAccepted for publication March 11, 2003. 1 Corresponding author. E-mail:
[email protected]
809
810
MYCOLOGIA
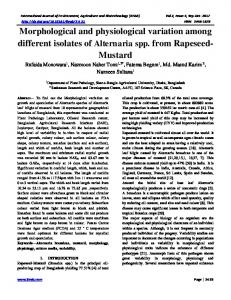
FIG. 1. Colonies of Neurospora spp. on scorched stems in the Florida Everglades, May 1999. A. Eruptions of conidia and hyphae through fissures in the scorched bark of an unknown shrub. B. On sugarcane (Saccharum officinarum), eruptions occur primarily at the nodes (arrow). Such eruptions signal mycelial growth below epidermal tissues. C. Extensive growth of Neurospora mycelium under the peeled bark of a burned woody stem (arrows).
observe thousands of eruptions (tufts of mycelia and conidia, FIG. 1) on burned stems. While sampling from scorched sugarcane stems in the Everglades, we observed that conidial eruptions occurred almost exclusively at the nodes (FIG. 1). This presented an opportunity to ask whether all such eruptions on an individual stem and adjacent stems typically are derived from a single ascospore or, instead, represent colonization by multiple individuals. Two mutually exclusive hypotheses serve as points of reference for this question. One hypothesis would assert that all such eruptions in a given location arise from the clonal propagation of a single ascosporederived individual. A second would assert that each visible eruption is the result of germination of a different, genetically unique ascospore. Neither hypothesis has received absolute support in previous studies. There are reports of multiple species and mating types from a single plant and, occasionally, from a single eruption (Perkins et al 1976, Perkins and Turner 1988, Turner et al 2001). On the other hand, there is evidence that colonization of plant stems by a single individual can lead to the copious spread of mycelium below surface tissues (FIG. 1; Pandit and Maheshwari 1996), leading to the eruption of hyphae and conidia in multiple locations on
the same substrate. The abundance of conidia produced by species of Neurospora further suggests the possibility of dispersal of individuals by wind and animals, but the extent of propagation by these mechanisms is not known. The present study examined relationships among conidial isolates of Neurospora sampled from stems at two locations, toward the goals of testing these hypotheses and obtaining preliminary information regarding population structures. Isolates were characterized in terms of species and mating types, as well as by sequence analysis of two autosomal loci, frq and het-c, both of which have proven valuable for typing individuals in previous studies (Gallegos et al 2000, Powell et al 2001). The results demonstrate colonization of single stems by multiple individuals and species, with a minimum of 10 individuals and four species being observed across three stems, refuting the hypothesis that growth on individual stems represents clonal propagation only. The spatial distribution of individuals on stems nevertheless provides evidence that the subepidermal spread of mycelium and possibly dispersal by conidia contribute to observed patterns of colonization. The complex mosaic of species and individuals observed at local sites confirms that
POWELL TABLE I.
ET AL:
NEUROSPORA
811
ON SMALL SPATIAL SCALES
Characterization of isolates by position, species, mating type, and alleles observed at frq and het-c
Isolatea
Species
SC1-6 SC1-7 SC1-9 SC1-10 SC1-11 SC1-13 SC2-2 SC2-3 SC2-6 SC2-10 SC2-11 SC2-14 SC2-15 SC2-16 SC2-17 SC2-18 Sh-1 Sh-2 Sh-3
N. N. N. N. N. N. N. N. N. N. N. N. N. N. N. N. N. N. N.
Sh-4
N. sitophila
tetrasperma tetrasperma sitophila sitophila tetrasperma sitophila tetrasperma tetrasperma crassa tetrasperma tetrasperma tetrasperma tetrasperma crassa sitophila tetrasperma intermedia sitophila tetrasperma
Mating type (mat A (mat A mat A mat A (mat A mat A (mat A (mat A mat a (mat A (mat A (mat A (mat A mat A mat A (mat A mat A mat a (mat A
1 mat a) 1 mat a) 1 mat a) 1 mat a) 1 mat a) 1 1 1 1
mat mat mat mat
a) a) a) a)
1 mat a) 1 mat a)
mat A
het-c alleleb
frq alleleb
Source of isolate
het-c -C het-cOR-A het-cOR-B het-cOR-B het-cPA-A het-cPA-B het-cOR-A het-cOR-A het-cPAV-A het-cOR-A het-cOR-A het-cPA-A het-cPA-A het-cPAV-A het-cOR-B het-cOR-A het-cPAV-B het-cPA-B het-cOR-A
frq-A frq-A frq-D frq-D frq-A frq-D frq-C frq-C frq-B frq-A frq-A frq-A frq-A frq-B frq-D frq-A frq-B frq-D frq-A
het-cPA-B
frq-D
Sugarcane stem 1, node 6 Sugarcane stem 1, node 7 Sugarcane stem 1, node 9 Sugarcane stem 1, node 10 Sugarcane stem 1, node 11 Sugarcane stem 1, node 13 Sugarcane stem 2, node 2 Sugarcane stem 2, node 3 Sugarcane stem 2, node 6 Sugarcane stem 2, node 10 Sugarcane stem 2, node 11 Sugarcane stem 2, node 14 Sugarcane stem 2, node 15 Sugarcane stem 2, node 16 Sugarcane stem 2, node 17 Sugarcane stem 2, node 18 Shrub, 60 cm sample point Shrub, 90 cm sample point Shrub, 120 cm sample point Shrub, 180 cm sample point
PA
a Isolates from two sugarcane stems (SC1 and SC2) and an unidentified Shrub (Sh). Numbers after the hyphens indicate relative positions on stems, as specified in the last column. b Allelic variation at het-c and frq loci is denoted by letters following hyphens. Variation at het-c includes differences within and between functional classes. Functional classes of het-c are designated OR (Oak Ridge), PA (Panama) and PAV (Panama variant) as described in the text.
species of Neurospora are excellent candidates for studies of fungal population biology and ecology. MATERIALS AND METHODS
Sampling. A field trip in May 1999, 2 wk after wildfires in the Florida Everglades, provided the opportunity to conduct a study of local natural populations of Neurospora. At certain burn sites, nearly every fire-damaged plant had conidial blooms of members of the genus. For this study, individual conidial clusters systematically were sampled at two sites 70–90 km northwest of Ft. Lauderdale. One site (268 209 N latitude, 808 479 W longitude) was characterized by dense growth of volunteer sugarcane along the banks of the New Miami Canal. The second site (268 209 N, 808 379 W), approximately 20 km from the first, was a shrub-dominated habitat alongside the Levee 5 road. At the first site, conidia were collected from each node of two adjacent scorched sugarcane stems (SC1 and SC2, respectively), each approximately 3 m tall. At the second site, conidia were collected at 30 cm intervals along the main stem (2 m tall) of a scorched woody shrub (Sh). To obtain samples, conidia were smeared onto small strips of sterile filter paper, which were placed into sterile envelopes for transport back to the laboratory (Perkins and Turner 1988). In the notation used here, relative sampling positions are indicated with numbers after hyphens. So, for example,
SC1-2 refers to an isolate from the second node of sugarcane stem No. 1, while Sh-1 refers to an isolate from the first (lowermost) sample point on the shrub. Details regarding the positions at which isolates were collected are presented in TABLES I and II. Species assignments for Neurospora field isolates. Species assignments were made using standard methods (Perkins and Turner 1988, Turner et al 2001). In the laboratory, a small section (approximately 10 mm2) of each filter-paper strip was removed with sterile scissors and placed on agar medium to produce a primary culture. All cultures first were tested for self-fertility on Westergaard’s synthetic crossing medium (Davis and de Serres 1970). Self-fertile strains with four-spored asci were assigned to N. tetrasperma, a self-fertile member of the genus. Primary cultures producing eight-spored asci were presumed to harbor mixed cultures (i.e., with both mat A and mat a mating types), representing any of the heterothallic species, N. crassa, N. intermedia, N. discreta or N. sitophila. Mixed-mating-type cultures were resolved by dilution plating to recover single-conidium isolates. Self-sterile isolates obtained in this manner were crossed against designated species tester strains and assigned to species based on fertility (Perkins and Turner 1988). Sequence analysis of frq and het-c. Nucleotide sequence data from two loci, frq (linkage group VII) and het-c (link-
812 TABLE II. Haplotype number
MYCOLOGIA Summary of unique and shared haplotypes and their relative locations on stems Haplotypea and species
1
mating type mat A 1 mat a, het-cOR-A, frq-A N. tetrasperma
2
mating type mat A, het-cOR-B, frq-D N. sitophila
3
mating type mat frq-C N. tetrasperma mating type mat frq-A N. tetrasperma mating type mat N. sitophila mating type mat frq-A N. tetrasperma mating type mat N. crassa mating type mat N. crassa mating type mat N. intermedia mating type mat N. sitophila
4
5 6
7 8 9 10
Isolatesb
Haplotype relative locations
SC1-7 SC2-10 SC2-11 SC2-18 Sh-3 SC1-9 SC1-10 SC2-17 SC2-2 SC2-3
Neighboring nodes (SC2-10 and SC2-11) and a non-neighbor node (SC2-18) on SC2, a single node on SC1 (SC1-7), and a geographically distant shrub stem (Sh-3)
Neighboring nodes (SC2-14 and SC2-15) on SC2 and a single node on adjacent SC1 (SC1-11) Geographically distant stems, Sh and SC1
A 1 mat a, het-cPA-C,
SC1-11 SC2-14 SC2-15 SC1-13 Sh-4 SC1-6
Single cane node
a, het-cPAV-A, frq-B
SC2-6
Single cane node
A, het-cPAV-A, frq-B
SC2-16
Single cane node
A, het-cPAV-B, frq-B
Sh-1
Single shrub sample
a, het-cPA-B, frq-D
Sh-2
Single shrub sample
A 1 mat a, het-cOR-A, A 1 mat a, het-cPA-A,
A, het-cPA-B, frq-D
Neighboring nodes (SC1-9 and SC1-10) on SC1 and a single node on SC2 (SC2-17) Neighboring nodes on SC2
a
Letters following het-c and frq represent specific allele types (see Table I). Isolates from two sugarcane stems (SC1 and SC2) and an unidentified Shrub (Sh). Numbers after the hyphens indicate relative position on a given stem (see Table I). b
age group IIL), were obtained to assess within- and between-species variation. The molecular analysis of both loci was carried out by polymerase chain reaction (PCR), followed by direct sequencing of PCR products. Genomic DNA was isolated as previously described (Gallegos et al 2000). For each isolate, an upstream region of the frq gene and a portion of the het-c coding region were amplified using standard PCR methods. PCR products were prepared for direct dideoxy sequencing with Amicont Microcont-PCR Centrifugal Filter devices, following the manufacturer’s specifications. Nucleotide sequence data for purified PCR fragments were obtained with dideoxy dye-terminator chemistry (ABI Prismt BigDyey Terminator Cycle Sequencing Ready Reaction Kit with AmpliTaqt DNA polymerase, FS) and a model 377 automated sequencer, in accordance with instructions supplied by the manufacturer (Perkin-Elmer). Raw nucleotide sequence data were processed and analyzed with the Sequenchery (version 3.1.1) software package and ClustalW (Thompson et al 1994). Final alignments were obtained by visual inspection as described below. In species of Neurospora, frq has a key role in control of the circadian cycle (Dunlap 1999). Previous studies demonstrated that sequences in the frq upstream region show
substantial polymorphism, even among closely related individuals of the same species (Gallegos et al 2000). The target region of frq was amplified with primers 59 CAA TAC CTC TCC TCC TCC CTA C 39 and 59 CTC TGC TGC TAG TAT CTC GC 39. With respect to the N. crassa GenBank entry (accession number U17073), these primers correspond to nucleotides 809–830 and 1561–1542, respectively. The PCR fragment produced with this primer pair is 752 nucleotides in length. Purified PCR products were sequenced with the primers above and a third primer, corresponding to nucleotides 1271–1252. The het-c locus likewise has proven useful in distinguishing among individuals of the same species (Powell et al 2001). This locus is of additional interest in population studies because it is a heterokaryon incompatibility gene that is involved in self recognition (Wu et al 1998). The importance of self recognition in nature is a function of the frequency at which individuals with different functional het alleles encounter one another. Our sampling permitted assessment of the het-c status of adjacent isolates from a single plant. For each isolate, the specificity region (Saupe et al 1996) of the het-c locus was amplified, along with flanking regions,
POWELL
ET AL:
NEUROSPORA
as an approximately 300 base-pair PCR product, with the exact product size being a function of the specific allele amplified. The N. crassa het-cOR sequence (strain 74-OR23IVA, GenBank accession number L77234, Saupe et al 1996) served as template for the design of primers: 59 CAG TGG CTC TCG TGG CAG AGG 39 and 59 GGC CAA CGA TCA CTT CAC CCA AT 39, which correspond to nucleotides 1153–1173 and 1463–1441, respectively. Nucleotide sequence data for the het-c purified PCR products were generated with the primers used for amplification. The partial frq and het-c sequences reported here have been deposited with GenBank under accession numbers AY091529–AYO91548 and AF494255–AF494274, respectively. Tree-building methods. Phylogenetic trees were constructed to determine whether mating behavior accurately reflected phylogeny. Analysis of het-c in the context of phylogeny is complicated by the fact that this locus is under balancing selection, with multiple ancient alleles maintained in populations. The expectation is therefore that speciation will be reflected in het-c trees but only within functional allele classes (Powell et al 2001). Final nucleotide sequence alignments for frq and het-c were obtained manually. The frq alignment was straightforward, with homologous nucleotide positions being unambiguous for all sequences. No insertion-deletion events were observed. In addition to sequences obtained for this study, a partial N. crassa frq sequence was included in the alignment (Oak Ridge background, accession number U17073, Aronson et al 1994). The resulting alignment included residues corresponding to nucleotides 878–1242 in the N. crassa Oak Ridge frq sequence. The het-c nucleotide sequence alignment was informed by the het-c amino-acid sequence alignment of Wu et al (1998). In addition to the sequences reported here, these partial het-c nucleotide sequences were included in this alignment (GenBank accession numbers given in parentheses): N. crassa Oak Ridge allele from strain 74-OR23-IVA (L77234), N. crassa Groveland allele from strain Groveland 1-c (AF196305), N. crassa Panama allele from strain c9-2 (AF195874), N. tetrasperma Oak Ridge alleles from strains P514a and P556a (AF195261 and AF195265, respectively), N. tetrasperma Panama allele from strain P586a (AF195271), and N. tetrasperma Panama variant allele from strain P535a (AF195263). The resulting alignment included residues corresponding to nucleotides 1230–1434 in the entry for the N. crassa Oak Ridge (het-cOR) allele. Maximum-likelihood and parsimony methods were employed to estimate relationships among isolates at frq and het-c loci, using the beta 8 version of PAUP* 4.0 (Swofford 2001). Bootstrap analyses were performed using 1000 bootstrap replicates. Haplotype distribution. A permutation procedure was developed to test whether identical haplotypes were present at adjacent nodes more frequently than expected by chance. Only data for the cane stems were employed in obtaining the results presented. Results obtained with data pooled across sites were congruent with those presented, but they were excluded here due to concerns that differ-
ON SMALL SPATIAL SCALES
813
ences in genetic structure between sites might lead to artificial clustering of haplotypes. To perform the test, the haplotype data were permuted 1000 times by randomly assigning haplotypes to stem locations. For each permutation, the number of times that identical haplotypes occurred at adjacent nodes was recorded. The test was performed for isolates of all species on cane combined and separately for isolates of N. tetrasperma only. It was not performed for individual species other than N. tetrasperma due to small sample sizes. The field data revealed four instances where identical haplotypes occurred at adjacent cane nodes, considering isolates of all species, and three instances where identical N. tetrasperma haplotypes occurred at adjacent cane nodes. Therefore, in the all-species permutation test, a Pvalue was computed using the percentage of replicates that showed four or more adjacent positions with identical haplotypes, while in the N. tetrasperma test, a P-value was computed using the percentage of replicates that showed three or more adjacent positions with identical haplotypes. All computations for permutation testing were carried out with programs written by one of the authors (L.S.) in the S-Plus software package (version 5.0, MathSoft Inc., 1998). Details regarding implementation of the test are presented below. RESULTS
Species assignments for Neurospora field isolates. Primary cultures were established from 35 sampled positions across the three stems (two sugarcane, SC1 and SC2; and one shrub, Sh). Twelve of the 35 samples yielded a single species in primary culture, whereas 23 revealed the presence of at least two species. From the 23 mixed samples, eight single-species isolates (no more than one per sample) were recovered by single-conidium subculture (isolates SC1-9, SC1-10, SC1-13, SC2-6, SC2-17, Sh-1, Sh-2 and Sh-4). The isolates analyzed in this study were therefore a subset of the total number sampled from the three stems, and they included the 12 isolates that gave no initial indication of being from a mixed culture, as well as eight isolates derived from single-conidium subcultures from mixed primary cultures. These isolates represent a sampling cross section, which includes representatives from opposite ends of a given stem as well as pairs of isolates from adjacent positions. Laboratory tests for self fertility and crossing experiments against standard Neurospora tester strains demonstrated that four different species of Neurospora were present among the samples taken from the three plants. Eleven of the 20 isolates examined were self-fertile N. tetrasperma, six were N. sitophila, two were N. crassa and one was N. intermedia (TABLE I). Five of the six N. sitophila isolates were mating type mat A, while the sixth isolate was mat a. One of the two N. crassa isolates was mat a, while the second was mat A. The sole N. intermedia isolate was mat A.
814
MYCOLOGIA
FIG. 2. Relationships among frq sequences. The tree shown is based on analysis of frq sequences from 20 Florida isolates reported here, along with the sequence from a common N. crassa laboratory strain (Nc Oak Ridge, see Materials and Methods). Four frq variants were observed among the Florida isolates, and these are designated frq-A through frq-D. Each variant was specific to a given species, with the exception that the N. crassa clade (frq-B group) also included the sole N. intermedia isolate (Sh-1). The upstream portion of the frq locus has been analyzed in previous studies to estimate phylogenetic relationships among species of Neurospora. The tree shown is similar to that obtained previously, but the actual pattern of species divergence is subject to question (discussed in Skupski et al 1997). The tree was obtained with maximum-likelihood analysis (molecular clock forced), and values are shown for branches with greater than 50% support in bootstrap analysis employing 1000 replicates. Maximum-parsimony analysis produced a similar tree but resulted in a single shared node for N. tetrasperma and N. sitophila clades in contrast with the distinct N. tetrasperma lineage shown.
Sequence variation at frq and het-c. Substantial variation was observed among isolates for both frq and het-c (FIGS. 2 and 3). Among the 20 isolates, there were four different frq variants and seven het-c variants. Variation at frq supported species assignments based on crossing behavior (FIG. 2). Variation at the het-c locus included ancient functional allelic diversity, with each variant falling into one of two previously recognized het-c functional allele groups, Panama (het-cPA) or Oak Ridge (het-cOR). The distinct functional alleles observed at this locus diverged prior to the origin of the genus and family (Wu et al 1998; TABLE I; FIG. 3). Closely related individuals of the same species can have the same or different functional alleles at het-c. This has been shown previously (Powell et al 2001) and was observed here as well. For example, N. tetrasperma isolate SC2-18 features
the Oak Ridge functional allele (het-cOR) while N. tetrasperma isolate SC2-15 has the Panama functional allele (het-cPA). Within het-c Panama and Oak Ridge functional allele classes, each variant was specific for a particular species, and relationships among variants reflected species assignments (FIG. 3), providing additional support for these assignments. Species and haplotype distribution on burned substrate. Nucleotide sequences from the frq and het-c loci, together with mating type, were used to assign a haplotype to each isolate (TABLE II). The number of distinct haplotypes, 10, specifies the minimum number of individuals represented among the 20 isolates examined. The actual number of ascospore-derived individuals represented by the 20 isolates is almost certainly greater than 10, given that (i) two of
POWELL
ET AL:
NEUROSPORA
ON SMALL SPATIAL SCALES
815
FIG. 3. Variation within and between het-c allele classes. The tree shown is based on analysis of het-c sequences from the 20 Florida isolates examined in this study, in addition to seven sequences reported previously (Powell et al 2001, Wu et al 1998) included for reference. The reference sequences are from N. crassa (Nc) strains designated Panama, Oak Ridge and Groveland and N. tetrasperma (Nt) strains P586a, P535a, P514a, and P556a (see Materials and Methods). The tree reflects trans-species polymorphism, as has been observed in previous studies, with each of three allele classes (het-cPA, het-cPAV and het-cOR) being present in multiple species (Powell et al 2001, Wu et al 1998). The het-cPAV allele type is a variant found in multiple species that appears to have the functional specificity of het-cPA (see Powell et al 2001). This tree contrasts markedly with results from our analysis of frq, which resulted in the grouping of all isolates assigned to a given species. Note in particular the presence of the three different het-c allele types in isolates of N. tetrasperma, despite the close relationship among all isolates of this species, as determined by analysis of frq (see FIG. 2). The pattern of branching within each functional het-c allele clade supports current species groupings in so far as all variants are species specific. The tree was obtained using maximum-parsimony analysis with 1000 bootstrap replicates.
the haplotypes, one from N. tetrasperma and another from N. sitophila, were observed at both sampling locations, approximately 20 km apart; and (ii) the number of isolates analyzed was only a subset of those actually sampled and a small fraction of the conidial eruptions present. Isolates examined from the two cane stems included three different species and eight different haplotypes. Three different species and four distinct haplotypes were present among the shrub stem isolates, which were sampled at 30 cm intervals. The pattern of haplotype distribution suggests a combination of colonization by multiple ascospore-derived individu-
als and vegetative spread on individual stems. For example, one sugarcane stem showed N. tetrasperma at neighboring nodes (SC1-6, haplotype 6; SC1-7, haplotype 1) and at a non-neighbor node (SC1-11, haplotype 4). N. sitophila occurred at neighboring nodes SC1-9 (haplotype 2) and SC1-10 (haplotype 2) and also at node SC1-13 (haplotype 5) (TABLES I and II). The second cane stem, adjacent to the first, featured N. tetrasperma at several pairs of neighboring nodes: SC2-2 (haplotype 3) and SC2-3 (haplotype 3) near the base of the stem, SC2-10 (haplotype 1) and SC211 (haplotype 1), and SC2-14 (haplotype 4) and SC215 (haplotype 4), with the latter two pairs located in
816
MYCOLOGIA
the upper third of the stem (TABLE I). N. crassa was collected at nodes SC2-6 (haplotype 7) and SC2-16 (haplotype 8) from the same stem. N. tetrasperma again was sampled at the top of this stem, at node SC2-18. Conidial eruptions on stems signal mycelial growth below surface tissues (FIG. 1), raising the question of how much stem volume may be occupied by a single individual. In the case of the shrub stem, four different individuals were recovered at sampling points separated by 30 cm intervals. However, the several instances of adjacent cane nodes possessing identical haplotypes (TABLE II) suggested vegetative spread of single individuals through subepidermal tissues. To assess the likelihood that such observations actually indicate vegetative spread of a single individual, permutation analyses were performed using the haplotype data obtained from the cane isolates (see Materials and Methods). Considering all cane isolates, identical haplotypes occurred at adjacent positions four times out of nine instances where adjacent nodes were sampled (TABLE II). Permutation analysis demonstrated that the occurrence of four or more pairs of neighboring nodes with identical haplotypes was a rare event, with 11 instances of four and one instance of five such node pairs in 1000 replicates (FIG. 4A). Therefore, the occurrence of identical haplotypes at adjacent positions four times out of nine instances where adjacent nodes were sampled is highly significant (P 5 0.012). Likewise, when considering only the 10 N. tetrasperma isolates from cane, the corresponding permutation analysis produced 30 instances of three adjacent node pairs and one instance of four adjacent node pairs with identical haplotypes in 1000 replicates (FIG. 4B). Again, the actual finding of three instances with identical haplotypes out of four where neighboring nodes possessed N. tetrasperma was significant (P 5 0.031), and it further suggests that haplotypes were non-randomly distributed in our samples. These results support the supposition that vegetative propagation through subepidermal tissues can be extensive enough to spread an individual across neighboring nodes. An alternative explanation is that adjacent nodes often share haplotypes because conidial dispersal is most efficient over short distances, with the result that adjacent nodes are more likely to be colonized by conidia from a given source point than are distant nodes. This alternative seems less likely based on the observation that, by the time field samples were collected, within 2 wk of the fire, all nodes on a stem had abundant conidia. This suggests that a given node most often was colonized before the time that adjacent nodes were producing conidia. Ascospore dispersal cannot account for haplotype
FIG. 4. Results of permutation analyses testing random haplotype distribution. Observed haplotypes from all species (A) and N. tetrasperma only (B) were randomly permuted in 1000 replicates. In the all-species model, 16 possible stem positions were analyzed, including nine pairs of adjacent nodes. The N. tetrasperma analysis modeled 10 possible stem positions, with four adjacent node pairs (see TABLE I). For each replicate, the number of times identical haplotypes occurred at adjacent positions was scored. The horizontal axis indicates the number of adjacent node pairs with identical haplotypes in a given replicate, while the vertical axis indicates the number of replicates (out of 1000) that produced a given score. Among all cane isolates in our sampling, identical haplotypes occurred at adjacent nodes four times (the corresponding permutation class is indicated with the arrow). Based on the permutation analysis, the chance occurrence of four or more adjacent haplotype pairs in such a sample is rare (P 5 0.012). Among N. tetrasperma isolates from cane, identical haplotypes occurred at adjacent nodes three times, also a rare event in the permutation analysis (P 5 0.031, see Results). These results support the conclusion that collected haplotypes were not randomly distributed on the stems and suggest spread of individuals by subepidermal growth from node to node.
POWELL
ET AL:
NEUROSPORA
distributions in our samples because none of the observed colonies had produced perithecia before sampling. As of yet, we cannot assess the likelihood of clonal spread between different plants by conidial dispersal. DISCUSSION
Genetic variation on a small spatial scale. Our analyses revealed both substantial diversity in species (supported by both crossing and sequence results) and genetic variation within individual species on a small scale. As many as three species and six haplotypes were found on a single stem (TABLE I). The observed within-species variation, including the presence of multiple ancient het-c alleles within individual species, indicates that these lineages represent dynamic populations, wherein genetic exchange among individuals is taking place (see Powell et al 2001). These results almost certainly understate the diversity present. More than half of the primary cultures were comprised of two or more individuals, and only a subset of these were analyzed after recovery of single-spore isolates (see Results). Furthermore, isolates were scored for only three genes. It is likely that different isolates with the same three-gene haplotype were not identical in all cases throughout their genomes, especially in cases where a given haplotype was observed at two different field sites. Among sexual populations of filamentous fungi, there appears to be broad variation in the range of diversity that can exist in a given locale. The substantial within- and among-species variation observed here for Neurospora appears to parallel that observed for certain other fungi. Both ascomycetes and basidiomycetes, including Lophodermium piceae (Mu¨ller et al 2001), Rhabdocline parkeri (McCutcheon et al 1993), Coriolus versicolor and Stereum hirsutum (Boddy and Rayner 1982), have been shown to exhibit considerable variation on small scales. However, such variation stands in contrast to that observed for the basidiomycete Armillaria bulbosa. In one location, a single A. bulbosa genetic individual was estimated to be 1500 years old and occupied a 15-hectare region (Smith et al 1992). Ecology and distribution. Previous studies have resulted in several tentative conclusions relevant to the ecology of Neurospora species (Perkins et al 1976, Perkins and Turner 1988, Pandit and Maheshwari 1996, Turner et al 2001): (i) Conidia are not durable propagules. Their primary roles appear to be fertilization and perhaps dispersal of clones over limited spatiotemporal scales. (ii) Ascospores, in addition to being
ON SMALL SPATIAL SCALES
817
sexual propagules, are more durable than conidia and are present and abundant in some natural reservoir, probably soil, where they survive for long periods. (iii) Ascospores are dormant until activated by heat or exposure to chemical byproducts of burned vegetation. (iv) The ecological role of Neurospora species is that of primary colonizers in the succession associated with decomposition of plants. Although our field observations are consistent with these conclusions, our specific observations on local distribution demonstrate a greater degree of intraand interspecies variation than has been revealed in previous studies, highlighting a need for additional study on both large and small scales. Most notably, the occurrence of multiple species in single samples has been observed rarely (Perkins and Turner 1988) but was the rule among our Florida samples. Furthermore, the magnitude of species diversity observed in the Florida sample, four species among 20 isolates, might be exceptional. In any case, it appears to stand in contrast with recent studies of the genus in temperate western United States forests, where nearly 95% of 500 samples from New Mexico to Alaska appear to be N. discreta (unpubl). Studies of natural isolates of Neurospora raise questions regarding within- and among-species competition. Under competitive exclusion (e.g. Hardin 1960), two species with identical ecological requirements cannot coexist indefinitely. It has been suggested that competitive exclusion does not hold for Neurospora species (Turner et al 2001) because there is no evidence that the different species of Neurospora in the habitats sampled either partition resources or exhibit differences in temporal or spatial distribution. The disturbed habitats inherent in causing Neurospora blooms are perhaps more consistent with nonequilibrium situations where species coexistence is influenced by environmental instability, such as in ‘‘lottery competition’’, where individuals compete for access to units of resources (Chesson and Warner 1981, Sale 1982), or in the ‘‘paradox of the plankton’’, where coexistence is present before competitive displacement can take place (Hutchinson 1961). Pattern of substrate colonization and population structure. It has been proposed that the primary colonization of a given plant by Neurospora occurs at the root, after the germination of ascospores in soil, with subsequent mycelial growth upward through root and subepidermal stem tissues (Pandit and Maheshwari 1996). The distribution of haplotypes observed on stems in our study strengthens the supposition that subepidermal mycelial growth is important in colonization. At the same time, the observed distribution is difficult to reconcile with the idea that all
818
MYCOLOGIA
primary colonization takes place through root tissues. If colonization were strictly through root systems, then the observed presence of multiple haplotypes on a single stem would represent the growth of several individuals through the lower portions of the same stem. This mode of colonization would predict greater haplotype diversity on the lower portions of stems. No such pattern was observed. Dividing the sample points of each stem into root-proximal and distal halves, and considering position on a given stem only (i.e., excluding comparisons across different stems), seven haplotypes occurred only distally, six occurred only proximally and two occurred both proximally and distally (TABLES I and II). The high level of diversity observed among isolates in our study nevertheless suggests an important role for ascospores in colonization. Our results therefore are somewhat mysterious, given the presumption that the reservoir for ascospores is the soil. It is difficult to conceive rapid above-ground dispersal of ascospores from a soil reservoir in the hours and days after intense fire. It is possible therefore that conidia have an important role in the dispersal of individuals between stems. Additional study will be required to determine the relative roles of ascospores and conidia in colonization. Questions regarding the mechanisms of colonization aside, it is clear that colonies of Neurospora in nature frequently encounter individuals of different species and different individuals of the same species. This would appear to provide ample potential for inter- and intraspecies interactions. Interspecies hybridization can be achieved with species of Neurospora in the laboratory (Perkins et al 1976, Turner et al 2001). The close association of isolates of different species in nature indicates the potential for hybridization in nature, but no evidence for such hybridization has been reported yet. The observed close association of individuals also emphasizes the importance of heterokaryon incompatibility reactions among individuals. Heterokaryon incompatibility is believed to be important for nonself recognition, an argument supported by observed trans-species polymorphism at the heterokaryon incompatibity locus het-c (Wu et al 1998, Powell et al 2001). Our results show that neighbors on a single stem can possess different het-c functional alleles (TABLE I). Moreover, given the diversity of species in our sample, together with evidence that the genetics of heterokaryon incompatibility is conserved across species (Wu et al 1998, Powell et al 2001), it is reasonable to wonder if heterokaryon incompatibility genes have significance for interspecies interactions, in addition to intraspecies interactions. Evidence for both intraspecific and interspecific vegetative incompati-
bility reactions have been reported for another ascomycete genus, Phomopsis, which is associated with the inner bark of trees (Brayford 1990). It is not known to what extent het-c and other heterokaryon incompatibility genes in Neurospora function in interspecies interactions. In summary, this study of Neurospora isolates from Florida demonstrates that (i) substantial diversity can be present among isolates on small scales, and (ii) the pattern of growth on a small spatial scale can derive from multiple ascospore-germination events combined with vegetative spread and perhaps dispersal by conidia. These observations represent pieces of a larger puzzle that is the natural history of this genus. Solving the larger puzzle will require additional study, which will include addressing questions in population biology and ecology. Such study holds great promise based on both the growing number of wild isolates obtained from natural settings (Turner et al 2001) and the long history of members of the genus in laboratory biology, including the recent acquisition of the genome sequence of N. crassa (http://www-genome.wi.mit.edu/annotation/fungi/ neurospora/). ACKNOWLEDGMENTS
This work was supported by NSF grants to D.J.J. (MCB9713015) and D.O.N. (MCB-9603902). The work of D.J.J. also was supported by an NSF grant (MCB-9728675) awarded to David D. Perkins.
LITERATURE CITED
Aronson BD, Johnson KA, Dunlap JC. 1994. Circadian clock locus frequency: protein encoded by a single open reading frame defines period length and temperature compensation. Proc Natl Acad Sci USA 91:7683–7687. Boddy L, Rayner ADM. 1982. Population structure, intermycelial interactions and infection biology of Stereum gausapatum. Trans Brit Mycol Soc 78:337–351. Brayford D. 1990. Vegetative incompatibility in Phomopsis from elm. Mycol Res 94:745–752. Chesson PL, Warner RR. 1981. Environmental variability promotes coexistence in lottery competitive systems. Am Nat 117:923–943. Davis RH, de Serres FJ. 1970. Genetic and microbiological research techniques for Neurospora crassa. Method Enzymol 17A:79–143. Dunlap JC. 1999. Molecular bases for circadian clocks. Cell 96:90–271. Gallegos A, Jacobson DJ, Raju NB, Skupski MP, Natvig DO. 2000. Suppressed recombination and a pairing anomaly on the mating-type chromosome of Neurospora tetrasperma. Genetics 154:623–633. Hardin G. 1960. The competitive exclusion principle. Science 131:1292–1297.
POWELL
ET AL:
NEUROSPORA
Hutchinson GE. 1961. The paradox of the plankton. Am Nat 95:137–145. McCutcheon TL, Carroll GC, Schwab S. 1993. Genotypic diversity of a fungal endophyte from Douglas fir. Mycologia 85:180–186. Mu¨ller MM, Valjakka R, Suokko A, Hantula J. 2001. Diversity of endophytic fungi of single Norway spruce needles and their role as pioneer decomposers. Mol Ecol 10: 1801–1810. Pandit A, Maheshwari R. 1996. Life history of Neurospora intermedia in a sugarcane field. J Biosciences 21:57–79. Perkins DD. 1986. Hints and precautions for the care, feeding and breeding of Neurospora. Fungal Genet Newsl 33:35–41. ———, Turner BC. 1988. Neurospora from natural populations: toward the population biology of a haploid eukaryote. Exp Mycol 12:91–131. ———, ———, Barry EG. 1976. Strains of Neurospora collected from nature. Evolution 30:281–313. Powell AJ, Jacobson DJ, Natvig DO. 2001. Allelic diversity at the het-c locus in Neurospora tetrasperma confirms outcrossing in nature and reveals an evolutionary dilemma for pseudohomothallic ascomycetes. J Mol Evol 52:94– 102. Sale PF. 1982. Stock-recruit relationships and region coexistence in a lottery competitive system: a simulation study. Am Nat 120:139–159.
ON SMALL SPATIAL SCALES
819
Saupe SJ, Kuldau GA, Smith ML, Glass NL. 1996. The product of the het-c heterokaryon incompatibility gene of Neurospora crassa has characteristics of a glycine-rich cell wall protein. Genetics 143:1589–1600. Skupski MP, Jackson DA, Natvig DO. 1997. Phylogenetic analysis of heterothallic Neurospora species. Fungal Genet Biol 21:153–162. Smith ML, Bruhn JN, Anderson JB. 1992. The fungus Armillaria bulbosa is among the largest and oldest living organisms. Nature 356:428–431. Swofford DL. 2001. PAUP: phylogenetic analysis using parsimony (* and other methods), (version 8.0 beta for Macintosh). Laboratory of Molecular Systematics, National Museum of Natural History, Smithsonian Institution. Thompson JD, Higgins DG, Gibson TJ. 1994. Clustal-W: improving the sensitivity of progressive multiple sequence alignment through sequence weighting, position-specific gap penalties and weight matrix choice. Nucleic Acids Res 22:4673–4680. Turner BC, Perkins DD, Fairfield A. 2001. Neurospora from natural populations: a global study. Fungal Genet Biol 32:67–92. Wu J, Saupe SJ, Glass NL. 1998. Evidence for balancing selection operating at the het-c heterokaryon incompatibility locus in a group of filamentous fungi. Proc Natl Acad Sci USA 95:12398–12403.