Variations in Models and Parameters in Probabilistic Seismic Hazard Analysis Lalu Makrup Department of Civil Engineering, Islamic University of Indonesia, Yogyakarta, 55584 Indonesia Corresponding author e-mail:
[email protected],
[email protected]
ABSTRACT Variability in probabilistic seismic hazard analysis is very large. The variability comprised aleatory and epistemic uncertainty. Inherent in random phenomenon and lack of knowledge about some model or parameter in seismic hazard analysis is the uncertainty of aleatory and epistemic respectively. Conjunction with the uncertainties, the alteration of model and parameter was studied here to make out transformation of seismic hazard result in seismic hazard calculation. The study result proved that there are alterations to seismic hazard outcomes was caused by some models and parameters change.
KEYWORDS: Hazard analysis, model, parameter, alteration, outcome.
INTRODUCTION Earthquake threat to the life on the earth surface have been occurred in long time and such hazard will keep on exist since lithosphere still move relative to each other. The earthquake sources are anywhere in the world, in form of seismotectonic and seismogenic zones. Most of them are in vicinity of the boundaries of tectonic plate. To mitigate disaster caused by earthquake, associate with building structural hazard, need to know magnitude of earthquake shaking in the future. Probabilistic Seismic Hazard Analysis (PSHA) is a methodology that appropriate to solve the problem. The PSHA has been used by experts as basis to determine motion design and other purpose according to earthquake engineering. Makrup and Muntafi (2016)[1] used PSHA for a site as basis to obtain the ground motion at the ground surface. The result was acceleration time history at ground surface which can be utilized to access and design a structural building in the site. Makrup et al. (2016)[2] used PSHA to access the earthquake threat in Sorowako nickel mine field, Sulawesi, Indonesia. The results were seismic hazard map for Sorowako and in vicinity area that can be utilized to access probable seismic hazard in the area. In this study PSHA was carried out to see the models and parameters change to the seismic hazard computation results. Uncertainty of the models and the parameters applied to the PSHA are large. Associate to this condition, change of the model and parameter in seismic hazard calculation are examined here to distinguish alteration of seismic hazard result. Examples of uncertainties are a) future earthquake location, b) future of earthquake properties (e.g., magnitude), c) ground motion at a site given the mean value of motion, d) detail of the fault rupture process (e.g., rupture direction), e) geometry of seismotectonic and seismogenic zones, f) distribution describing source parameters (e.g., rate, b- 10105 -
Vol. 21 [2016], Bund. 25
10106
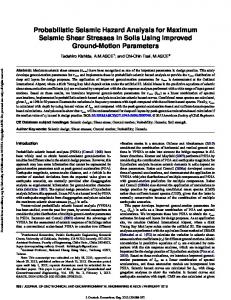
value, maximum magnitude), g) mean value of ground motion given the source properties, h) limit on going shaking. The a) to d) known as aleatory uncertainties (UR) and e) to h) called as epistemic uncertainties (UK) (Mcguire, 2004)[3]. Study of PSHA result alteration that was caused by model and parameter change in seismic hazard calculation performed by McGuire (2004) with figure out the source group of Hayward, San Andreas, San Gregorio, Concord, Calaveras, Green Valley, Rodgers Creek fault and background seismicity source, and for individual fault of Hayward for Berkley in California U.S. Asrurrifak, (2010)[4] carried out study of dip angle change of the interface event and slip rate of shallow crustal zone. In this research, seismic hazard of Bengkulu Sumatra Indonesia was studied relate to change of hazard since model and parameter alteration in seismic hazard computation. The study was conjunction with peril of the great Sumatra fault to a site in Bengkulu (Figure 1).
Figure 1: The great Sumatra Fault Segment
TOTAL PROBABILITY THEOREM Probabilistic concept has allowed uncertainties in the site, location, and rate of recurrence of earthquake and in the variation of the ground motion characteristic with earthquake size and location to be explicitly considered in the evaluation of seismic hazards. Probabilistic seismic hazard analysis (PSHA) provide a framework in which these uncertainties can be identified, quantified, and combined in rational manner to provide more complete picture of seismic hazard. For a given earthquake occurrence, the probability of a ground motion parameter A will be exceed a particular value a can be computed using total probability theorem (Kramer, 1996)[5], that is,
Vol. 21 [2016], Bund. 25
10107
PA (a ) = ∫
∫
P( A > a | m, r ) f M (m) f R (r )drdm
M R
(1)
where P(A>a|m,r) is a probability distribution of a particular value a will be exceeded a ground motion parameter A (the distribution was a log normal), fM(m) is a probability distribution of earthquake magnitude that commonly used is an exponential distribution which developed first by Gutenberg-Richter (1944)[6], fR(r) is a relative probability distribution of distance. Frequency of a seismic event λ(A>a) for n number of earthquake sources was determined by the function: n
λ A ( a ) = ∑ vi ∫ i =1
∫
M R
P( A > a | m, r ) f M (m) f R (r )drdm
(2)
where νi is rate of earthquake occurrence in ith source. By combination of equation (2) and Poisson distribution can be obtained ground motion design (the uniform hazard spectrum).
METHOD Ground Motion Models The earthquakes considered in this analysis are generated in different tectonic environments for rock site conditions. However, earthquake ground motions have been shown to vary dramatically between these different environments. Therefore, several different attenuation relations have been applied to account for these different tectonic environments (Petersen et al., 2004)[7]. Ground-motion prediction equations, or attenuation relations, relate ground motions to a given magnitude, distance from the source to the site, fault type, soil condition, and tectonic environment. In this study, the ground motion equation of Sadigh et al., (1997)[8] and Atkinson-Boore (2006)[9], and Chiou-Youngs (2006)[10] used to calculate ground motion for the crustal fault (Tabel 1).
Parameters and Models Parameters and models are considered to analyze are in the Table 1. Table 1: Models and parameters are considered No. Model/Parameter 1 Magnitude distribution model 2 Attenuation model 3 4 5 6 7
Minimum depth of earthquake source (fault) Maximum magnitude of earthquake Parameter b Slip rate of fault motion Rate (ν)
Change Exponential and characteristic model Sadig et al., (1997), Boore-Atkinson, (2006), and Chiou-Youngs (2006) 0 km, 3 km, and 6 km 6.6, 7.1, and 7.6 0.9, 1.0, and 1.1 0.9, 1.0, and 1.1 0.5ν, 1.0ν, and 1.5ν
Vol. 21 [2016], Bund. 25
10108
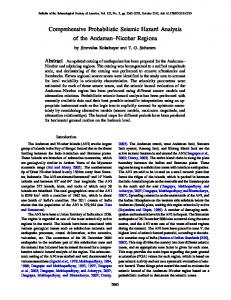
Seismic Hazard Calculation Computation of seismic hazard was started with point 102.2847 East ; 3.8209 South, that is a global coordinate of a site in Bengkulu City. Then calculating the hazard based on PSHA and all of the great Sumatran fault segments with hazard level 10% probability of exceedance in 50 years and site with rock condition. Result of the analysis were the uniform hazard spectrum (Figure 2) and PGA = 0.1236g.
Figure 2: Seismic hazard curve of Bengkulu in rock With the basis of the PGA then it was done hazard deaggregation analysis. The purpose of the analysis is to acquire which faults of the great Sumatra fault that give hazard to the site. The results of the hazard de-aggregation were magnitude and distance contribution to hazard (Figure 3) and seismic sources which gave the hazard to the site in Bengkulu i.e. fault Dikit, Ketaun, Musi, Manna, and Kumering (Table 3).
Figure 3: Hazard de-aggregation result of Bengkulu in rock
Vol. 21 [2016], Bund. 25
10109
Table 2: Sources that give hazard to Bengkulu Fault Name
Dikit Ketaun Musi Manna Kumering
Dominant Hypocenter Distance R(km) 152.5109 66.4354 44.5942 43.2705 161.6769
Dominant Magnitude Moment Mw 7.1251 6.8992 6.756 6.8019 7.3924
Contribution to Hazard (%) 0.0316 8.3521 41.8309 49.7578 0.0277
Furthermore, hazard computation was worked out the first by fault group (Dikit, Ketaun, Musi, Manna and Kumering) and the second by single fault, i.e. the fault which have closest distance to the site.
Figure 4: The Sumatra fault segment closest distance to Bengkulu. The fault segment with closest distance to Bengkulu is Manna and may also Musi (Figure 4). Magnitude minimum for all fault are set on 5 and magnitude maximum are set on 7.2, 7.3, and 7.6 (Siech and Natawidjaja, 2000)[11] (see Table 3). Rate of earthquake occurrence determined based on the slip-rate of fault motion (Petersen et. al., 2008 and 2004). Those magnitudes minimum and maximum applied to solve the magnitude distribution i.e. exponential and characteristic magnitude
Vol. 21 [2016], Bund. 25
10110
distribution. For pure characteristic distribution, recurrence interval (TCH) of the characteristic magnitude (MCH) determined based on the equation (3).
TCH =
1 ( 0.59 M CH −0.99 ) 10 Sr
(3)
The equation derived rooted in combination of moment seismic equation (McGuire, 2004), equation of rupture area of an earthquake (Well and Coppersmith, 1994)[12] and slip-rate (mm/year) of fault motion (Sr). The recurrence rate of the characteristic magnitude to be νCH = 1/TCH (Table 3).
Table 3: Recurrence rate of characteristic magnitude of the great Sumatra fault segment Fault segment name Slip-rate Rate (vCH) MCH (mm/yr) (event/yr) Seulimeum 27 7.5 0.0099 Aceh 27 7.4 0.0114 Tripa 27 7.7 0.0076 Renun 27 7.7 0.0076 Toru 27 7.4 0.0114 Angkola 23 7.7 0.0064 Barumun 11 7.7 0.0031 Sumpur 11 7.7 0.0031 Sianok 11 7.2 0.0061 Sumani 11 7.1 0.0070 Suliti 11 7.4 0.0046 Siulak 11 7.3 0.0053 Dikit 11 7.3 0.0053 Ketaun 11 7.3 0.0053 Musi 11 7.2 0.0061 Manna 11 7.3 0.0053 Kumering 11 7.6 0.0035 Semangko 11 7.3 0.0053 Sunda 11 7.4 0.0046
Vol. 21 [2016], Bund. 25
10111
RESULTS Result of seismic hazard analysis in this research is performed in curves, especially seismic hazard curves.
Change of Hazard Because Magnitude Distribution Model Modification Magnitude distribution include in the analysis (McGuire, 2004) are pure characteristic, standard characteristic (Young and Coppersmith, 1985)[13], and exponential distributions (Gutenberg-Richter, 1944). Result of calculation shown in Figure 5. Figure 5 show the difference of hazard curve with pure characteristic, standard characteristic and exponential distributions. Change of hazard calculation result of employing pure characteristic to standard characteristic and exponential distribution was large, rather than from standard characteristic to exponential distribution model. So alteration of hazard value caused by change of magnitude distribution model from pure characteristic to others is significant enough.
Figure 5: Seismic hazard curve of Bengkulu (computed based on pure characteristic, standard characteristic, and exponential model)
Vol. 21 [2016], Bund. 25
10112
Figure 6: Seismic hazard curve of Bengkulu (computed based on Sadigh et al. (1997), Boore-Atkinson, (2006), and Chiou-Youngs (2006)
Change of Hazard Value Caused by Attenuation Model Alteration Hazard calculation with change of earthquake ground motion attenuation model was computed based on Sadigh et al. (1997), Boore-Atkinson (2006), and Chiou-Youngs (2006). Figure 6 show the differences of hazard curve calculated based on the three attenuation models. From the figure is seen that larger change of the hazard computation result was occurred because use change of ground motion attenuation model from Sadigh et al. (1997) to Chiou-Youngs (2006) and vice versa. The change of the hazard computation result based on change of ground motion attenuation model from Sadigh et al. (1997) to Boore-Atkinson (2006) and from Boore-Atkinson (2006) to Chiou-Youngs (2006) did not give the largest change. So alteration of hazard value caused by change of ground motion attenuation model did not very significant.
Change of Hazard Caused by Modification of Minimum Depth of Earthquake Source Change of minimum depth of seismic source used in analysis was 0.0 km, 3.0 km, and 6.0 km. Result of analysis shown in Figure 8. The figure show, that seismic hazard curve that obtained from the analysis with three depths individually, nearly has no differences, the curve nearly coincide to each other. This implied that there was no alteration of hazard value caused by minimum depth of seismic source change.
Vol. 21 [2016], Bund. 25
10113
Figure 7: Seismic hazard curve of Bengkulu (computed based on minimum depth of source 0 km, 3 km, and 6 km)
Change of Hazard Value Caused by Alteration of Maximum Magnitude Hazard computation by maximum magnitude of M6.6, M7.1 and M7.7 individually in PSHA has result as shown in Figure 9. The figure indicated that analysis with alteration of maximum magnitude brought little bit change to the hazard result. Therefore the alteration of hazard result caused by maximum magnitude adjustment was not significant enough.
Vol. 21 [2016], Bund. 25
10114
Figure 9: Seismic hazard curve of Bengkulu (computed based on maximum magnitude M6.6, M7.1, and M7.6)
Change of Hazard Value Caused by Adjustment of b-Parameter Calculation of hazard by adjust value of b-parameter was done for b-value 0.9, 1.0, and 1.1. Computation result show the hazard value which obtained for each of b-parameter value has the clear difference (Figure 10), but the difference did not big enough. Therefore influence of the b-parameter change in PSHA gave the alteration no big enough to hazard result.
Change of Hazard Value Caused by Transformation of Fault Motion Slip Rate Calculation of hazard by alter value of fault motion slip rate was carried out for slip rate 8, 11, and 14 mm/year. The result of hazard calculation since of the slip rate adjustment can be made out in Figure 11. The figure illustrates that change of the slip rate value in PSHA nearly did not give alteration to hazard result. The seismic hazard curves is nearly coincide to each other.
Vol. 21 [2016], Bund. 25
10115
Figure 10: Seismic hazard curve of Bengkulu (computed based on b-parameter 0.9, 1.0, and 1.1)
Figure 11: Seismic hazard curve of Bengkulu (computed based on slip-rate 8, 11, and 14 mm/year)
Vol. 21 [2016], Bund. 25
10116
Change of Hazard Value Caused by Transformation of Occurrence Rate Calculation of hazard by alter value of earthquake occurrence rate is done for the rate value 0.5v, 1.0 v, and 1.5 v. v is original earthquake occurrence rate of computational result. Result of hazard calculation since of the rate adjustment can be made out in Figure 12. As the hazard result which was calculated by slip rate adjustment (Figure 11) nearly has such pattern with Figure 12. That condition indicated that change of occurrence rate value in PSHA nearly did not bring big alteration to hazard result.
Figure 12: Seismic hazard curve of Bengkulu (computed based on rate × 0.5, rate × 1.0, and rate × 1.5,)
DISCUSSION a. Change of hazard because magnitude distribution model modification Figure 6 is seismic hazard curve which was produced from PSHA with three magnitude distribution models individually i.e. pure characteristic, standard characteristic, and exponential magnitude distribution. The figure shows the result comparison visually of the use of the three distributions in PSHA. The use change of the model from pure characteristic to be standard characteristic and exponential model caused hazard result with big enough difference. It was occurred on accelerations amplitude about less equal 0.2g. On accelerations amplitude about more than 0.2g the difference is not seen for use change of the model from pure characteristic to exponential, but the use change of the model from pure characteristic to standard characteristic show the difference still
Vol. 21 [2016], Bund. 25
10117
occurred. The use change from standard characteristic to exponential magnitude distribution model is seen also the difference still occurred although it was not big enough. Based on the above condition use of single magnitude distribution model in PSHA will give the uncertainty result, because the other model, if it is used in PSHA also will give the other result. Therefore in PSHA can be utilized two or three magnitude distribution models to overcome the uncertainty with each model can be given the weight as a probability to be right. The amounts of the weight have to be equal to one.
b. Change of hazard caused by attenuation model alteration Figure 7 is seismic hazard curve which was produced from PSHA with three attenuation models individually, i.e. Sadigh et al. (1997), Boore-Atkinson (2006), and Chiou-Youngs (2006). The figure shows the difference of hazard computation result with the three attenuation model. The difference of the three curves is occurred on acceleration amplitude about great equal to 0.1g. On the acceleration amplitude the curve is separated to each other. On acceleration amplitude about less then to 0.1g, the difference is not so seem, the curve is nearly coincide to each other. Based on the above condition use of single attenuation model in PSHA will give the uncertainty result, because the other model, if it is used in PSHA also will give the other result. Therefore in PSHA can be utilized two or more attenuation models to overcome the uncertainty with each model can be given the weight as a probability to be right. The amounts of the weight must be equal to one.
c. Change of hazard caused by modification of minimum depth of earthquake source Figure 8 is seismic hazard curve which was produced from PSHA with three minimum depths of earthquake source individually, i.e. 0.0 km, 3.0 km, and 6.0 km. The use change of the three minimum depths i.e. from 0.0 km to 3.0 km and or to 6.0 gave the hazard result which was not different among them. The three curves nearly coincide. Based on the above condition use of 0.0 km has enough for shallow crustal source depth. There was no change of hazard result with the alteration of minimum depth value.
d. Change of hazard caused by alteration of maximum magnitude Figure 9 is seismic hazard curve which was produced from PSHA with three maximum magnitudes individually, i.e. M6.6, M7.1, and M7.7. The figure shows the difference of hazard computation result with the three maximum magnitudes. The use change of the three maximum magnitude i.e. form M6.6 to M7.1 and or to 7.7 has given the hazard result which enough different for acceleration amplitude great equal 0.1g, their curves separated among them. For acceleration amplitude less than 0.1g little bit different, the three curves nearly coincide. Based on the above condition the use of single maximum magnitude in PSHA will give the uncertainty result, because the other maximum magnitude, if it is used in PSHA also will give the other result. Therefore in PSHA can be utilized two or three maximum magnitude to overcome the uncertainty with each maximum magnitude can be given the weight as a probability to be right. The amounts of the weight must be equal to one.
e. Change of hazard caused by adjustment of b-parameter Figure 10 is seismic hazard curve which was produced from PSHA with three b-parameter values individually, i.e. 0.9, 1.0, and 1.1. The figure shows the result comparison visually of the use of the three b-parameters in PSHA. The use change of the three b-parameter values i.e. from 0.9 to
Vol. 21 [2016], Bund. 25
10118
1.0 and or to 1.1 has given the hazard result which enough different for the whole of acceleration amplitude. Based on those conditions use of single b-parameter in PSHA will give the uncertainty result of hazard. Therefore in PSHA can be utilized two or three b-parameters to treat uncertainty with each b-parameter can be given the weight as a probability to be right. The amounts of the weight must be equal to one.
f. Change of hazard caused by transformation of fault motion slip rate Figure 11 is seismic hazard curve which was produced from PSHA with three fault motion slip rates individually i.e. 8, 11, and 14 mm/year. The figure shows that there is no the significant difference of hazard computation result with the three fault motion slip rates in PSHA. The use change of the three slip rate values i.e. for 8 to 11 and or to 14 mm/year has given a little change of hazard result for the whole of acceleration amplitude. Although the change is less, however, uncertainty treatment is necessary to be carried out in PSHA according to the use of fault motion slip rate.
g. Change of hazard caused by transformation of occurrence rate Figure 12 is seismic hazard curve which was produced from PSHA with three earthquake occurrence rates individually i.e. 0.5v, 1.0v, and 1.5v. v is original earthquake occurrence rate of computational result (event/year). The figure shows that there is a little difference of hazard computation result with the three earthquake occurrence rates in PSHA. The use change of the three rate values i.e. for 0.5v, 1.0v, and 1.5v event/year has given the hazard result with little bit different for the whole of acceleration amplitude, as it was found in item-f. Although difference is less, however, uncertainty treatment is necessary to be done in PSHA according to the use of occurrence rate.
CONCLUSION AND RECOMMENDATION Conclusion The probabilistic seismic hazard analysis was perform in the research to account for the change of seismic hazard curve pattern which caused by alteration of model and parameter. The models were considered here i.e. magnitude distribution and earthquake ground motion attenuation models. The parameters are considered i.e. minimum depth, maximum magnitude, b-parameter, slip rate of fault motion, and earthquake occurrence rate. Results of seismic hazard computation according to the use of magnitude distribution and earthquake ground motion attenuation model show that it has been found uncertainty if be used one model only in the analysis. Results of seismic hazard calculation relate to the use of single parameter of the maximum magnitude, b-parameter, slip rate of fault motion, and earthquake occurrence rate show that it has been found uncertainty if be used one parameter only in the analysis.
Vol. 21 [2016], Bund. 25
10119
Therefore to reduce the uncertainty should be utilized some models and parameters with each model or parameter can be given weight as a probability to be correct. The number of all weight for models or parameters should be equal to one.
Recommendation Based on conclusions which were mentioned above, can be considered some of recommendations follow. In the next research according to probabilistic seismic hazard analysis, should be used some models and parameters to reduce uncertainty of the analysis result Uncertainty can be reduced by giving the weight to the model or parameter as a probability of the model or parameter to be correct. Amounts of the weight value for all of the models or parameters which be used should be equal to one. The same research should be carried out in different site, so that the result of the research can be compared with the result of this research to detect the result difference of the next research and this research according to models and parameter that was used.
ACKNOWLEDGEMENTS The author gratefully acknowledges, Directorate of Academic, Islamic University of Indonesia, that has funded this research. We are thanks also to head of Civil Engineering Study Program for his support to the research.
REFERENCES 1. Makrup, L. and Muntafi, Y. (2016). Artificial Ground Motion for the Cities of Semarang and Solo Indonesia Generated Based on Probabilistic Seismic Hazard Analysis and Spectral Matching, EJGE (Electronic Journal of Geotechnical Engineering), Vol. 21, [2016] Bund. 21. 2. Makrup, L., Sunardi, B., and Muntafi, Y. (2016). Design Accelerograms by Time and frequency Domain Matching Based on Seismic Hazard in Sorowako Field of Sulawesi Island, Indonesia, EJGE (Electronic Journal of Geotechnical Engineering), Vol. 21, [2016] Bund. 21. 3. McGuire R. K. (2004), Seismic Hazard and Risk Analysis. Earthquake Engineering Research Institute MNO-10. 4. Asrurrifak, M. (2010). Peta Respon Spektra Indonesia untuk Perencanaan Struktur Bangunan Tahan Gempa dengan Model Sumber Gempa Tiga Dimensi dalam Analisis Probabilistik. Dissertation. Institut of Technology Bandung, Indonesia.Kramer S.L., (1996). Geotechnical Earthquake Engineering. Prentice Hall: New Jersey. 5. Kramer S.L., (1996). Geotechnical Earthquake Engineering. Prentice Hall: New Jersey. 6. Gutenberg, B. & Richter, C. F., (1944). Frequency of Earthquake in California. Bulletin of the Seismological Society of America, Vol.34, No. 4, pp. pp. 1985-1988. 7. Petersen, M.D., Dewey, J., Hartzell, S., Mueller, C., Harmsen, S., Frankel, A.D., and Rukstales, K., (2004). Probabilistic seismic hazard analysis for Sumatra, Indonesia and
Vol. 21 [2016], Bund. 25
10120
across the Southern Malaysian Peninsula. Elsevier. 8. Sadigh K. et. al., (1997) Attenuation Relationships for shallow Crustal Earthquake Based on California Strong Motion Data, Seismological Research Letters, Volume 68 Januari/Pebruary 1997, Seismological Society of America 9. Boore, D.M. and Atkinson, G.M. (2006). ″Ground motion prediction equations for earthquakes in eastern North America″, Bulletin of the Seismological Society of America, v. 96, p. 21812205. 10. Youngs, R.R., Chiou, S. J, dan Silva W.J., (1997). Strong Ground Motion Attenuation Relationships for Subduction Zone Earthquakes. Seismological Research Letters, Volume 68 Januari/Pebruary 1997, Seismological Society of America 11. Atkinson, G.M. and Boore, D.M., (2003). Empirical ground-motion relations for subduction-zone earthquakes and their application to Cascadia and other regions. Bulletin of the Seismological Society of America, v. 93, p. 1703-1729. 12. Sieh, K., Natawidjaja, D., 2000. Neotectonics of the Sumatran fault, Indonesia. J. Geophys. Res. 105, 28295–28326. 13. Well D.L. and Coppersmith (1994), New Empirical Relation Among Magnitude, Rupture Length, Rupture Width, Rupture Area, and Surface Displacement, Bulletin of Seismological Society of America, Vol. 84, No.4, pp. 974-1002. 14. Youngs, R.R. and Coppersmith, K.J., (1985). Implications of Fault Slip Rates and earthquake Recurrence Models to Probabilistic Seismic Hazard Estimates. Bulletin of the Seismological Society of America, Vol. 75, No.4, pp. 939-964.
© 2016 ejge
Editor’s note. This paper may be referred to, in other articles, as: Lalu Makrup: “Variations in Models and Parameters in Probabilistic Seismic Hazard Analysis” Electronic Journal of Geotechnical Engineering, 2016 (21.25), pp 10105-10120. Available at ejge.com.