VDN: Virtual Machine Image Distribution Network for Cloud Data Centers Chunyi Peng
Minkyong Kim, Zhe Zhang, Hui Lei
Computer Science Department University of California, Los Angeles
[email protected]
IBM Watson Research Hawthorne, NY, USA {minkyong, zhezhang, hlei}@us.ibm.com
Abstract—Cloud computing centers face the key challenge of provisioning diverse virtual machine instances in an elastic and scalable manner. To address this challenge, we have performed an analysis of VM instance traces collected at six production data centers during four months. One key finding is that the number of instances created from the same VM image is relatively small at a given time and thus conventional filebased p2p sharing approaches may not be effective. Based on the understanding that different VM image files often have many common chunks of data, we propose a chunk-level Virtual machine image Distribution Network (VDN). Our distribution scheme takes advantage of the hierarchical network topology of data centers to reduce the VM instance provisioning time and also to minimize the overhead of maintaining chunk location information. Evaluation shows that VDN achieves as much as 30–80x speed up for large VM images under heavy traffic.
I. I NTRODUCTION Cloud computing enables users to access compute resources on demand without the burden of owning, managing, and maintaining the resources. To support Infrastructure as a Service (IaaS), most cloud platforms use virtualized data centers. Typically, a cloud data center maintains a catalog that lists available virtual machine (VM) images. Those images may contain only the bare operating system such as Linux Red Hat or Windows, include popular applications such as database management systems, or even be created by users. Data centers typically provision diverse VMs to provide various services, applications and other compute resources. For good system elasticity and scalability, It is critical for the data centers to provision VMs fast, even in case of a large volume of concurrent requests. Unfortunately, today’s cloud data centers often take tens of minutes to provision even a single VM. One source of the problem is the size of VM images, which is typically in the order of gigabytes. Thus, it can take a long time to read a VM image from the disk and transfer it over the network. Another source of the problem is the fact that data centers typically use centralized servers to store and dispense VM images. Such centralized servers and associated network interfaces turn into the performance bottleneck when there are bursty requests from a large population of clients. Prior research adapts BitTorrent-like sharing in data centers [1], [2], which allows VM instances provisioned from the same image file to share the file content among themselves. This approach is effective only if there are a lot of instances
started from a same image. On the other hand, there might be substantial common contents across different VM images in real cloud data centers. BitTorrent-like sharing schemes are not able to take advantage of such cross-file duplication, and thus may miss valuable opportunities for performance enhancement. In this paper, we propose VDN, a new Virtual machine image Distribution Network enabling collaborate sharing in cloud data centers. Our work is motivated by an analysis of VM instance traces collected from six production cloud data centers. We find that the number of instances created from the same VM image is relatively small. However, the aggregated number of instances started from similar images (i.e., images with same operating systems or other software components) is large. Prior studies [3]–[5] have shown that different VM image files often have common chunks of data. Therefore, we believed that it would be feasible and beneficial to allow chunk-level sharing among different images. We also found that most popular instances have short lifetime. It implies that cache should keep the chunks beyond the lifetime of instances to increase availability of common chunks and enable collaborative sharing. Different from the conventional BitTorrent-like paradigms, VDN has two novel features. First, it allows the sharing of image chunks across distinct VM image files. This greatly improves the chance to find chunks at the peers. Second, the distribution network considers the underlying network topology. The topology of VDN is aligned with the structure of the physical network, so that the overhead of state maintenance and data communication is kept low. Our evaluation shows that, compared to using the centralized image server, VDN can achieve as much as 30–80x speedup, especially for those large VM images or when the traffic load is heavy. The speedup is achieved at a low maintenance cost. The rest of the paper is organized as follows. Section II presents our trace study and VM image analysis. Section III describes the VDN design and Section IV presents evaluation. We discuss the related work in Section V, followed by conclusions in Section VI. II. T RACE STUDY AND IMAGE ANALYSIS We perform the trace study and image analysis to motivate the design of image distribution network. Specifically, we
2
Instances(%) #Images
S1 11 125
S2 8 107
S3 23 213
S4 18 200
S5 22 207
S6 18 240
All 100 355
TABLE I VM INSTANCES AND VM IMAGES AT SIX DATA CENTERS
would like to understand the patterns of VM instance provisioning requests in a real cloud environment, the VM image structure and cross-image similarity, and their impacts on VM image provision. These would provide the design insights to our image distribution network. The traces are collected at six IBM operational data centers during four months: March 10 to July 12, 2011. The traces record start and end time of each individual VM instance and its associated VM image ID. Table I lists the number of distinct VM images used at each data center and the percentage of instances. These six data centers are small to medium-scale data centers, where the number of physical machines ranges from several tens to hundreds. At S1 and S2, the number of VM images and that of instances are relatively small. This is because these two data centers have been started recently and may still be in the growing phase. To better understand the design of VM image provisioning, in particular, how to to improve the likelihood of being able to fetch VM images or chunks from peers, we focus on answering following questions: • • • • •
How many instances are created from each VM image? Are some images used repeatedly while the rest are not? Once an instance is started, how long does it last? How many VM instances are running at a given time? What is the arrival rate of VM instance provisioning requests per VM image? How similar are the VM images to each other?
In brief, our findings show that the chance to fetch chunks from peers will increase if a VM image is used frequently and if it shares common chunks with other popular VM images. It also helps if the instances started from the image have a long lifetime. We will elaborate our findings next. A. VM image popularity We first study the distribution of the number of instances created from individual VM images. Figure 1 shows the number of VM instances associated with each distinct VM image. The x-axis shows the VM images sorted by the number of instances in the ascending order. The y-axis shows the cumulative number of instances in percentage. It is clear that the distribution is highly skewed and the skewed distribution is consistent across data centers. A large percentage of instances are started from a few popular VM images. (We refer the images who have many instances created being “popular” images.) For example, 10% of most popular images corresponds to 80–89% of instances. Insight: The fact that a small number of VM images are used to create the majority of instances provides a great opportunity to enable collaborative sharing among different hypervisors to speed up VM provisioning.
B. VM instance lifetime We study the lifetime of VM instances. A long lifetime increases the chance that a new instance is able to fetch the image from those peers running that instance. Figure 2 shows the lifetime of instances in minutes. The median for all instances is 85 minutes. Note that there is a knee in the curve; around 40% has instance lifetime shorter than 13 minutes. We also explore the relationship between the image popularity and and their lifetime. We choose the top 20% of images (Popular) and the bottom 20% (Unpopular) from Figure 1 and plot their lifetime distribution separately. Figure 2 clearly shows that the popular images have much shorter lifetime than unpopular ones. The top 40% short-lived instances are mainly contributed by those popular images. For unpopular images, the median lifetime is about 42 hours. We plot the CDF of instance lifetime in six data centers in Figure 3. The distribution is similar for most data centers except S1 and S2. In S1 and S2, more than 60% of instances have lifetime shorter than 13 minutes. We expect that this is mostly because S1 and S2 are not heavily used as these two data centers are relatively new. The medium lifetime (as well as the 90th percentile) in data centers S1, S2, S3, S4, S5, S6 are 8 min (10 day), 10 min (5 day), 1.5 hr (14 day), 1.5 hr (22 day), 3 hr (21 day), 1.2 hr (33 day), respectively. Insight: Because the lifetime of instances is diverse, it is important for the VM image distribution network to be able to cope with various lifetime patterns, such as the difference between popular and unpopular VM images. C. Concurrent VM instances We also study the pattern of concurrent VM instances. Figure 4 shows the number of live instances sampled at every hour. We ignore the first 10 days (March 10 to March 19) since there are no records for the instances that started before March 10 but were still running after March 10. The values are normalized by dividing each by the maximum value across all data centers. The number of instances are mostly stable in all data centers. All data centers, except S6, show that the number is increasing steadily over time. Figure 5 shows the ratio of the number of live instances to that of live VM images. The ratio ranges from 1 to 7.5. This means that the number of instances started from exactly the same image is small. It implies that P2P such as BitTorrent [1], [2] where the chunks can be fetched from only the peers who have exactly the same files, may not work well because the number of instances started from exactly the same VM image is small. To further understand the sharing possibility from peers with the same VM image instances, we show the example distribution of live instances across all live VM images at one data center (S6) at a specific time (12 AM, May 19, 2011) in Figure 6. The x-axis represents the live VM images, sorted in ascending order by the number of instances. The y-axis represents the number of live instances. The total number of instances at this time was 691. These instances are started using 126 unique VM images, and 89 images (71% of all
3
1
60 40
0.8
0.8
0.6
0.6
Fig. 1.
0.4 Popular Unpopular All
0.2
20 0 0
20 40 60 80 Number of VM images (%)
0 0 10
100
2
S1 S2 S3 S4 S5 S6 All
0.4 0.2 0 0 10
4
10 10 Instance lifetime (min)
Distribution of VM image popularity. Fig. 2. Popular vs. unpopular instance lifetime. Fig. 3. centers
S1
S2
S3
S4
S5
S6
75 50 25 0 Mar 20
Apr 19
May 19
Jun 18
S1
S2
S3
S4
S5
S6
6
4
2
0 Mar 20
Fig. 4. Normalized number of live instances Fig. 5. over time.
2
4
10 10 Instance lifetime (min)
VM instance lifetime in various data
35
8 100
Number of live instances
Normalized # of live instances(%)
CDF
80
#(live instances)/#(live VMs)
Cumulative instances (%)
S1 S2 S3 S4 S5 S6 All
CDF
1
100
30 25 20 15 10 5 0 0
Apr 19
The ratio of
May 19
Jun 18
#live instances #live VMs
20
40 60 80 100 Live VM images (sorted)
120
over time. Fig. 6. Distribution of live instances across live VM images at S6 at 12 AM. 1
images) had less than or equal to 5 instances. Thus, if only the same files can share their chunks, there may be little opportunity to fetch chunks from nearby peers. Insight: The conventional P2P approach may not be efficient in VM image provisioning because the number of instances started from the same VM image is small.
CDF
0.8
E. VM image structure In six data centers, we have the total of 355 unique VM images. Those images can be categorized into a tree structure based on their OS, application variety, versions and formats. Figure 8 shows a part of the image tree at S6 and the structures
S1 S2 S3 S4 S5 S6
0.4 0.2
D. Arrival rate of provisioning requests We now look into the inter-arrival time of instance provisioning requests. Figure 7 shows the CDF of arrival intervals of one popular VM image who is at 98th percentile from each data center. For unpopular images, the numbers of provisioning requests are too small to obtain meaningful interarrival distributions; most of them were used only several times during four months. The median inter-arrival rate ranges from 7 seconds to 4 hours in six data centers. S1 and S2 have the largest inter-arrival time; this is probably because S1 and S2 are not heavily used. and the most VM instances are launched on schedules (the interval is about two hours). S3 and S5 have the smallest inter arrival time (7 seconds and 46 seconds); many instances are requested in the batch mode. Different applications and user activity patterns lead to different arrival rates. We notice that the arrival rates do not confirm to Poisson distribution or other simple distributions. Thus, we use the real traces to drive our evaluation. Insight: The distribution network should work well with various traffic arrival patterns.
0.6
0 −2 10
Fig. 7. center.
0
10
2
4
10 10 Arrival intervals (min)
6
10
CDF of arrival intervals of one popular VM images in each data
are similar at other data centers. The VM images are divided into subtrees based on OS (such as Linux and Windows) and major applications. Each branch is then divided into subtrees, based on providers or versions. For example, Linux has branches depicting Red Hat and SUSE Enterprise and it is further divided into lower-level branches based on the version (e.g. v5.4, v5.5 and v6). Each leaf represents the actual VM image file. This categorization provides the basis for understanding how VM images are constructed and how similar they are. Most VM images are first constructed using a base image with OS and the patches can be applied or applications can be installed. After installation, a new VM images is created and added to the image library. Because much of files are shared among VM images that started from the same base image, we would find high similarity among them. Satyanarayanan et al. [6] has also shown that if a set of images is based on the same major version of operating system (e.g., Linux Red Hat 5.X), the similarity is high (more than 50%). Insight: The tree
4
Linux
Windows
(60%)
…
… …
(0.04%) (0.2%) (4%) (18.7%) (26.6%)
V7.0 P (0 V7.0.0 .1%) .11 V7.0.0 S D (0.2%) .11 V7.0.0 R B (0.3% ) .1 1 S B (0.3% V 7 .0 .0 ) .11 V7.0 B S P (0.7% ) (0.7% )
Linux v6 .0 (32 b it) Lin …ux v5.6 (32bit ) Linux v5 .4 (32bit ) Lin u x v 5 .5 Linux v5 (64bit) .5 (32bit )
Fig. 8.
Web app. server (2.4%)
Misc (4%)
……
(7%)
Services (11%)
...... Live Service Manager(1.2%) IDE (1.3%) Database (1.3%)
SUSE
(53%)
……
Red Hat
(25%)
The VM instance portions along VM image tree in S6.
structure implies the similarity between VM images. F. VM image similarity For data centers S1–S6, which we have collected the VM instance traces, we do not have access to actual VM image files. Therefore, we have collected real VM images (525 in total) from another production data center and conducted an empirical study of VM image similarity [5]. These VM images reflect a snapshot of the image repository and we expect that the overall results of image similarity should be similar to our environment. We explored different chunk schemes, such as fixed-size or variable-size chunks for cross-image similarity. We studied the pairwise similarity between any two VM images as well as the duplication factor, defined as the the number of VM image files containing a specific chunk. It turns out there exists a large number of common chunks among various VM images. For example, 12.2% of chunks are common to 2 images for the fixed-size chunking schemes, and the median of pairwise similarity for 4KB fixed-size chunking can reach 48%. These results are also consistent to the findings in other chunk-level file similarity studies [3], [4], [7]. Insight: The high similarity among images provides a great opportunity to enable cross-image content sharing. G. Popular and unpopular VM images We further explore the instances for the popular and unpopular VM images. For a given image tree (e.g. S6 in Figure 8), we find that some images are popular while the rest are extremely unpopular (less than 1% of all instances.) Figure 8 shows the percentage of instances for each VM image at S6. Linux contributes to majority of instances (60%), followed by Windows (25%) and Services (11%). Among Linux, Red Hat contributes to 53%. If we look into different versions of Red Hat, we find that v5.5 32 bit and 64 bit versions are popular while the other versions are unpopular. By allowing chunklevel sharing among Red Hat images of different versions, even the unpopular Red Hat images can get much of their data from peers who have popular Red Hat versions. In contrast to VM images where only the OS is installed, the VM images with a particular application is usually unpopular, meaning that only a few instances are created from a exactly the same image. For example, the branch with “Services” (those VM images with applications installed) in Figure 8. However, if we consider the cluster of images (those in the same subtree), the number of instances becomes substantial. In
other words, by allowing chunk-level sharing among different VM images, there still exists a large opportunity to fetch much of data from peers who have similar images. Insight: Chunk-level sharing may benefit the instances started from both popular and unpopular VM images. III. VDN D ESIGN In designing the VM image distribution framework, our primary objective is to maximize the amount of VM image data that is available locally or on nearby peers when the image is needed. Being able to fetch image file from nearby peers will reduce heavy I/O at the image server and network traffic for transferring image file and thus make VM provisioning faster. In the rest of this section, we present key components of our design. A. Chunk-based content distribution The distribution of VM image data should be based on the unit of chunks, instead of entire VM image files. The reason is twofold. First, as discussed in Section II, VM image files show high similarities. This implies that multiple VM instances can share data even when they are using two different (but similar) images. Second, a VM instance can start without fetching the entire image file. For example, in virtualization mechanisms such as QEMU QCOW2 [8] and FVD [9], only a small portion of VM image data is transferred to the host to start a VM instance, and the remaining image data is transferred on demands. It also makes VM provisioning fast and improves the runtime performance. In our design, each VM image file can be divided into either fixed or variable-size chunks. Each chunk is identified by hashing its content using a hash function such as SHA-1. In this way, identical chunks from multiple VM images can be found easily. In the rare case where different chunks are mapped to the same hash value, hash collision techniques can be applied [10]. The method to divide VM images into chunks, or chunking method, is a separate research topic orthogonal to our study. In fact, the VDN framework can work with different chunking schemes, including fixed-size chunking, Rabin fingerprinting [11], and the Mirage scheme [3], where each file within the file system of an individual VM image denotes one chunk. The file-based approaches, often used in P2P media content distribution, allow sharing among the instances of a same file. Compared to these file-based approaches, our chunkbased scheme is much more flexible and efficient. First, in our scheme individual chunks can be transferred on demand with low cost. Second, by de-duplicating chunks with the same content, our scheme significantly saves storage space. At each host, we only keep one copy of a chunk at the shared cache, even when multiple VM instances are using it. Finally, when a host runs out of storage space, we can evict “cold” chunks and keep all “hot” chunks, instead of evicting the entire image at a time. This will enhance local data availability.
5
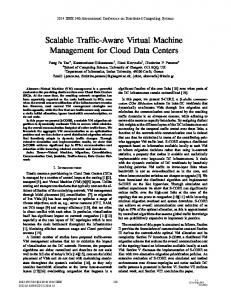
B. Host-level cache In our VDN framework, each physical host maintains a cache in its locally attached storage to hold chunks of VM image files. This host-level cache resides in the hypervisor software module (such as KVM) so its content is exposed to all VM instances running on the host. Therefore, when a new VM instance is started, it can leverage VM image chunks already available in the local cache instead of having to fetch the entire image from the central image server. Moreover, having a cache on the host level facilitates data sharing among peer hosts in the data center. The simplest cache replacement is to correlate the lifetime of image chunks with the VM instances that use them. In other words, a chunk is evicted as soon as no running VM instance is using it. This method (referred as live cache) allows the image data sharing among multiple active VM instances. The downside of this scheme is that new VM instances cannot make use of the chunks from those instances that have been terminated. Our measurement in Section II shows that instances may be short-lived. Therefore, our VDN framework adopts an improved cache management scheme (referred as fixed cache), where a fixed size of storage is used and the cached chunk does not get evicted even when all the instances using it have been terminated; it gets evicted when the cache is full. This scheme enables the reuse of VM instances started at different time. For simplicity, the cache is managed in First-in, First-out (FIFO) fashion. However, other cache management policies, such as Least Recently Used (LRU) and other greedy strategies [12], which complement our VDN work, are still applicable but are beyond the scope of this paper. C. Efficient collaborative sharing Because individual VM images are big and the total number of images can also be very large, it is practically impossible for a cloud system to store all VM images in the local cache of every node. Having centralized image servers to serve all the request also do not scale well as they easily become the bottleneck. Thus, it is essential to build a collaborative mechanism to allow sharing of image data among peers. It has significant advantages over the scheme of using a centralized image server or merely relying on local caches. In the collaborative sharing of locally stored VM image data, one key factor affecting the performance and efficiency is metadata management. The metadata consists of the list of hosts who have the chunks. When a chunk of data is missing from a host’s local cache, the host should be able to quickly find a peer with the required data (i.e., lookup ). When a new chunk enters a host’s local cache or the local cache evicts a chunk, all other hosts should get the latest information when they query (i.e., publish). To better motivate our design, we first describe the typical network topology of data centers. The current data centers, especially the commercial ones, typically employ a hierarchical network topology, such as a tree [13] or fat-tree [14] structure. As shown in Figure 9(a), physical hosts within the same rack
(a) Hierarchical data center network Fig. 9.
(b) Hierarchical index nodes
Illustration of VDN-topo index node formulation.
are connected by top-of-rack switches and form the bottom of the hierarchy. Then, the hosts from different racks are connected through another level of switches (e.g., aggregate switches). Finally, they connect with the higher-level switches or the root switches and form a complete data center network. Based on the study of over-subscription tree structures [14], the available bandwidth decreases as the link level increases. It means that the hosts within the same rack can transfer data at a higher speed than the ones at different racks via higher-level switches. Our key technique is to exploit data center network topology and cross-image similarity to design VDN metadata management. In the following, we elaborate three collaborative sharing schemes: VDN-naive, VDN-flat and VDN-topo. 1) VDN-naive: A straightforward (but naive) scheme is for each host to maintain the metadata of its locally cached data. When the requested chunk is not found locally, a lookup query is broadcasted first within a rack, and then goes upward in the network hierarchy until the chunk is located. The advantage of this scheme is simplicity as no metadata management nodes are needed. In specific, cache updates (publish) have negligible overhead; when a local cache accepts or evicts a chunk, it does not need to update any other nodes. This scheme works well if the majority of required data is available locally or in the same rack. However, if data locality is poor, many queries will be broadcasted to a large number of hosts, leading to heavy network traffic and high lookup latency. This can be a severe problem in large scale data centers. 2) VDN-flat: An alternative design option that mitigates the inefficiency of data queries in VDN-naive is to use a distributed hash table (DHT) for metadata management. Using the hash (e.g., consistent hashing [15]) of a chunk as the key, we can locate the node who has the corresponding metadata. It is simple to implement lookup and publish operations and to handle node joining and leaving events. This design is similar to other P2P practices [1], [2], except that we enable chunk-level sharing. However, the downside is that it does not fully explore the underlying network topology. Thus, the performance may not be ideal. When a host chooses a peer to download a chunk from, it will prefer the closest one to speed up data transmission. Therefore, the host may not need the entire list of all the nodes who has that chunk. However, VDN-flat requires each node to be responsible to keep track of the entire list, which may introduce unnecessary traffic. 3) VDN-topo: We present a new scheme, called VDN-topo, which fully utilizes the underlying network structure of data
6
centers. VDN-topo uses index nodes to manage metadata. The key idea is to organize index nodes following the hierarchical structure, which aligns with the underlying network topology. The red and blue circles in Figure 9 illustrate how hierarchical index nodes are constructed. Each index node is responsible for a physical domain, for example, one rack (here, L1 ) or the cluster that connects with the same aggregation switch(here, L2 ). The lowest level (L1 ) index nodes store chunk location information in a chunk-at-host table (called CAHT). The higher level index nodes store the information (1) whether its subtree has this chunk and (2) the actual index node who has that metadata. At least one index node is needed for each hierarchical physical domain and multiple redundant index nodes can be used for system reliability. Since data center topology is known in advance, the physical domains and their corresponding index nodes can be pre-defined or adjusted dynamically. VDN-topo implements lookup and publish operations in a similar manner as VDN-flat. The difference is that the communication domain is mainly determined by the data center topology, while it is based on the hash key (determined by chunk ID) in VDN-flat. For lookup, the host may send the lookup request to its lowest level index node (here, L1 ); the index node responds directly if it hits in CAHT. Otherwise, the index node communicates with the higher level index node (L2 ) to fetch metadata until reaching the highest level index nodes. For publish, the host sends an update message to its lowest level index node and then the index node may update its CAHT. It aggregates the update messages with the current CAHT, and sends one update to the higher level only if the aggregation information has changed. As an example, we assume there are two hosts a and b that have chunk c. Once host a sends an update to notify the index node that chunk c expires, the index node may remove host a from its own CAHT but it will not update at the higher level since the whole cluster still has this chunk. During the procedure, the lowest index nodes acts like an agent in DNS systems. Such design increases the portion of local communication, which is usually faster and has less contention. Another benefit of VDNtopo is that it is not necessary to acquire the global knowledge of hosts who have chunks. Instead, the local host information is sufficient. Consequently, the topology-aware design reduces the number of CAHT entries, as well as the overhead of global metadata management, without decreasing collaborative sharing opportunities. There are several optimizations. The first is to build a cache of the CAHT at hosts or index nodes when it passes. It can save the number of lookup messages and we can maintain these cache in a soft-state way. The second is to aggregate chunk-based operations. The message can contain a list of chunk IDs and save many operations into a single one. In VDN-topo, these operations ( lookup and publish) follow the same topology and one message is sufficient (e.g., the hosts sends one lookup message for all the needed chunks to L1 index nodes). While in VDN-flat, hashes of those chunks may be different and multiple messages have to go through different
paths to different destinations even though the message contain a list of chunk IDs in a batch mode. D. VDN-friendly placement Another way to improve the locality of VM image data is to coordinate the VM placement with VDN. When the cloud manager (front end) receives a request from a user to provision a new VM instance with a specified image, it can query VDN first to locate a host whose cache contains the largest amount of the image data. This data locality can be one factor in making the placement decision and needs to be considered together with other factors, including current load and communication pattern. It is referred to as VDNfriendly placement scheme. Note that the VDN framework is compatible with other placement strategies such as random (where VM instances are allocated to hosts at random) or min-loaded (where the hosts with lower loads are preferred) schemes. VM placement is an independent and hot topic and it is discussed in many prior studies such as [16]. IV. E VALUATION To evaluate VDN, we have developed a simulator in MATLAB 7 and conducted simulation studies driven by real traces. We compare VDN scheme with two approaches that do not perform collaborative sharing. The first is called baseline where each host only fetches VM image chunks from the central image server. The second is called local, where each host uses host-level cache. We also study the performance of three VDN variants: VDN-topo, VDN-naive and VDN-flat. We use provision time and management overhead as performance metrics. The provision time is defined as the time that the data center takes to dispense the needed VM image data upon receiving a user request. Note that we only consider the transfer time in the provisioning process since it is our design focus. To compare different provisioning schemes, we define s , where tb is the provision the speedup factor as α(s) = tbt−t s time using baseline and ts is the one using scheme s. The VDN overhead is measured by the number of extra messages and communication cost for them. The basic setting is as follows. We use one month (May 1 to May 31) trace of instance requests to drive our simulation. Each VM image file is composed of fixed-size chunks and the default chunk size is 4 MB. The total size of VM image can vary from 128 MB to 8 GB 1 . The cross-file similarity values are set according to our measurement in [5]. We use a three-level tree topology data center [13]. Considering the traces are collected from small and medium-size data centers, we use a 4×4×8 tree topology with 128 hosts. In specific, the root switch (at L1 level) connects four L2 aggregate switches and each L2 switch connects four racks, each consisting of 8 nodes. We assign 200 Mbps, 500 Mbps and 2 Gbps for L1 , L2 , and L3 (within the same rack) links, respectively. We assume that the total bandwidth from any host to the image 1 In case an VM instance can start without gathering a complete VM image, the size of VM image in the evaluation means the one of those mandatory image data to launch a VM instance.
7
S1 50th 8.2 4.8 0.26 30.2×
Baseline (s) Local (s) VDN (s) Speedup(×)
S2 50th 8.3 4.3 0.25 32.0×
90th 9.7 8.3 3.4 1.9×
90th 9.3 8.3 3.3 1.8×
S3 50th 8.4 5.1 0.28 29.4×
S4 90th 24.8 8.8 3.4 6.3×
50th 8.5 5.5 0.33 24.7×
90th 62.9 8.9 4.1 14.3×
S5 50th 8.3 5.5 0.32 24.9×
S6 90th 22.4 9.1 3.8 4.8×
50th 8.4 5.4 0.28 29.3×
90th 46.6 8.9 3.5 12.5×
TABLE II P ROVISION TIME FOR 512 MB VM IMAGES IN SIX DATA CENTERS
S1 50th 66 46.4 2.4 26.4×
Baseline (s) Local (s) VDN (s) Speedup(×)
90th 185 68 33 4.6×
S2 50th 66 43.5 2.4 26.4×
S3 90th 149 66.8 29 4.1×
50th 174 49.5 2.5 69.6×
S4 90th 1055 148.2 118.6 7.9×
50th 213 53.7 2.8 75.9×
S5 90th 1174 177.4 78.8 24.8×
50th 187 55.6 2.8 65.2×
90th 1345 160.9 94.9 13.2 ×
S6 50th 206 50.0 2.5 81.6×
90th 3620 270.8 81 43.7×
100
Baseline
Local
VDN
Provision time (s)
Provision time (s)
TABLE III P ROVISION TIME FOR 4 GB VM IMAGES IN SIX DATA CENTERS
10 1 0.1 0.01 128MB
512MB VM image size
(a) S1
4GB
1000 100 10 1 0.1 0.01
Baseline
128MB
Local
VDN
512MB VM image size
4GB
(b) S6
Fig. 10. Provision time for VM instances over time using baseline, local, VDN in data centers S1 and S6.
server is 1 Gbps. We assign relatively high bandwidth for these image servers since they are usually well configured with more powerful disk and network. We use a FIFO queue to emulate how its available bandwidth decreases as more requests arrive and cause congestion and delay. A. Provision time We first compare the provision time using baseline, local and VDN. Because all the VDN variants have similar provision time, by default we only present VDN-topo. The benchmark setting is as follows. For the VM instance placement, we randomly allocate instances among the eligible hosts up to five instances at each host. We repeated simulation, while varying the size of VM image: 128 MB, 512 MB and 4 GB. We used a fixed-size cache, whose the size is twice the VM image. We assume that no VM chunks are available at any host in the beginning of each simulation. Table II and III show the provisioning time and VDN speedup factors for 512MB and 4GB VM images in six data centers. Figure 10 plot the 50th (median) and 90th percentile of provision time at two example data centers, S1 and S6, when the image file is 128 MB, 512 MB and 4 GB, respectively. The black lines depict the 90th percentile. We do not plot the 10th percentile because it is close to zero in all cases. We make four observations. First, VDN performs best and the performance gain is significant. For example, at S6 in Figure 10(b), the median provision time for a 4 GB VM image decreases from 3.4 minutes to about 2.5 s and in the worse case (90th percentile), it can reduce from about 1 hour to 1.5 minute. Table II and III show that the speedup factor can reach as much as 30x for 512 MB images and 60–80x at S3–
S6 for 4 GB images. It demonstrates that VDN can largely increase the provision efficiency. Second, local availability and collaborative sharing are major contributing factors to the performance gain. The benefit from local availability is clearly seen by comparing local and baseline, while the benefits created by collaborative sharing can be observed by the comparison of VDN and local. When the chunk availability at a single host is high, the gain from local is significant. For example, the provision time decreases from 206 s to 50 s at S6 in Figure 10(b). It contributes to up to 3x speedup. The local availability is determined by request patterns, placement and cache mechanism. We will explore their effects in details next. We also observe that collaborative sharing plays a more important role even when local availability is not high. Take an example of case (a) at S1. Although the speedup from baseline to local is limited (about 0.5x), the improvement caused by collaborative sharing is still huge (about 26x). It demonstrates that VDN enhances the benefits of host-level cache at each peer by aggregating them via collaborative sharing so that the performance gain still grows dramatically even as the local availability increases only by little. Third, the performance improvement are applicable to most VM instances. When the provision time for the 90th percentile instance is considered, the speedup factors are still high. For example, it can reach 5-15x for 512 MB files and 10– 40x for 4 GB files at S3–S6. Although the 90th percentile speedup factor may reduce a little bit, the absolute provision acceleration is more significant (e.g. one hour faster for 4 GB image at S6). Fourth, provision performance varies under different factors. It varies across data centers. S1 and S2 had not much performance improvement, because the number of live instances is small and their lifetime is short. From now on, we use S1 and S6 as our example data centers. We also notice that the improvement in small files is smaller. It is because the bandwidth to and from the image server is higher than that between two arbitrary hosts, fetching from peers can take longer than doing so from the image servers, especially when the load at the image servers is light; in our simulation, we
0
S1
S2
S3
S4
S5
S6
(a) # of messages
4 2 0
Baseline(s) VDN(s) Speedup
100 10 1 1
S1
S2
S3
S4
S5
2 GB 522.4 17.2 29.3×
4 GB 3620 80.1 44.2×
8 GB 29489 433 67.1×
TABLE IV P ROVISION TIME FOR VM IMAGES WITH VARIOUS SIZES
set the achievable bandwidth from the image server to 1 Gbps, while the one to the remote host is 200 Mbps.
C. Scalability To test the scalability of VDN, we adopt three measures to adjust the incoming traffic loads and the system serving capability. The first measure is to stress our system by adjusting the time granularity of real traces. The shorter inter arrival rates are, the heavier traffic loads are. Note that we do not change the sequence of instance requests. The second measure is to construct different sizes of VM images (from 128 MB to 8 GB) using the same traffic pattern as real traces. The third one is to reduce the available network bandwidth by a factor of 15 (referred as “lowBW”). It corresponds to raising heavy requests for data centers. Figure 12 shows the provision time to launch 4 GB VM images using three schemes at S1 and S6. It shows that VDN is scalable even when the requests are increased by multiple times. VDN works even better with heavier requests and lower
Baseline Local VDN
1000 100 10 1 1
60
1000 100 10 1 1
5
10 20 Time factor
1000
10 1 1
10 5
10 20 Time factor
60
10000 1000 100 10 1 1
(e) S6, 50th(median), lowBW
Provision time (s)
Fig. 12.
10 20 Time factor
60
Baseline Local VDN
5
10 20 Time factor
60
(f) S6, 90th, lowBW
Provision time under varying traffic loads and network bandwidth Baseline live cache cache = 1x cache=2x
10
1
0.1
5
(d) S6, 90th
100
1 1
60
100
60
Baseline Local VDN
1000
10 20 Time factor
Baseline Local VDN
10000
(c) S6, 50th(median) 10000
5
(b) S1, 90th
Baseline Local VDN
10000
B. Management overhead We compare the overhead of different metadata management schemes. Figure 11(a) shows the number of control messages sent out to maintain metadata. We find that the number of messages is much smaller for VDN-topo and VDN-flat than for VDN-naive. This is mainly because VDN-naive needs to broadcast the messages requesting the metadata. VDN-topo has even smaller number of messages than VDN-flat because the most messages do not traverse more than one level of the tree. Figure 11(b) shows the communication cost for metadata management. It is shown in [16] that the cost to deliver a message along different paths should be distinct and that the communication cost for closer peers is smaller. We assume the cost values corresponding to different levels are inversely proportional to the available bandwidth. That is to say, the cost ratio within the root switch(L1 ), the same aggregation switch(L2 ), and the rack(L3 ) is 10 : 4 : 1. Because VDN-naive does not maintain meta-data, the communication cost is lowest among the three. In VDN-topo, communication is mostly within the rack and thus it has a much lower communication cost than that of VDN-flat.
10 20 Time factor
10000
(a) S1, 50th(median)
(b) Communication cost
512 MB 46.6 3.5 12.3×
5
S6
Fig. 11. Management cost using VDN-topo, VDN-flat, VDN-naive in six data centers.
128 MB 6.9 0.6 10.5×
Baseline Local VDN
1000
Provision time (s)
200
6
10000
Provision time (s)
400
naive
Provision time (s)
600
flat
8
Random
Min loaded VDN−friendly
(a) 512 MB
Provision time (s)
800
topo
10
Provision time (s)
naive
Provision time (s)
flat
Provision time (s)
topo
1000
Communication Cost
Number of messages
8
Baseline live cache cache = 1x cache=2x
1000 100 10 1
Random
Min loaded VDN−friendly
(b) 4 GB
Fig. 13. Provision time under various placement and caching schemes at S6.
bandwidth (see Figure 12(a), 12(c), 12(e)). This is because more chunks are available locally and from nearby peers. We also notice that the median performance is less sensitive to heavy traffic than the 90th percentile performance. It turns out that the VM image popularity contributes to it. Most VM instances come from a few popular VM images and the provision performance can be guaranteed with simple cache and peer sharing. The performance for the 90th percentile instance shows that VDN still works well even with those unpopular images. Table IV shows the 90th provision time to fetch variable size VM images using VDN at S6. Due to space limitation, we omit many other results since the median performance is better and the conclusion is similar at other data centers as shown before. As expected, VDN performs better as the distribution volume increases, compared with other distribution schemes. The issue is that the image server tends to be the bottleneck when dealing with a large-size VM image provisioning in a centralized way. It shows that VDN can contribute to a more scalable VM provisioning where the provisioning time grows much slower (almost linearly) in regards of the VM size. D. Design components We studied the impacts of design options on local cache management and VM instance placement. Figure 13 shows the median and 90th percentile of provision time using different placement policies (random, min-loaded and VDN-friendly)
9
and cache options (live and fixed with different cache sizes) at data center S6. First, using host-level cache provides significant performance improvement. Performance improves further with a larger cache (cache=2x). The cache is more crucial to the 90th percentile performance because it yields higher availability (locally or from close peers) for those less popular VM images. Second, with VDN-friendly placement, we see that the provisioning time is extremely small; different caching mechanisms play a less important role. V. R ELATED W ORK In cloud computing, fast provisioning of VM instances has significant impacts on the overall system performance and elasticity. Therefore, many efforts have been made on this topic [1], [2], [17]–[22]. These solutions can be divided into two categories based on their focuses. The first group takes a network-driven approach to speed up the VM image distribution, including our VDN. [1], [20] introduce P2P techniques for VM provisioning. By treating an entire VM image file as a BitTorrent seed file, it disables the delivery of chunks of image data, which is essential for starting VM instances on partial images. Their work also ignores the topology of data center network. A recent study revises the BitTorrent protocol for data delivery in data centers [2]. However, it does not consider VM provisioning requirements. [21] proposes a solution to reduce the retrieval latency for data centers with a two-tier network topology ignoring different network connections among edge nodes. [22] investigates the VM image distribution among multiple data centers. Different from them, our VDN framework yields a more efficient sharing mechanism via utilizing common chunks in different VM images and high network bandwidth between close hosts which is common in any hierarchical data centers. The second category focuses on non-network efforts. For example, the Twinkle system reduces VM transfer volume to speed up the initialization of VM instances using demand predication and partial page launch [17]. Iceberg applies VM image streaming to reduce the initial latency of VM provisioning [19]. It also enables duplicate chunk sharing but it does not adopts a topology-aware metadata management. [18] minimizes VM provisioning time via the optimization of staging schedules. It mainly works on data placement on centralized storage servers, without considering caching image data on compute nodes. The chunking, content caching and source selection policies (e.g., [3], [12], [16]) are orthogonal to our study and can complement the VDN framework. VI. C ONCLUSION Cloud computing centers face the key challenge of provisioning diverse virtual machine instances in an elastic and scalable manner. To better understand the provisioning problem and develop a new solution, we analyzed real VM images and VM instance traces collected at six data centers. We found that the conventional P2P sharing may not be applicable since the number of same VM instances is not big. Motivated by our findings of the trace analysis, we developed VDN, a new
VM image distribution network on the top of chunk-level, topology-aware collaborative sharing. Our evaluation shows that, compared with the centralized approach, VDN achieves as much as 30x-80x speedup, especially for the large VM images under heavy traffic. Acknowledgments: We would like to thank our colleagues who have helped us: Han Chen, K. R. Jayaram, Xiaoqiao Meng, Chang-Shing Perng, Jian Tan, and Norbert Vogl. We are also grateful to Prof. Songwu Lu for his strong support and many fruitful discussions. We also thank all the reviewers for their insightful comments and valuable suggestions. R EFERENCES [1] Z. Chen, Y. Zhao, X. Miao, Y. Chen, and Q. Wang, “Rapid provisioning of cloud infrastructure leveraging peer-to-peer networks,” in ICDCS Workshops, 2009. [2] M. Chowdhury, M. Zaharia, J. Ma, M. I. Jordan, and I. Stoica, “Managing data transfers in computer clusters with orchestra,” in SIGCOMM, 2011. [3] D. Reimer, A. Thomas, G. Ammons, T. Mummert, B. Alpern, and V. Bala, “Opening black boxes: using semantic information to combat virtual machine image sprawl,” in VEE, 2008. [4] K. Jin and E. L. Miller, “The effectiveness of deduplication on virtual machine disk images,” in SYSTOR, May 2009. [5] K. R. Jayaram, C. Peng, Z. Zhang, M. Kim, H. Chen, and H. Lei, “An empirical analysis of similarity in virtual machine images,” in Middleware, Dec 2011. [6] M. Satyanarayanan, W. Richter, G. Ammons, J. Harkes, and A. Goode, “The case for content search of vm clouds,” in COMPSACW, 2010. [7] K. Tangwongsan, H. Pucha, D. G. Andersen, and M. Kaminsky, “Efficient similarity estimation for systems exploiting data redundancy,” in INFOCOM, 2010. [8] M. McLoughlin, “The qcow2 image format,” http://people.gnome.org/ markmc/qcow-image-format.html. [9] C. Tang, “FVD: A high-performance virtual machine image format for cloud,” in USENIX ATC’11, 2011. [10] X. Wang, Y. L. Yin, and H. Yu, “Finding collisions in the full sha-1,” in CRYPTO’05, 2005. [11] M. O. Rabin, “Fingerprinting by random polynomials,” Center for Research in Computing Technology, Harvard University, Technical Report TR-15-81, 1981. [12] S. Borst, V. Gupta, and A. Walid, “Distributed caching algorithms for content distribution networks,” in INFOCOM, 2010. [13] Juniper, “Cloud-ready data center reference architecture,” http://www.juniper.net/us/en/local/pdf/reference-architectures/8030001en.pdf. [14] M. Al-Fares, A. Loukissas, and A. Vahdat, “A scalable, commodity data center network architecture,” in SIGCOMM, 2008. [15] D. Karger, E. Lehman, T. Leighton, R. Panigrahy, M. Levine, and D. Lewin, “Consistent hashing and random trees: distributed caching protocols for relieving hot spots on the world wide web,” in STOC, 1997. [16] X. Meng, V. Pappas, and L. Zhang, “Improving the scalability of data center networks with traffic-aware virtual machine placement,” in INFOCOM, 2010. [17] J. Zhu, Z. Jiang, and Z. Xiao, “Twinkle: A fast resource provisioning mechanism for internet services,” in INFOCOM, 2011. [18] A. Epstein, D. H. Lorenz, E. Silvera, and I. Shapira, “Virtual appliance content distribution for a global infrastructure cloud service,” in INFOCOM, 2010. [19] L. Shi, M. Banikazemi, and Q. B. Wang, “Iceberg: An image streamer for space and time efficient provisioning of virtual machines,” in International Conference on Parallel Processing - Workshops, 2008. [20] R. Wartel, T. Cass, B. Moreira, E. Roche, M. Guijarro, S. Goasguen, and U. Schwickerath, “Image distribution mechanisms in large scale cloud providers,” in CLOUDCOM, 2010. [21] M. Bj¨orkqvist, L. Y. Chen, M. Vukolic, and X. Zhang, “Minimizing retrieval latency for content cloud,” in INFOCOM, 2011. [22] M. Schmidt, N. Fallenbeck, M. Smith, and B. Freisleben, “Efficient distribution of virtual machines for cloud computing,” in PDP, 2010.