Chrompet, Chennai-600 044. B. Vijaya ... corporate environment of the industries, the importance of the ... So, standard software was developed in a suitable.
International Journal of Computer Applications (0975 – 8887) Volume 5– No.9, August 2010
Vendor Evaluation Using Multi Criteria Decision Making Technique C. Elanchezhian
B. Vijaya Ramnath
Dr. R. Kesavan
Research Scholar, Dept. of Production Technology, M.I.T.Campus, Anna University, Chrompet, Chennai-600 044.
Research Scholar, Dept. of Production Technology, M.I.T.Campus, Anna University, Chrompet, Chennai-600 044.
Asst.Professor, Dept. of Production Technology, M.I.T.Campus, Anna University, Chrompet, Chennai-600 044.
ABSTRACT A supply chain is a network of departments, which is involved in the manufacture of a product from the procurement of raw materials to the distribution of the final products to the customer. The term supply chain is already invoked effervescence among the managerial community. The purchasing function has gained importance in the supply chain management due to factors such as globalization, increased value addition in supply and accelerated technology change. A key and perhaps the most important process of the purchasing function is the efficient selection of suppliers, because it brings significant savings for the organization. In general, the supplier selection criteria most commonly used by the industries are quality, delivery and price. Also, depending on the corporate environment of the industries, the importance of the performance measure can vary. In this work a versatile technique namely multi criteria decision making (MCDM) technique which involves the analytical network process (ANP) and technique for order performance by similarity to idea solution (TOPSIS) method has been used to select the best vendor. Analytical Network Process and TOPSIS method are powerful decision making processes which help people to set priorities on parameters that are to be considered by reducing complex decision to a series of one-to-one comparisons, thereby synthesizing the result When any vendor for a particular item make changes for the parameters like price, quality etc to improve his performance or has improved abilities in managing supply chain by providing better delivery to his customer, the whole hierarchy process for arriving the ranking of vendors is to be performed again for finding out the best vendor. Now it is felt that a standard automated procedure which could perform the above processing task is essential. So, standard software was developed in a suitable platform such as VB, .NET and MS access that could meet the current requirement. This package can be executed several numbers of times with changing input parameters values thus serving the purpose.
1. INTRODUCTION Traditionally organization have been divided into operative functions such as marketing, planning, purchasing, finance etc. supply chain is a strategy that integrates these functions creating a general plan for organization which satisfies the service policy, maintaining the lowest possible cost level due to the incredible competitive environment that they are exposed to. A supply chain is a network of departments, which is involved in the
manufacturing of a product from the procurement of raw materials to the distribution of the final product to the customer. The purchasing function has gained greater importance in the supply chain management due to factors such as globalization, increased value addition in supply, and accelerated technological change. Purchasing involves buying the raw materials, supplies and components for the organization. The activities associated with it include selecting and qualifying suppliers, rating supplier performance, negotiating contracts, comparing price, quality and service, sourcing goods and service, time purchases, selling terms of sale, evaluating the value received, predicting price, service and sometimes demand changes, specifying the form in which goods are to be received etc. A key and perhaps the most important process of the purchasing function is the efficient selection of suppliers, because it brings significant saving for the organization. The objective of the supplier selection process is to reduce risk and maximize the total value for the buyer, and it involves considering a series of strategic variables. Some authors have identified several criteria for supplier selection, such as the net price, quality, delivery, historical supplier performance, capacity, communication systems; service an geographic location among others. These criteria are a key issue in the supplier assessment process since it measures the performance of the suppliers.
2. LITERATURE SURVEY Satu Peltola et al(2002) emphasized the use of Analytical Hierarchy Process(AHP) and integrated Support System(GSS) method for improving the business performance in every sector. In this paper, the performance of buyer-supplier relationship will be enhanced by using a benchmarking method in aiding the identification and implementation of development actions required for reaching the world-class level. The benchmarking process will be led by two decision support systems namely AHP and GSS, to ensure valuable outcomes of the benchmarking with fewer resources Jiann Liang Yang et al(2008) proposed an integrated fuzzy multiple criteria decision making(MCDM) techniques for solving vendor selection problem, Jiann utilize triangular fuzzy number to express the subjective preference of evaluators with respect to the considered criteria Banar et al(2006) used analytical network process(ANP), one of the multi-criteria decision making (MCDM) tools to choose one of the four alternative landfill sites for the city of Eskisehir, Turkey. For this purpose super decision software has been used 4
International Journal of Computer Applications (0975 – 8887) Volume 5– No.9, August 2010 and benefit opportunity cost and risk(BOCR) analysis has been done to apply ANP. Cevriye Gencer and Didem Gurpinar(2007) used Analytical Network Process(ANP) for selecting suppliers in an electronic industry . suppliers selection, which is the first step of the activities in the product realization process starting from the purchasing of raw material till the end of delivering the products, is evaluated as a critical factor for the companies desiring to be successful in today’s competitive condition. With the scope of this paper, suppliers selection was considered as a multi criteria decision problem. Hsu Shih et al(2006) used an extension of TOPSIS( Technique for Order Performance by Similarity to Ideal Solution), a multiattribute decision making(MADM) technique, to a group decision environment. TOPSIS is a practical and useful technique for ranking and selection of a number of externally determined alternatives through distant measures.
2. 3. 4. 5.
Purchasing manager Quality manager Product manager Production manager
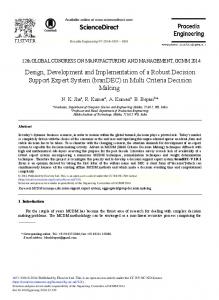
4. PROPOSED METHODOLOGY 4.1 Steps involved in the Proposed Model The selection process has been modified to a five-step hybrid procedure, as follows Step 1: Step 2: Step 3: Step 4: Step 5:
Identification of necessary criteria for vendor selection Recognition of the independence between criteria Calculating the weights of criteria Evaluation of vendors Negotiation for the purchase
Ching Torng Lin et al(2006) developed a fuzzy agility index(FAI) based on agility providers using fuzzy logic. To achieve a competitive edge in the rapidly changing business environment, companies must align with suppliers and customers to streamline operation, as well as working together to achieve a level of agility beyond individual companies. To illustrate the efficacy of the method, the study also evaluates the supply chain agility of a Taiwanese company. Desheng Wu et al(2008) considered three types of risk evaluation models within supply chain such as chance constrained programming(CCP), data envelopment analysis(DEA), and multiobjective programming(MOP) models. Various risks are modeled in the form of probability and simulation of specific probability distribution in risk-embedded attributed is conducted in these three types of risk evaluation models Filip Roodhooft and Jozef Konings(1996) proposed an activity based costing approach for vendor selection and evaluation. This system allows us to compute total costs caused by a supplier in a firm’s production process, thereby increasing the objectivity in the selection process.
3. MEASURING SUPPLIER PERFORMANCE Need for measuring supplier performance Supplier performance has to be measured occasionally for the following reasons 1. 2. 3. 4. 5. 6.
To increase performance visibility To uncover and remove hidden waste and cost drivers in the supply chain To leverage the supply base To align customer and supplier business practices To mitigate risk To improve supplier performance
THE DECISION MAKING TEAM The decision making team comprises of the following members 1.
Purchasing director
Figure 1: The proposed framework for vendor selection
4.2 Evaluation Criteria with Interdependence In the vendor evaluation process, an objective, unbiased decision is very hard to reach given the numerous criteria that need to be carefully considered and examined. One formal group management technique for determining a set of evaluation criteria is NGT. This well-known process forces everyone to participate and no dominant person is allowed to come out and control the proceedings. In NGT, all ideas have equal stature and will be judged impartially by the group. In our problem, seven potential evaluation criteria are determined as follows 1. 2. 3. 4. 5. 6. 7.
On-time delivery (Cl). Product quality (C2). Price/cost (C3). Facility and technology (C4). Responsiveness to customer needs (C5). Professionalism of salesperson (C6). Quality of relationship with vendor (C7).
To simplify the process and avoid any misunderstandings, the interaction between any two of these criteria is not considered in the first instance. These criteria may not include all of the decision factors in vendor selection. However, they are indeed meaningful measures and have been emphasized in many leading articles 5
International Journal of Computer Applications (0975 – 8887) Volume 5– No.9, August 2010 Next, in order to reflect the interdependence property between the criteria, we need to identify the exact relationship in a network structure of ANP. Another NGT process is taken to construct the relationship based on the following two recognitions: 1.
Price/cost may be influenced by the quality of products and the relationship with vendors.
2.
Product quality may be influenced by facility and technology.
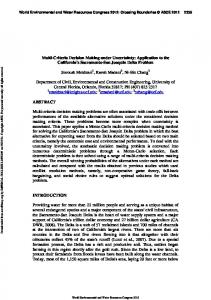
Figure 1.2 represents the relationship of interdependency. A single arrow implies a one-way relationship. For example, the arrow that leaves from C2 and feeds into C3 implies that the relationship of criterion C2 has an influence on criterion C3.
Next, the effects of the interdependence between the criteria are resolved. The group members will examine the impact of all criteria on each other by pair-wise comparisons too. To help smooth the comparison process, a couple of questions such as "Which criterion will influence criterion C3 more: C2 or C7? And how much more?" are answered. Various pair-wise comparison matrices are constructed for each criterion. These pair-wise comparison matrices are needed for identifying the relative impacts of criteria interdependent relationships. The normalized principal eigen vectors for these matrices are calculated and shown as column components in interdependence weight matrix B, where zeros are assigned to the eigenvector weights of the criteria with no interdependent relationship. ACTIVITY: 3
4.3 Determination of Weights to Criteria To determine the relationship of the degree of interdependence, the ANP technique, which is an extension of AHP, is used to address the relative importance of the criteria. ANP is developed to generate priorities for decisions without making assumptions about a unidirectional hierarchy relationship between decision levels. To take the place of a linear top-to-bottom form of strict hierarchy, the ANP model provides a looser network structure and possibly represents any decision problem. The relative importance or strength of the impacts qn a given element is measured on a ratio scale, which is similar to AHP.
Now the interdependence priorities .of the criteria can be obtained by synthesizing the results from the previous two steps as follows:
wc
Bw T2
…. (1)
Thus, the weights of the evaluation criteria can be determined
4.4 The Ranking and Selection Process As large number of potential available vendors in the current marketing environment, a full ANP decision process becomes impractical in some cases. To avoid an unreasonably large number of pair-wise comparisons, we choose TOPSIS as the ranking technique because of its concept's ease of use. Also, ANP is adopted simply for the acquisition of the weights of criteria. First, a general TOPSIS process with six activities is listed below. ACTIVITY: 1 Establish a decision matrix for the ranking.. The structure of the matrix can be expressed as follows:
F1 Figure 2: The interdependent relationship between the selected criteria
Without assuming the interdependence between criteria, the decision makers or experts are asked to evaluate all proposed criteria pair-wise. They responded to questions such as "Which criteria should be emphasized more in a vendor, and how much more?" The responses were presented numerically and scaled on the basis of Saaty's 1- 9 scale, where 1 represents indifference between the two criteria and 9 represents extreme preference for one criterion over the compared criterion. Each pair of criteria is judged only once. A reciprocal value will be assigned automatically for the reverse comparison. Once the pair-wise comparisons are completed, the local priority vector wx is computed as the unique solution of
Aw1
w1 .
m ax
Where max is the largest eigen value of pair-wise comparison matrix A. All obtained vectors are further normalized to represent the local priority vector w1. ACTIVITY: 2
A1 f11 A 2 f 21
f 22
A i f i1
fi2
f ij
f in
D
ACTIVITY: 1
F2 Fj Fn f12 f1 j f1n f 2 j f 2n
A m f m1 f m 2 f m j f m n where Ai denotes the alternatives i,j = 1,……m; Fj represents jth attribute or criterion, j=1,….., n related to ith alternative; and fij is a crisp value indicating the performance rating of each alternative Ai with respect to each criterion Fj. ACTIVITY: 2 Calculate the normalized decision matrix R (=[rij]). The normalized value rij is calculated as shown in Eq. (2).
rij
f ij
…. (2)
n
f
2 ij
i 1
6
International Journal of Computer Applications (0975 – 8887) Volume 5– No.9, August 2010 where j = 1,….., n; i =1,……., m.
n
Di
ACTIVITY: 3 Calculate the weighted normalized decision matrix by multiplying the normalized decision matrix by its associated weights. The weighted normalized value vij is calculated as shown in Eq. (3).
v ij
w j rij ,
j = 1,….., n; i =1,……., m.
…. (3)
where Wj represents the weight of the jth attribute or criterion. ACTIVITY: 4
v1 .......... ... v n
max vij | j J , min vij | j J ' v
v1 .......... ... v n
min vij | j J , max vij | j J ' where J is associated with the benefit criteria, and j is associated with the cost criteria. ACTIVITY: 5 Calculate the separation measures, using the m-dimensional Euclidean distance. The separation measure Di+ of each alternative from the PIS is given in Eq. (4). n
Di
2
vij
v j , i 1.......m.
…. (4)
j 1
Similarly, the separation measure Di– of each alternative from the NIS is as shown in Eq. (5). n
Di
v j , i 1.......m.
…. (5)
j 1
Ci D
Di Di
, i 1, .......,m
…. (6)
Where the index value of C i lies between 0 and 1. the larger the index value, the better the performance of the alternatives. R+ = { r1+ …..r n+} …(7) n
D
D
i
i
D
, i 1, .......,m
…(9)
i
5. RESULTS AND DISCUSSION
Step 3: The decision makers will be asked to evaluate all criteria pair-wise without assuming the interdependence between them. The normalized eigen vector can be calculated as w2 = (Cl, C2, C3, C4, C5, C6, C7) = (0.347, 0.247, 0.142, 0.035, 0.084, 0.043, 0.101) which represents the related local priority of these criteria. The degree of consistency of the pair-wise comparison is measured with the use of the consistency ratio (CR) index. It is considered logically consistent if CR is less than or equal to 0.1. The CR value for this case is 0.058, which is acceptable. Step 4: The interdependence between the criteria is now considered. All decision makers or group members will examine the impact of all the criteria by pair-wise comparison. In total, there are seven comparison matrices generated by all members. The normalized eigenvector for these matrices developed by the first member is calculated and shown as seven columns in Table 2, where zeros are assigned to the eigenvector weights of the criteria with no interdependent relationship. The data in Table 2 imply the relative impact of part of the criteria on others. For example, the degree of relative impact of C2 for C3 is 0.236.
The pair-wise comparison matrix for different criterias is shown in Table 1. Table 1 The pair-wise comparison matrix for criteria
Calculate the relative closeness to the idea solution and rank the alternatives in descending order. The relative closeness of the alternative Ai with respect to PIS V+ can be expressed as:
Di
wj , i 1.......m.
j 1
ACTIVITY: 6
Ci
2
5.1 Pair-wise Comparison Matrix for Criteria
2
v ij
rj
For illustration purpose, an example of vendor selection is performed by the suggested hybrid approach. Let us consider that four vendors, Al, A2, A3, and A4 are involved for evaluation. A team of three is charged in this project. Seven criterias are considered for the selection (Step 1 and Step 2), and the other steps are summarized as follows:
Determine the PIS and NIS, respectively:
v
rij
rij
rj
2
wj , i 1.......m.
C1
C2
C3
C4
C5
C6
C7
Vector weights
C1
1
2
4
5
4
6
4
0.346
C2
½
1
3
4
4
5
3
0.247
C3
¼
1/3
1
1/3
2
1/5
1/2
0.142
C4
¼
1/5
3
1
4
1/2
2
0.035
C5
¼
1/4
1/2
1/4
1
1/4
1/3
0.084
C6
1/6
1/5
5
2
4
1
3
0.043
C7
¼
1/3
2
1/2
3
1/3
1
0.101
…(8)
j 1
7
International Journal of Computer Applications (0975 – 8887) Volume 5– No.9, August 2010
5.2 Degree of Relative Impact for Evaluation Criteria Table 2 represents the degree of relative impact for evaluation criteria.
5.3 Normalized Decision Matrix The normalized decision matrix of various vendors with respect to the criterias is shown below in Table 3. Table 3 Degree of relative impact for evaluation criteria
Table 2 Degree of relative impact for evaluation criteria
C2
C3
C4
C5
C6
C7
C1
C2
C3
C4
C5
C6
C7
A1
0.552
0.396
0.431
0.453
0.462
0.629
0.375
C1
1
0
0
0
0
0
0
A2
0.552
0.594
0.323
0.543
0.577
0.449
0.375
C2
0
0.866
0.236
0
0
0
0
A3
0.442
0.495
0.647
0.543
0.577
0.449
0.600
C3
0
0
0.606
0
0
0
0
A4
0.442
0.495
0.539
0.453
0.346
0.449
0.600
C4
0
0.134
0
1
0
0
0
C5
0
0
0
0
1
0
0
C6
0
0
0
0
0
1
0
C7
0
0
0.158
0
0
0
1
The relative importance of the criteria considering interdependence can be obtained by synthesizing the results.
wi
C1
C1
1
C2
0 0.866 0.236 0 0 0 0
C3
0
C4
0 0.134
0
1 0 0 0
C5
0
0
0
0 1 0 0
C6
0
0
0
0 0 1 0
C7
0
0
0
0
0
0 0 0 0
0.606 0 0 0 0
0.158 0 0 0 1
Step 5: based on the PIS and N, the ranking activities will start. By Eq. (7), the PIS and NIS for decision maker 1 will be: R+= (0.552, 0.594, 0.647, 0.543, 0.577, 0.629, 0.600), R+= (0.442, 0.396, 0.323, 0.453, 0.346, 0.449, 0.375),
5.4 Separation distances of the Group Table 4 shows the separation distances calculated by the three decision makers based on the performance of vendors for the chosen criterias. Table 4 Separation distances of the group
DM#1
Di
Di
DM#2
Di
DM#3
Di
Di
Di
Aggregated separation distances
Di
Di
A1 0.151 0.064 0.208 0.080 0.236 0.017 0.195 0.044 A2 0.146 0.120 0.185
0.11
0.141 0.165 0.157 0.131
0.346
0.346
A3 0.089 0.165 0.126 0.234 0.025 0.222 0.066 0.205
0.247
0.247
A4 0.120 0.119 0.197 0.133 0.160 0.103 0.156 0.118
0.142
0.086
Note: DM - decision maker.
0.035
0.068
0.084
0.084
5.5 Final Rank of the Vendor Selection Problem
0.043
0.043
0.101
0.123
Table 5 shows the closeness coefficient of various vendors which is calculated by TOPSIS method. It ranges between 0 and 1. Table 5.5 Final rank of the vendor selection problem
According to the vector from decision maker 1, C1, C2, and C7 are three of the most important factors related to the evaluation process.
Rank
Alternative
Closeness coefficient
1
A3
0.758
At the next level of the decision process, the decision makers will be asked to establish the decision matrix by comparing candidates under each criterion separately. The criteria are assumed to be benefit criteria and they were asked to give a set of crisp values within the range of 1 to 10 to represent the performance of each alternative with respect to each criterion. After the decision matrices are determined, we normalize these matrices via Eq. (2). Table 3 shows the result of decision maker
2
A2
0.457
3
A4
0.430
4
A1
0.185
Using the criteria weights (Wc) obtained from step 1-3 and Eq. (8), the weighted Euclidean distances, between At and R+, and between Ai and R , can be calculated immediately. Table 4 8
International Journal of Computer Applications (0975 – 8887) Volume 5– No.9, August 2010 represents the separation distances developed by all three members. Next, to derive group priorities, the group’s aggregated separation distances are generated by its geometric mean. The last two columns of Table 4 show the results. Finally, the relative closeness to the idea solution of each alternative can be calculated using Eq. (9). The final results can be seen in Table 5. According to the closeness coefficient, the ranking order of the four candidates is A3, A2, A4 and A1. Obviously, the best selection is candidate A3.
6. SOFTWARE DEVELOPMENT In order to execute several number of times with changing input parameters, software to calculate vendor rating is being developed during the phase II using VB.NET and MS Access Query Language
7. CONCLUSION
selection', International journal of Physical Distribution & Logistics Management, 30 No. 2, 96-111. [5] Cevriye Gencer and Didem Gurpinar (2007), 'Analytical Network Process in supplier selection: A case study in an electronic firm', Applied Mathematical Modelling, 31, 24752486. [6] Ching-Torng Lin, Hero Chiu and Po-Young Chu (2006), 'Agility index in the supply chain', International Journal of Production Economics, 100, 285-299. [7] Chopra S. and Meindle P. (2001), 'Supply Chain Management Strategy, Planning and Operation', Prentice Hall Inc., Upper Saddle River, 1-24. [8] Degraeve Z., Labro E. and Roodhooft F. (2000), 'An evaluation of vendor selection models from a total cost of ownership perspective', European Journal Of Operational Research, 125, 34-58
Developing a robust, easy-to-deploy method of evaluating suppliers is a-critical business competency. The methodology should be sound and the approach practical. Gathering data for the sake of data will not produce the return on investment in supplier evaluation. Most importantly, companies need to use the results as a means to foster communications and a starting point for supplier development and performance improvement. This, in turn, will help companies to reap the financial and competitive rewards of high performing key suppliers. In this project an attempt has been made to select the best vendor by using Multi Criteria Decision Making technique which uses Analytical Network process (ANP) and TOPSIS method. Analytical Network Process mainly avoids arbitrary assignments of weights for the factors depending on the decision maker, and relative pair wise comparison still makes the process more feasible and more accurate vendor rating can be obtained when compared to any other method. A software program has been developed during phase II by using VB.NET and Ms Access by considering various factors such as quality, price, on-time delivery, responsiveness, etc. as input to evaluate the best vendor as an output. In this process time, manpower requirement is very less as it is based on a software and no technical knowledge is required to operate this which can be done by a simple data entry operator.
[9] Desheng Wu and David L. Olson (2008), 'Supply chain risk, simulation, and vendor selection', International Journal of Production Economics, 114, 646-655.
8. REFERENCES
[16] Jiann Liang Yang, Huan Neng Chiu, Gwo Hshiung Tzeng and Ruey Huei Yeh (2008), 'Vendor selection by integrated fuzzy MCDM techniques with independent and interdependent relationships', International Journal of Information Sciences, 178, 623-642.
[1] Alberto De Toni and Guido Nassimbeni (2001), 'A method for the evaluation of suppliers co-design effort', International Journal of Production Economics, 72, 169-180. [2] Amir Sanayei, Farid Mousavi S., Abdi M.R. and Ali Mohaghar (2008), 'An integrated group decision-making process for supplier selection and order allocation using multi-attribute utility theory and linear programming', Journal of the Franklin Institute, 16, 823-847. [3] Banar M, Kose B.M. and Ozkan A. (2006), 'Choosing a municipal landfill site by Analytical Network Process', Article of Environ Geol, 52, 741-751. [4] Bragila M. and Petroni A. (2000), 'A quality assurance – oriented methodology for handling trade-offs in supplier
[10] Dickson G.W. (1966), 'An analysis of vendor selection systems and decisions', Journal of Purchasing, 2, No. 1, 5-17. [11] Dilay Celebi and Demet Bayraktar (2008), 'An integrated neural network and data envelopment analysis for supplier evaluation under incomplete information', Expert Systems with Applications, 35, 1698-1710. [12] Elena Tsiporkova and Veselka Boeva (2006) 'Multi-step ranking of alternatives in a multi-criteria and multi-expert decision making environment', International Journal of Information Sciences, 176, 2673-2697. [13] Filip Roodhooft and Jozef Konings (1996),'Vendor selection and evaluation - An activity based costing approach', European Journal of Operational Research, 96, 97-102. [14] Hsu-Shih Shih, Huan-Jyh Shyur and Stanley Lee E. (2006), 'An extension of TOPSIS for group decision making', Mathematical and Computer Modelling, 45, 801-813. [15] Huan Jyh Shyur and Hsu-Shih Shih (2006), 'A hybrid MCDM model for strategic vendor selection', Mathematical and Computer Modelling, 44, 749-761.
[17] Mitsutoshi Kojima, Kenichi Nakashima and Katsuhisa Ohno (2008), 'Performance evaluation of SCM in JIT environment', International Journal Of Production Economics, 115, 439-443. [18] Mohammad Taghi Taghavifarad and Daniel Mirheydari (2008),'A new framework for evaluation and prioritization of supplier's using a Hierarchy Fuzzy TOPSIS', Proceedings of world academy of science, 31, 1-18.
9