Measuring the Spectra of Neutron Leakage from the Surface ... of sphere surface to be fairly reliably measured, and simple codes to be used in order to obtain.
EPJ Web of Conferences 106, 06002 (2016) DOI: 10.1051/epjconf/201610606002 � C Owned by the authors, published by EDP Sciences, 2016
Verification of the Results of Benchmark Experiments on Measuring the Spectra of Neutron Leakage from the Surface of Iron Balls with Radionuclide Sources Placed Inside E.E. Petrov1 , A.A. Dubinin1 , V.A. Chernov1 , V.A. Khoromsky1 , and T.V. Golashvily2 1 2
SSC RF – IPPE, Obninsk, Russia NRNU MEPHI, Moscow, Russia
1. Introduction At the present time with relation to the development of nuclear power and advancements in computer capabilities, the codes of ionizing radiation field calculation in the design and operation of nuclear power plants and other installations with applied nuclear sources have been improved. It is now feasible to solve complicated three-dimensional problems with more stringent requirements and to refine errors from the results obtained. The libraries of constants of neutron interaction with nuclei of various isotopes used in the calculations as a rule make the most appreciable contribution to refinement of these errors. These libraries take a long time to build, consisting of experimental measurement cross-sections of interactions of neutron with nuclei, their analysis and estimation and, finally, creation of the neutron constants libraries that need final experimental verification. The simplest geometry is chosen for such experiments. For this purpose the materials under investigation are formed in a ball, and small-sized radionuclide sources are used so that they may be modeled in the calculations by point and isotropic sources are located in the center of the balls. The selected geometry of experiments allows the energy distribution of neutron currents from a unit of sphere surface to be fairly reliably measured, and simple codes to be used in order to obtain their calculated values. The reliability of such benchmark experiments is often checked by means of additional calculations of their results with the use of codes and libraries of neutron constants showing good results in practice. The purpose of our work (with the results described in the paper) was a comprehensive substantiation of the results of earlier benchmark experiments on measuring the energy spectra of neutrons escaping from the surface of iron balls because iron is one of the main elements for structural materials used in nuclear power engineering. The benchmark experimental results validated in this way are assumed to be reliably used for the final check of improved or newly created systems of neutron constants. This is an Open Access article distributed under the terms of the Creative Commons Attribution License 2.0, which permits unrestricted use, distribution, and reproduction in any medium, provided the original work is properly cited.
Article available at http://www.epj-conferences.org or http://dx.doi.org/10.1051/epjconf/201610606002
EPJ Web of Conferences
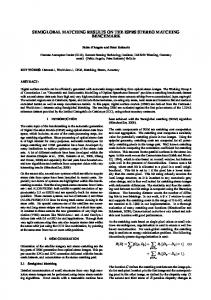
Figure 1. Installation scheme. Table 1. Isotopic composition of iron under study. Isotope Fe (natural) Mn (natural) Si (natural) C12
Content (%) 99.03 0.50 0.27 0.20
2. Experimental Installation The experimental installation is mounted on a special frame where a spherical model of the iron specimen, a neutron detector (spectrometer), and shadow shielding for background effect measurement are installed and fastened (Fig. 1). All these elements are located in a horizontal plane at a height of 150 cm from the concrete floor surface. The distance between them can vary. The experimental installation is located in the centre of a room 30 m long, 17 m wide and 12 m in height. The spherical models were made of iron with a specific weight of 7.86 g/cm3 , its isotopic composition is given in Table 1. In the center of each iron ball is a cavity for the sources. These cavities have the form of the cylinder in diameter of 2.2 cm and in height of 2.7 cm. They are the bottom part of round channels with which help sources are located in the centre of iron spheres. During experiments these channels are closed by long iron fuses forming cavities for sources. The thickness of the shadow shielding layers is formed in truncated cones and the cone angle is designed specifically to exclude the entry of non-scattered neutrons directly escaping from the iron ball surface into the detector. This shielding consists of two layers: borated polyethylene 18 cm in thickness and lead 10 cm in thickness. The cone angle is selected so as to block visibility of the iron ball from the detector location point along exact boundaries. 06002-p.2
15th ISRD Table 2. Group representation of energy distributions of neutrons for the sources Cf252 and Pu-Be in the ABBN library structure. Group No Energy interval, MeV Cf252 , 1/s Pu-Be, 1/s 1 14.5 – 14.0 1.7 × 10⁻⁴ 0 2 14.0 – 10.5 1.65 × 10⁻³ 7 × 10⁻³ 3 10.5 – 6.5 2.175 × 10⁻² 1.905 × 10⁻¹ 4 6.5 – 4.4 9.45 × 10⁻² 3.05 × 10⁻¹ −1 5 4.4 – 2.5 1.812 × 10 2.262 × 10⁻¹ 6 2.5 – 1.4 2.611 × 10⁻¹ 1.063 × 10⁻¹ 7 1.4 – 0.8 2.08 × 10⁻¹ 6.4 × 10⁻² −1 8 0.8 – 0.4 1.436 × 10 5.52 × 10⁻² 9 0.4 – 0.2 6.48 × 10⁻² 2.52 × 10⁻² 10 0.2 – 0.1 2 × 10⁻² 1.55 × 10⁻² −2 11 0.1 – 0.0465 3.23 × 10 5.1 × 10⁻³ Sum
1.0
1.0
Two radionuclide sources were used in the experiments: Cf252 at 109 1/s capacity 1.6 cm in height and 1.6 cm in diameter as well as Pu-Be at 107 1/s capacity 2.5 cm in height and 2.0 cm in diameter. Data about neutron spectra of sources for use in calculation programs were created as follows. Separate measurements of these spectra were carried out. The received results were submitted as smooth curves with which help neutron spectra of sources were represented in the group kind corresponding to the chosen calculation program. Neutron spectra of chosen sources are submitted in structureABBN in Table 2. Both of them are normalized to unity.
2.1 Detectors A SEN2-02 spectrometer with a proportional SNM-38 hydrogen counter was used for the measurement of neutron energy distribution in the energy interval (0.01–0.7) MeV. The measurement error of group neutron fluxes is within 10–30%. For the measurement of neutron energy distribution in the energy interval 0.3–16 MeV a single-crystal scintillation spectrometer based on a cylindrical stilbene crystal (diameter – 3.0 cm, height – 2.0 cm) was used. For this spectrometer the measurement error of group neutron fluxes also lies within 10–30%.
2.2 Measurements, Results and Conclusions The measurements of neutron current spectrum on the surfaces of iron balls were made by means of the above mentioned detectors. The description follows. For the selected variants of ball and source by means of one of the indicated detectors located at a certain distance from the ball, the energy spectra of neutrons entering the detector were measured for the first time. Thus the detector registered the non-scattered neutrons in the environment as well as those scattered in the environment from the walls and ceiling of the room, and from the concrete floor and air. It is necessary to notice that the column on which iron spheres were located represents the certain frame made of thin iron strips in thickness of 3 mm. Calculations have shown that the contribution of neutrons scattered from this frame in indications of the detector is very small and it can be neglected. Only non-scattered neutrons will generate the required neutron current spectrum so the challenge was to exclude the scattered fraction from the measured neutron spectrum. To this end, the second measurement was made using shadow shielding, which provided the energy distribution of scattered neutrons. Having excluded them from the neutron spectrum obtained in the first measurement, we obtain a spectrum of non-scattered neutrons only entering the detector directly from the iron ball’s surface. After multiplication of this result by 4�L2 where L is the distance from the ball center to the detector, 06002-p.3
EPJ Web of Conferences
101 0
10
10
-1
10
-2
10
-3
10
-4
10
-5
10
-6
0.01
Fn, 1/(s*MeV)
Fn, 1/(s*MeV)
10
101
Experiment Calculation MCNP Calculation ROZ-6.6 with ABBN-78 Calculation ROZ-6.6 with ABBN-93
0.1
1 E, MeV
10
0
10
-1
10
-2
10
-3
10
-4
10
-5
0.01
Figure 2. Energy distributions of a neutron current through the surface of iron ball with the diameter of 40 cm with a source Cf252 , obtained experimentally and in calculations.
Experiment Calculation MCNP Calculation ROZ-6.6 with ABBN-78 Calculation ROZ-6.6 with ABBN-93
0.1
1 E, MeV
10
Figure 3. Energy distributions of a neutron current through the surface of iron ball with the diameter of 60cm with a source Cf252 , obtained experimentally and in calculations.
we obtain the required data on the energy distribution of neutrons escaping from the full surface of the iron ball. All measurements were carried out with the ball diameter 40 cm, 60 cm and 100 cm and with the Cf252 and Pu-Be neutron sources placed in their centre of ball with the use of the procedure described above. The ROZ-6.6 code [1] with the ABBN-78 and ABBN-93 libraries as well as the MCNP code [2] with the ENDF/B-VI library were employed for the calculation of these experimental results and their analysis. The experimental results and their calculation values are presented in Figs. 2, 3, 4 and 5. All neutron spectra compared here refer to the same capacity of the neutron sources of equal units. From these figures it can be seen that in the majority of energy groups the difference between experimental and all calculation results does not exceed the above declared value of 30% experimental error for all cases under consideration. In a comparison of neutron currents integrated for all groups, the difference between the experimental and calculated data does not exceed 5%. Hence a conclusion can be made that the experimental values of neutron groups collected in Table 3 can be considered reliable and recommended for final check of the libraries of neutron constants for iron. It should be noted that the experimental data presented in the form of energy distributions of neutrons allow an easy identification of weak points in the libraries of neutron constants and targeted introduction of the appropriate amendments. 06002-p.4
15th ISRD
101
10
101 10
0
0
10
-1
10
-2
10
-3
Fn, 1/(s*MeV)
Fn, 1/(s*MeV)
10-1
Experiment
10
-4
10
-5
0.01
10
-2
10
-3
10
-4
Calculation MCNP
10-5
Calculation ROZ-6.6 with ABBN-78 Calculation ROZ-6.6 with ABBN-93
10
-6
10
-7
0.1
1 E, MeV
10
0.01
Figure 4. Energy distributions of a neutron current through the surface of iron ball with the diameter of 60 cm with a source Pu-Be, obtained experimentally and in calculations.
Experiment Calculation MCNP Calculation ROZ-6.6 with ABBN-78 Calculation ROZ-6.6 with ABBN-93
0.1
1 E, MeV
10
Figure 5. Energy distributions of a neutron current through the surface of iron ball with the diameter of 100 cm with a source Cf252 , obtained experimentally and in calculations.
Table 3. The verified values of neutrons escaping from the full surface of iron balls in the group representation obtained experimentally. Group # 1 2 3 4 5 6 7 8 9 10 11 12 13
Energy interval, MeV 14.5 – 14 14 – 10.5 10.5 – 6.5 6.5 – 4 4 5 – 2.5 2.5 – 1.4 1.4 – 0.8 0.8 – 0.4 0.4 – 0.2 0.2 – 0.1 0.1 – 0.0465 0.0465 – 0.0215 0.0215 – 0.01 Sum
D = 40 cm, Cf252 1.01 × 10⁻⁵ 1.45 × 10⁻⁴ 1.72 × 10⁻³ 6.78 × 10⁻³ 1.98 × 10⁻² 7.27 × 10⁻² 1.75 × 10⁻¹ 2.95 × 10⁻¹ 2.14 × 10⁻¹ 1.10 × 10⁻¹ 4.17 × 10⁻² 2.26 × 10⁻² 8.04 × 10⁻³
D = 60 cm, Cf252 1.06 × 10⁻⁵ 3.00 × 10⁻⁵ 3.82 × 10⁻⁴ 1.39 × 10⁻³ 4.96 × 10⁻³ 2.81 × 10⁻² 1.01 × 10⁻¹ 2.74 × 10⁻¹ 2.53 × 10⁻¹ 1.59 × 10⁻¹ 6.41 × 10⁻² 5.03 × 10⁻² 1.83 × 10⁻²
D = 60 cm, Pu-Be 0.00 1.06 × 10⁻⁴ 3.02 × 10⁻³ 4.37 × 10⁻³ 8.16 × 10⁻³ 3.10 × 10⁻² 1.03 × 10⁻¹ 2.55 × 10⁻¹ 2.78 × 10⁻¹ 1.37 × 10⁻¹ 4.66 × 10⁻² 5.46 × 10⁻² 1.25 × 10⁻²
D = 100 cm, Cf252 3.04 × 10⁻⁷ 3.56 × 10⁻⁶ 1.90 × 10⁻⁵ 5.87 × 10⁻⁵ 2.70 × 10⁻⁴ 3.66 × 10⁻³ 2.85 × 10⁻² 1.69 × 10⁻¹ 2.54 × 10⁻¹ 1.89 × 10⁻¹ 9.00 × 10⁻² 8.30 × 10⁻² 3.37 × 10⁻²
9.67 × 10⁻¹
9.55 × 10⁻¹
9.33 × 10⁻¹
8.51 × 10⁻¹
06002-p.5
EPJ Web of Conferences References [1] Voloshchenko A. M., Dubinin A. A., “ROZ-6.6 code for the solution of the transport equation for neutrons, photons and charged particles by the method of discrete ordinates in the one-dimensional geometry”, Report, Keldysh Institute of Applied Mathematics of the Russian Academy of Sciences, Inv. No 7-25-2004, Moscow, 2004 [2] F. Biesweister Ed., « MCNP-A General Monte Carlo N-Particle Transport Code, Version 4B », Los Alamos National Laboratory Report, LA-12625, 1997
06002-p.6