Oct 15, 2014 - and the other is associated to G5.97-1.17, whose proplyd nature was previously established. ..... velocity for the stellar wind of 2700 km sâ1(Dzib et al. 2013a), the .... proplyds appear to be steady in time, nine of them exhibit significant flux density variations ..... 0.34 ± 0.03 à 0.25 ± 0.05; 41 ± 21. 15.12 ± 0.59.
Very Large Array and Jansky Very Large Array observations of the compact radio sources in M8 Josep M. Masqué1 , Sergio Dzib2 , & Luis F. Rodríguez1,3
arXiv:1410.4151v1 [astro-ph.SR] 15 Oct 2014
ABSTRACT We analyze high-resolution Very Large Array and Jansky Very Large Array continuum observations of the M8 region carried out at several epochs that span a period of 30 yr. Our maps reveal two compact sources. One is associated with Her 36 SE, a possible companion of the O7 luminous massive star Her 36, and the other is associated to G5.97-1.17, whose proplyd nature was previously established. With the analyzed data, we do not find significant time variability in any of these sources. The derived spectral index of ≥ 0.1 for Her 36 SE, the marginal offset of the radio emission with the previous IR detection and the associated X-ray emission previously reported suggest the presence of an unresolved interaction region between the strong winds of Her 36 and Her 36 SE. This region would produce non-thermal contamination to the global wind emission of Her 36 flattening its spectral index. On the other hand, the emission of G5.97-1.17 can be also explained by a mixture of thermal and non-thermal emission components, with different relative contribution of both emission mechanisms along the proplyd. We argue that the shock created by the photo-evaporation flow of the proplyd with the collimated stellar wind of Her 36 accelerates charged particles in G5.97-1.17 producing considerable synchrotron emission. On the contrary, an electron density enhancement at the southwest of G5.97-1.17 makes the thermal emission dominant over this region.
1.
Introduction
The intense radiation produced by recently formed massive stars is capable of ionizing their surrounding material, giving rise to large (> 0.1 pc) photo-ionized regions (H II regions). 1
Centro de Radioastronomía y Astrofísica, Universidad Nacional Autónoma de México, Morelia 58089, México 2 3
Max-Plank-Institut für Radioastronomie, Auf dem Hügel 69, D-53121 Bonn, Germany
Astronomy Departament, Faculty of Science, King Abdulaziz University, P.O. Box 80203, Jeddah 21589, Saudi Arabia
–2– In the H II regions, the free electrons emit thermal radiation through the free-free mechanism, which produces bright emission at radio-wavelengths being easily detected with traditional interferometers. As a result, large surveys of massive star-forming regions in the Galaxy can be efficiently performed at cm wavelengths and the properties of H II regions, as well as of their compact precursors called ultra-compact and hyper-compact H II regions (UCH II and HCH II, respectively), are nowadays well established (Wood & Churchwell 1989; Becker et al. 1994; Hoare et al. 2012). Recently, special attention has been called to extremely compact objects projected inside UCH II regions hidden by the bright extended cm emission of the ionized gas (e.g. W3(OH), NGC6334A: Kawamura & Masson 1998; Carral et al. 2002; Dzib et al. 2013b; Rodríguez et al. 2014; Dzib et al. 2014). The behavior of these compact sources is puzzling: their time variability in scales of months to years and large fluxes are discrepant with those expected for a free-free emitting stellar wind. Moreover, it seems to be no unique explanation for their nature: while the compact source in the center of W3(OH) exhibits a positive spectral index consistent with the presence of a fossil photo-evaporating disk (Dzib et al. 2013b), the compact source of NGC6334A has a negative spectral index characteristic of optically thin synchrotron emission (Rodríguez et al. 2014). The last emission mechanism requires the presence of relativistic electrons, which can be attributed to Fermi acceleration in strong shocks of stellar winds between O companions, implying the presence of a massive binary system ionizing the HII region (e.g. several sources in the Cyg OB2 association: Ortiz-León et al. 2011; Blomme et al. 2013). A technique employed to detect these compact sources consists in discarding the visibilities from the shortest baselines when making the map. These baselines contain information of the extended emission and, hence, the resulting map obtained under this technique retains only emission from the most compact objects (see Dzib et al. 2013b, for an example). This technique has been applied successfully for the UC H II region W3(OH) (Dzib et al. 2013b) and NGC6336A (Carral et al. 2002). In this paper we apply the same technique to the NGC 6523 massive star forming region. NGC 6523 is an extremely dense stellar cluster belonging to the OB1 Sagittarius association. Observations to the date reveal a complex scenario for this region: it appears to be located at the front edge of a molecular cloud, whose foreground material has been blown up by the stellar activity of NGC 6523 and a new generation of stars is being triggered inward the cloud (Lada et al. 1976; Elmegreen & Lada 1977; Lightfoot et al. 1984). Behind this cluster, projected in the center, we find the famous Lagoon Nebula, or M8, an HII region, located at 1.3 kpc (Arias et al. 2006), that is sustained by the UV photons from the O7 star Herschel 36 (Woolf 1961, hereafter Her 36). This luminous star, detected previously at op-
–3– tical and IR wavelengths, has multiple components (Allen 1986; Arias et al. 2010). The gas ionized by Her 36 forms a blister H II region shaped by the complex distribution of material in the region (but see Lightfoot et al. 1984 for caveats to this interpretation), acquiring a distinctive morphology which lead to call it as the ’Hourglass Nebula’ (Allen 1986). Radio observations presented by Stecklum et al. (1998) show diffuse emission spanning over a large area, but no significant emission coming directly from Her 36. These observations also show that the brightest peak of the diffuse radio emission falls 200.7 to the southeast of the massive star. This bright emission was first associated by Wood & Churchwell (1989) to an UCHII region ionized by a B0 star (it was called G5.97−1.17, and we will refer to it as G5.97 through the rest of the paper). However, later studies showed that G5.97 is most likely a proplyd being photoevaporated by Her 36 (Stecklum et al. 1998). Up to date, the majority of currently known proplyds are located in the Orion nebula (Ricci et al. 2008), which makes the few proplyd candidates in other H II regions a good case of study, since their potential proplyd nature may have different intrinsic properties and associated ambient. Indeed, the technique mentioned above is ideal to isolate the compact cm emission of proplyds since they are generally embedded in an extended ionized strong emitting ambient. In this paper we analyze archival Very Large Array (VLA) and new Jansky Very Large Array (JVLA) data of continuum cm emission observed toward the M8 region. We were aimed to determine the nature of the compact sources found in the region. In Section 2 we describe the archival observations. In Section 3 we present the resulting maps and derive spectral indices. In Section 4 we discuss a possible interpretation of the physical processes involved in the detected sources. Finally, in Section 5 we give a summary of our conclusions.
2.
Observations
The separation between Her 36 and the G5.97 source in the plane of sky is 200.7. Thus, high angular resolution observations carried out in the A or B configuration are required, which have enough angular resolution to separate both sources. On the other hand, the fluxes of the compact sources projected inside UCHII regions reported to date are typically of the order of a few mJy at cm wavelengths (Carral et al. 2002; Dzib et al. 2013b; Rodríguez et al. 2014). Therefore, the second criterion is to select deep observations providing maps with an rms noise below 1 mJy. We inspected the VLA archive looking for observations accomplishing both conditions and found a handful of projects whose observing epochs span nearly 20 yr. These data were calibrated using the Common Astronomy Software Applications (CASA), except for the January 1988 and December 1996 data, that were calibrated with the Astronomical Image Processing System (AIPS).
–4– Additionally, recent observations of M8 were carried out with the Jansky Very Large Array in the A configuration at K band on 2014 May, as part of a project aimed to look for compact sources projected inside UCHII regions. We used the dual-polarization mode that provides 64 spectral windows of 128 MHz giving a total bandwidth of 8 GHz, much wider than the archival observations presented above (typically 100 MHz). These data were calibrated using the CASA package. A summary of the parameters of the VLA and JVLA observations is given in Table 1.
3. 3.1.
Results
Emission Maps
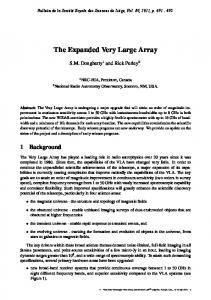
The corresponding natural-weighted maps to the observations of the G5.97 region listed in Table 1 are shown in Figure 1. The maps were constructed discarding the short spacings of the uv-dataset in order to remove the large scale emission. In particular we removed the baselines shorter than 65 kλ at 6 cm, 100 kλ at 3.6 cm, 150 kλ at 2 cm and 90 kλ at 1.3 cm, which corresponds to angular scales of 300.2, 200.1, 100.4 and 200.1, respectively. These cuts of the uvrange were chosen based on a trade off between removing extended emission and keeping enough visibilities to obtain a good map. The remaining emission shows two compact radio-sources, one to the southeast and another to the northwest of the mapped region, corresponding to G5.97 and Her 36, respectively. Emission associated with Her 36 is clearly detected as a compact radio source in these images. It appears always as a point source at 1.3 cm in May 2005 and May 2014, at 2 cm in January 1988 and December 1996, and in the 3.6 cm observations of July 2003. On the other hand, it is marginally detected at 6 cm in the observations of April 1985 and 1986, and undetected in the rest of the observations. The maps of September 1995 and January 1996 have less quality with respect to the other maps and are not appropriate for the Her 36 detection. Also, the poor detectability of Her 36 when observed at 6 cm compared to shorter wavelengths suggests a positive spectral index for this source. We will discuss further the spectral index of Her 36 in the next section. As we will see later, this radio emission is not directly associated with Her 36, but is located between this star and a very nearby companion. The G5.97 source is detected in all the bands and all the epochs, it also appears to be partially resolved. At 6 cm, the proplyd is marginally elongated towards the southeast, opposite to Her 36, specially in the 1985 observations where the elongation is seen as a tail. At 3.6 cm, G5.97 appears to be composed of several blended components. This is best seen in
–5– the July 2003 map, which has the highest angular resolution of the 3.6 band, where the source presents two components: one component can be associated with the southeastern elongation discussed above and the other component is elongated roughly in the north-south direction. At 2 cm and 1.3 cm, G5.97 appears more compact compared with the maps corresponding to longer wavelengths and the southeastern elongation is hardly noticed. In particular, the May 2014 observations at 1.3 cm, carried out with very high angular resolution capable of resolving G5.97, reveal a cometary morphology with the tip of this shape pointing to Her 36.
3.2.
Fluxes and Spectral Indices
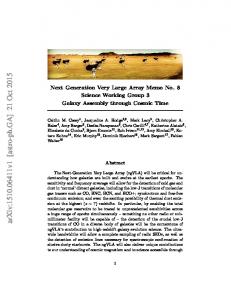
In Table 2 we report the flux peak value and position of the radio source associated with Her 36 . We give as upper limits of the peak flux for the non-detections and marginal detections 3 times the rms noise of the maps. In Table 3 we present the parameters of the emission of G5.97 derived in the following manner: we first used the outcome of the ’findsources’ function of CASA to set a reliable fitting region around each source; then we used the ’fitcomponents’ function in each region to fit a Gaussian plus a zero-level offset and extract the parameters shown in the Table. A close inspection of the flux values of the Tables shows no or modest time variability for both sources (less than 30%). Since we are comparing data taken at different epochs with different observational setups (e.g., array configuration, uv-coverage, calibration, etc.), we consider as not significant any time variability below 30%. For the same reason, the estimation of spectral indices is only reliable with data corresponding to the September 1995, January 1996 and July 2003 observations, when two bands were simultaneously observed. In these epochs, Her 36 is only detected at 3.6 cm in July 2003 allowing us to derive a lower limit of the spectral index for this epoch (≥ 0.1). The poor detection of Her 36 at 6 cm favors a dominant thermal nature for the Her 36 emission. On the other hand, G5.97 has a flat spectral index: by using the 3.6 and 6 cm bands we derived a spectral index of −0.05 ± 0.19 in September 1995 and 0.02 ± 0.28 in July 2003. The 1.3 and 2.0 cm data of the observations of January 1996 yield −0.14 ± 0.55, which is more uncertain due to the lower quality of the maps of this epoch but still consistent with a flat spectral index. In order to study the spectral index derived as a function of position, we obtained the map of the spectral index of the July 2003 observations combining the emission maps at 6 and 3.6 cm, which is shown in Figure 2. We did not show the spectral index maps of the January 1996 and September 1995 epochs, where also several bands where simultaneously observed, because the poor quality of the emission maps prevented us to obtain any significant trend. The initial maps were constructed with the same UV-range and restoring beam
–6– (corresponding to the largest beam of the two combined maps, i.e. the map at 6 cm), and a cutoff at 7 times the rms noise level. This cutoff is adequate to derive a significant trend for the spectral index in the map and only derives the uncertain extreme negative value of -1 at the north of G5.97. The most noticeable feature is the gradient of spectral index over the NE-SW direction. This gradient can be explained if we consider the cm emission of G5.97 as a mixture of thermal or non-thermal emission: there is different contribution of each type of emission in different parts of G5.97.
4. 4.1.
Discussion
The Compact Radio Emission of Her 36
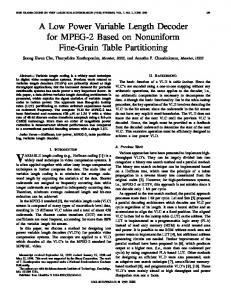
The positive spectral index of Her 36 derived above (≥ 0.1) suggests that we are detecting the radio emission of a free-free ionized stellar wind with an optically thick portion. However, if we assume that the wind is emanating from an O7 V star, a flux of 0.026 mJy is expected at 3.6 cm according to the tabulated values of Dzib et al. (2013a) scaled at 1.3 kpc of distance, which is clearly below the flux measured for Her 36, when detected at 3.6 cm (0.91 mJy). Following the formulation of Panagia & Felli (1975) and adopting a terminal velocity for the stellar wind of 2700 km s−1 (Dzib et al. 2013a), the fluxes of Her 36 at 3.6, 2 and 1.3 cm yield to values between (1.5 − 2.1) × 10−5 M yr−1 for the mass loss rate of the massive protostar, more than one order of magnitude above the expected values derived from Vink et al. (2001) assuming that Her 36 has a solar metallicity. High resolution infrared images of Her 36 (Goto et al. 2006; Stecklum et al. 1995) reveal an additional compact source, located 000.25 SE (hereafter Her 36 SE) of the Her 36 luminous star. Goto et al. (2006) detected this compact source also at 2 cm and attributed this emission to an embedded early B type star that produces a small HII region, even though they also discussed the influence of the nearby Her 36 luminous star in terms, for instance, of external photoionization (i.e. a proplyd or photoevaporating globule). In the top panel of Figure 3 we show the 1.3 cm emission around Her 36 obtained with superuniform weighting, which appears to be associated rather with the Her 36 SE component, consistent with the Goto et al. (2006) results. Thus, the discrepancy of the radio flux derived above is explained if we assume that it comes from a process occurring near Her 36 SE instead of being associated to the wind directly emanating from the Her 36 main component. Our derived lower limit for the spectral index (≥ 0.1) is consistent either with the presence of a small HII region (the expected spectral indices can be flat or positive up to 2) and a proplyd or photoevaporating globule (with an expected thermal flat spectral index, e.g. see Felli et al. 1993) in Her 36 SE. The required Lyman photons to have a flux of 1.22 mJy at 1.3 cm for Her 36 SE is
–7– 2.1 × 1044 photons s−1 , easily provided by an early B star embedded in Her 36 SE, or an O7 star separated 325 AU (assuming 1.3 kpc of distance and 000.25 for the size of Her 36 SE that gives a geometric dilution factor of 0.06). Therefore, with the present data we are not able to discard neither internal nor external ionization for Her 36 SE. However, a close inspection of the high resolution map of Her 36 of Fig. 3 shows that, within the errors, the 1.3 cm emission is slightly offset towards the direction of the Her 36 main component. If this offset is significant, the radio emission of Her 36 SE could be ascribed to a wind interaction region, presumably fairly close to Her 36 SE since its wind is expected to be significantly less powerful than that of the Her 36 main component. The lower limit for the spectral index of Her 36 is compatible with a flat index expected from a mixture of free-free emission of the ionized material of the wind and a non-thermal component produced in the wind collision region. A similar scenario was found in the massive multiple system Cyg OB2 #5 of the Cygnus OB2 association (Contreras et al. 1997; Kennedy et al. 2010; OrtizLeón et al. 2011; Dzib et al. 2013a). However, the emission arising from the wind collision region associated to Cyg OB2 #5 was found to be variable in a period of a few years. This variability was attributed to variations of free-free opacity as the companion moves along the orbit and the column density of ionized material changes with the line of sight. If we consider that Her 36 SE is orbiting around the Her 36 main component, adopting their separation as the orbital radius and 30 M for Her 36, we get a period of 1200 yr. Therefore, in the case that the radio emission arises from a wind colliding region, in 30 yr we do not expect significant changes in the observed flux of Her 36. Besides, Rauw et al. (2002) reported the detection of X-ray emission peaking at Her 36 but also presenting a distant enhancement located ∼ 0.2 pc far away at the southeast of Her 36. The presence of X-ray emission in Her 36 is consistent with the existence of a wind interaction region between the Her 36 main component and Her 36 SE. Also, these winds must be powerful enough to interact with the hosting molecular cloud, ∼ 0.2 pc far away from Her 36, producing hot gas and creating the extended southeastern enhancement of Xray emission (Rauw et al. 2002). Very high resolution (e.g., VLBI) observations are required to resolve and confirm the existence of a wind colliding region in Her 36, and assess if the involved winds are powerful enough to alter the hosting cloud and other associated objects, such as the G5.97 proplyd.
4.2.
Thermal and Non-Thermal Emission in G5.97
In a previous study Stecklum et al. (1998) provide evidence for the proplyd nature of G5.97. The fluxes presented in Table 2 and 3 are consistent with the proplyd hypothesis.
–8– First, the flux values range between 13 and 19 mJy in all the observed bands and epochs, implying a rather flat average spectral index, and consistent with the 17 mJy measured by Stecklum et al. (1998) at 2 cm. These authors estimated the number of required Lyman photons to provide this flux and found a slight deficit of ionizing photons coming from Her 36, even though the application of the main-sequence of Lyman luminosity to the young Her 36 star could not be appropriate at all. Another property supporting the proplyd hypothesis is the measured steady flux of G5.97. The timescale for dissipation of a proplyd is of the order of 104 years (Henney & O’Dell 1999; Miotello et al. 2012) and we do not expect significant changes in a few years. Besides, Castelaz & Bales (1995) compared HST images of the Orion proplyds, finding no evidence of morphological or flux variations. In their VLA study of Orion at 3.6 cm, Zapata et al. (2004) detected a total of 77 compact radio continuum sources, of which 30 are associated with proplyds. While most of the sources associated with proplyds appear to be steady in time, nine of them exhibit significant flux density variations along the 4 years of the Zapata et al. study. Does this imply that the free-free emission from the proplyds is variable in time? As noted by Zapata et al. (2004) the radio continuum emission from a proplyd may be contaminated by time-variable non-thermal emission from the associated young star, as indicated by the evidence of circular polarization found at least for one source (their source number 6). We mapped the Stokes V parameter to look for circular polarization in all the observations of Table 1 to search for gyrosynchrotron emission in G5.97 with null detections. Possibly, at the distance of M8, the intensity of the circular polarized emission, if present, is expected to be extremely weak. Thus, this non-detection is consistent with the fact that G5.97 does not have a variable non-thermal component, i.e., coronal emission. Despite its assumed proplyd nature, G5.97 exhibits some differences with the ’classical’ proplyds found in the Orion Nebula. In addition to having a higher mass loss rate and being about 3 times larger than the largest Orion proplyds (Stecklum et al. 1998), G5.97 may experience different physical processes. Figure 2 shows that the average flat spectral index of G5.97, a typical feature of most proplyds, is a combination of thermal and non-thermal emission. The fact that in the figure the peak in the spectral index is displaced with respect to the emission peaks (and these are also displaced between them), can be explained with a scenario where there is a region of thermal emission surrounded by extended emission with an important non-thermal contribution. Thus, the spatial distribution of the cm emission in G5.97 is the result of several components. Similar results were found previously for proplydlike objects in NGC 3606 (Mücke et al. 2002). For this case, synchrotron emission from a relativistic particle population embedded in a magnetic field was proposed to explain the nature of the non-thermal emission. Among several possibilities, they argued that shocks created by the photo-evaporated flow of the proplyd could provide the required particle
–9– acceleration. In any case, the fact that a fraction of the measured flux of G5.97 corresponds to non-thermal emission provides another possible explanation for the discrepancy, found by Stecklum et al. (1998), between the required and received ionizing photons from Her 36. Similarly to the proplyd-like objects of NGC 3606, the non-thermal extended emission in a considerable fraction of G5.97 can be explained by the presence of relativistic electrons in a magnetic field. The relativistic electrons can be accelerated by the shock created by the photo-evaporated flow of G5.97 with the strong collimated wind of Her 36 (see previous section). Alternatively, a stellar origin for the non-thermal emission seems unlikely, given the fact that it is extended in a big portion of G5.97, consistent with the non-detection of circular polarized emission. As in Mücke et al. (2002), the results presented in this paper prove that the magnetic field likely plays a role in the physical processes occurring in proplyds. Also, not only the UV photons but the wind coming from the ionizing star can also be responsible for, at least, part of the proplyd radio emission. The thermal emission found at the SW of G5.97 has spectral index values up to 0.6, typical of thermal radio-jets. Thus, we first consider the presence of a possible protostellar jet powered by the star associated with G5.97 as the possible origin for the thermal emission. Jet signatures have been detected in proplyds with outflow velocities of 100 km s−1 (Henney et al. 2002), being commonly less powerful compared to the jets powered by other young stellar objects (e.g., see Anglada 1996). Following the Curiel et al. (1987, 1989) formulation for a shock wave caused by the jet impinging in the circumstellar material, under the RayleighJeans approximation, the total expected flux in milliJanskys is: 2
Sν = 1.42 × 10
�
Ω arcsec2
��
ν �2 5 GHz
�
Te 104 K
� [1 − exp (−τν )],
(1)
where Ω is the angular size of the emitting area (i.e., the region affected by the jet), Te is the electronic temperature, ν is the frequency and τν is the optical depth given by the expression:
−3
τν = 1.55 × 10
�
� n0 104 cm−3
�
V 100 km s−1
�1.68 �
ν �−2.1 5 GHz
�
Te 104 K
�−0.55 ,
(2)
where, n0 and V are the pre-shock density and the velocity in which the jet impinges on the medium, respectively. Assuming that all the gas is ionized with Te = 104 K and adopting a pre-shock density of (4 − 20) × 104 cm−3 (Stecklum et al. 1998) and a typical jet velocity of 100 km s−1 (e.g., Henney et al. 2002), we derive values of τν between 0.005 and 0.03 for the
– 10 – 6 cm band. For an area of 0.3 arcsec2 , which corresponds to the size of the restoring beam of the maps of Fig. 2, equation (1) yields to predicted 6 cm flux densities of 0.2-1 mJy. On the other hand, integrating in the 6 cm map of Fig. 2 the flux arising from the same beamsize area used above (0.3 arcsec2 ), which encloses the region where the spectral index is > −0.1 (i.e., the region of G5.97 were the thermal emission is dominant) and limited by the contour 3 times the rms noise level at the southwest, we obtain 5 mJy. Applying the same calculations and assumptions at the 3.6 cm band we obtain the same flux discrepancy (0.3-1.7 mJy vs. 5 mJy measured in the 3.6 cm map). Thus, unless there is a jet in G5.97 with significantly higher mass loss rate and/or terminal velocity than the typical jets associated with proplyds and/or other assumptions made here are wrong, the thermal emission of G5.97 must have another origin. Other possibility is that the electronic density, Ne , increases at the SW of G5.97. Since thermal free-free emission is proportional to Ne2 and synchrotron emission is proportional to Ne , an enhancement of the electron density high enough (and the gas density in the case of being fully ionized) would make the thermal contribution dominant. In this sense, Mücke et al. (2002) argue that the higher electron densities found in the Orion proplyds with respect to the NGC 3606 proplyd-like objects makes the contribution of the thermal emission more important for the former. This is not the case of G5.97: in the lower panel of Fig. 3, G5.97 appears resolved and presents a bow-shock morphology, with the tip pointing to Her 36, located in a limiting region of the proplyd where the non-thermal emission starts to be dominant (spectral index . 0.1, see the peak position in Fig. 2). This suggest that an important part of the radio emission arises with the interaction of G5.97 with the stellar wind coming from Her 36. This is also seen in the Figure 2a of Stecklum et al. (1998), obtained from the subtraction of a scaled Hα image from the broadband HST image of M8. Here, G5.97 shows an ionized bow oriented towards Her 36 and possibly associated with the bow-shock identified in Fig. 3, clearly separated from a star located behind, which is possibly associated with the disk of the proplyd. According to the orientation of G5.97 with respect to Her 36, the position of the disk plus associated star, where the largest concentration of material is probably found, are approximately coincident with the part of G5.97 with positive spectral index, while the rim and the rest of the source appear associated with the non-thermal emission. Although the picture proposed here implies a highly asymmetrical appearance of G5.97, some inclination angles of the circumstellar disk with respect to the photo-ionizing star can develop complex morphologies for the proplyds (Henney et al. 1996). High resolution observations at mm wavelengths to map the mass distribution of G5.97 and, if possible, resolve the disk, are required to test the hypotheses discussed here.
– 11 – 5.
Summary and Conclusions
In this paper we monitored the radio emission of M8 by analyzing archival VLA and new JVLA observations spanning about 30 yr at 1.3, 2, 3.6, and 6 cm bands. We detected the compact source Her 36 SE, a possible companion of the Her 36 luminous star. The emission is not resolved and appears slightly displaced towards the Her 36 main component. The derived spectral index of ≥ 0.1 for the Her 36 star, being preferably detected at short wavelengths, is consistent with that of thermal emission with some non-thermal contamination. A possible explanation relies on the presence of an unresolved interaction region between winds of Her 36 and Her 36 SE, that would produce significant non-thermal emission, consistent with the previous detection of X-ray emission (Rauw et al. 2002) over this source. These winds are likely powerful enough to affect the surrounding cloud, including the G5.97 proplyd. The G5.97 source presents features consistent with having a proplyd nature. It is partially resolved, specially at long wavelengths bands, where a tail oriented in opposition to Her 36 is marginally seen at 6 cm, and with our highest resolution map at 1.3 cm, where a cometary morphology pointing to Her 36 is observed. Its flux does not vary significantly with time with values ranging between 12.5 and 19 mJy in all the observed bands and epochs, also implying a rather flat spectral index. We did not detect circular polarized emission in G5.97 indicating that the contamination of gyrosynchrotron emission from the associated star is not important, consistent with the non-variability of the G5.97 brightness. The spatial distribution of the spectral index reveals that both non-thermal and thermal emission may be present in G5.97, dominating the non-thermal contribution in a major part of the source but for the SW part where a gradient towards positive spectral index values is clearly seen. The thermal emission is too bright for a jet launched by the star associated to G5.97, considering the low mass loss rate expected for jets arising from proplyds. As the most likely explanation for the spectral index distribution, we propose that the shock created by the photo-evaporation flow with the collimated stellar wind of Her 36 accelerates charged particles producing non-thermal synchrotron emission in a considerable fraction of G5.97. According to this scenario, an electron density enhancement at the southwest of G5.97, maybe as a result of the orientation between the axis of the disk of the proplyd and Her 36, makes the thermal emission dominant over this region. JMM acknowledges financial support from DGAPA-UNAM through a postdoctoral fellowship. LFR acknowledges the support of DGAPA, UNAM, and of CONACyT (México). The National Radio Astronomy Observatory is a facility of the National Science Foundation operated under cooperative agreement by Associated Universities, Inc. We are grateful to Omaira González-Martín who reduced and verified the X-ray data discussed in this paper.
– 12 – REFERENCES Allen, D. A. 1986, MNRAS, 219, 35 Anglada, G. 1996, in Astronomical Society of the Pacific Conference Series, Vol. 93, Radio Emission from the Stars and the Sun, ed. A. R. Taylor & J. M. Paredes, 3–14 Arias, J. I., Barbá, R. H., Gamen, R. C., Morrell, N. I., Maíz Apellániz, J., Alfaro, E. J., Sota, A., Walborn, N. R., & Moni Bidin, C. 2010, ApJ, 710, L30 Arias, J. I., Barbá, R. H., Maíz Apellániz, J., Morrell, N. I., & Rubio, M. 2006, MNRAS, 366, 739 Becker, R. H., White, R. L., Helfand, D. J., & Zoonematkermani, S. 1994, ApJS, 91, 347 Blomme, R., Nazé, Y., Volpi, D., De Becker, M., Prinja, R. K., Pittard, J. M., Parkin, E. R., & Absil, O. 2013, A&A, 550, A90 Carral, P., Kurtz, S. E., Rodríguez, L. F., Menten, K., Cantó, J., & Arceo, R. 2002, AJ, 123, 2574 Castelaz, M. W. & Bales, M. 1995, in Bulletin of the American Astronomical Society, Vol. 27, American Astronomical Society Meeting Abstracts, 1320 Contreras, M. E., Rodriguez, L. F., Tapia, M., Cardini, D., Badiali, M., Emanuele, A., & Persi, P. 1997, in ESA Special Publication, Vol. 402, Hipparcos - Venice ’97, ed. R. M. Bonnet, E. Høg, P. L. Bernacca, L. Emiliani, A. Blaauw, C. Turon, J. Kovalevsky, L. Lindegren, H. Hassan, M. Bouffard, B. Strim, D. Heger, M. A. C. Perryman, & L. Woltjer, 401–404 Curiel, S., Canto, J., & Rodriguez, L. F. 1987, Rev. Mexicana Astron. Astrofis., 14, 595 Curiel, S., Rodriguez, L. F., Bohigas, J., Roth, M., Canto, J., & Torrelles, J. M. 1989, Astrophysical Letters and Communications, 27, 299 Dzib, S. A., Rodríguez, L. F., Loinard, L., Mioduszewski, A. J., Ortiz-León, G. N., & Araudo, A. T. 2013a, ApJ, 763, 139 Dzib, S. A., Rodríguez, L. F., Medina, S.-N. X., Loinard, L., Masqué, J. M., Kurtz, S., & Qiu, K. 2014, A&A, 567, L5 Dzib, S. A., Rodríguez-Garza, C. B., Rodríguez, L. F., Kurtz, S. E., Loinard, L., Zapata, L. A., & Lizano, S. 2013b, ApJ, 772, 151
– 13 – Elmegreen, B. G. & Lada, C. J. 1977, ApJ, 214, 725 Felli, M., Taylor, G. B., Catarzi, M., Churchwell, E., & Kurtz, S. 1993, A&AS, 101, 127 Goto, M., Stecklum, B., Linz, H., Feldt, M., Henning, T., Pascucci, I., & Usuda, T. 2006, ApJ, 649, 299 Henney, W. J. & O’Dell, C. R. 1999, AJ, 118, 2350 Henney, W. J., O’Dell, C. R., Meaburn, J., Garrington, S. T., & Lopez, J. A. 2002, ApJ, 566, 315 Henney, W. J., Raga, A. C., Lizano, S., & Curiel, S. 1996, ApJ, 465, 216 Hoare, M. G., Purcell, C. R., Churchwell, E. B., Diamond, P., Cotton, W. D., Chandler, C. J., Smethurst, S., Kurtz, S. E., Mundy, L. G., Dougherty, S. M., Fender, R. P., Fuller, G. A., Jackson, J. M., Garrington, S. T., Gledhill, T. R., Goldsmith, P. F., Lumsden, S. L., Martí, J., Moore, T. J. T., Muxlow, T. W. B., Oudmaijer, R. D., Pandian, J. D., Paredes, J. M., Shepherd, D. S., Spencer, R. E., Thompson, M. A., Umana, G., Urquhart, J. S., & Zijlstra, A. A. 2012, PASP, 124, 939 Kawamura, J. H. & Masson, C. R. 1998, ApJ, 509, 270 Kennedy, M., Dougherty, S. M., Fink, A., & Williams, P. M. 2010, ApJ, 709, 632 Lada, C. J., Gottlieb, C. A., Gottlieb, E. W., & Gull, T. R. 1976, ApJ, 203, 159 Lightfoot, J. F., Deighton, D. W., Furniss, I., Glencross, W. M., Hirst, C. J., Jennings, R. E., & Poulter, G. 1984, MNRAS, 208, 197 Miotello, A., Robberto, M., Potenza, M. A. C., & Ricci, L. 2012, ApJ, 757, 78 Mücke, A., Koribalski, B. S., Moffat, A. F. J., Corcoran, M. F., & Stevens, I. R. 2002, ApJ, 571, 366 Ortiz-León, G. N., Loinard, L., Rodríguez, L. F., Mioduszewski, A. J., & Dzib, S. A. 2011, ApJ, 737, 30 Panagia, N. & Felli, M. 1975, A&A, 39, 1 Rauw, G., Nazé, Y., Gosset, E., Stevens, I. R., Blomme, R., Corcoran, M. F., Pittard, J. M., & Runacres, M. C. 2002, A&A, 395, 499 Ricci, L., Robberto, M., & Soderblom, D. R. 2008, AJ, 136, 2136
– 14 – Rodríguez, L. F., Masqué, J. M., Dzib, S. A., Loinard, L., & Kurtz, S. E. 2014, Rev. Mexicana Astron. Astrofis., 50, 3 Stecklum, B., Henning, T., Eckart, A., Howell, R. R., & Hoare, M. G. 1995, ApJ, 445, L153 Stecklum, B., Henning, T., Feldt, M., Hayward, T. L., Hoare, M. G., Hofner, P., & Richter, S. 1998, AJ, 115, 767 Vink, J. S., de Koter, A., & Lamers, H. J. G. L. M. 2001, A&A, 369, 574 Wood, D. O. S. & Churchwell, E. 1989, ApJ, 340, 265 Woolf, N. J. 1961, PASP, 73, 206 Zapata, L. A., Rodríguez, L. F., Kurtz, S. E., & O’Dell, C. R. 2004, AJ, 127, 2252
This preprint was prepared with the AAS LATEX macros v5.2.
– 15 –
Dec (J2000)
-24°22'42.0"
Dec (J2000)
-24°22'42.0"
6.0 cm
1986.3
2.0 cm
1988.1
RA (J2000) 6 cm 1995.7
RA (J2000) 1995.7 3.6 cm
RA (J2000) 2.0 cm 1996.1
RA (J2000) 1.3 cm 1996.1
RA (J2000) 2.0 cm 1997.0
RA (J2000) 2003.5 6.0 cm
RA (J2000) 2003.5 3.6 cm
RA (J2000) 2005.3 1.3 cm
RA (J2000) 1.3 cm 2014.4
44.0"
46.0" -24°22'42.0"
Dec (J2000)
1985.3
44.0"
46.0"
44.0"
46.0" -24°22'42.0"
Dec (J2000)
6.0 cm
44.0"
46.0"
40.60s
18h03m40.40s 40.60s
RA (J2000)
18h03m40.40s 40.60s
RA (J2000)
18h03m40.40s
RA (J2000)
Fig. 1.— VLA emission maps of the G5.97 region observed at several bands and epochs (gray scale and contours). Contours are -4,-3, 3, 4, 5, 7, 10, 15 and 20 times the rms noise level of each map (see Table 1). The beam is shown in the bottom right corner. The two crosses show the position of G5.97 (SE) and Her 36 (NW) derived in the map obtained with superuniform weighting of the observations carried out at 1.3 cm on May 2014 shown in Fig. 3.
– 16 –
July 2003
0.30 0.15 0.00
-24°22'44.0" Dec (J2000)
0.15 0.30 0.45
45.0"
0.60 0.75 0.90
40.60s
18h03m40.50s RA (J2000)
Fig. 2.— Maps of spectral index distribution in G5.97 obtained with the 6 (red contours) and 3.6 cm (black contours) bands observed during July 2003. The maps were obtained with the same UV range (from 50 to 600 kλ) and restored with the same synthesized beam (0.7500 × 0.3500 and P.A. 1.5◦ ). The contours are always 3, 5, 10 and 20 times the rms noise of each map (0.32 mJy 3.6 cm and 0.65 mJy at 6 cm). The cross marks the G5.97 position shown in Fig. 1. The beam is shown in the bottom right corner.
– 17 –
Dec (J2000)
-24°22'42.6"
Her 36 Main
42.8" SE
43.0" 40.36s
Dec (J2000)
-24°22'44.0"
40.34s 18h03m40.32s RA (J2000)
G5.97
44.2" 44.4" 44.6" 40.52s 18h03m40.50s RA (J2000)
Fig. 3.— Upper panel : Zoom around Her 36 of the 1.3 cm continuum map corresponding to the observations of 2014 May constructed with superuniform weighting (gray scale and contours). The two crosses corresponds to the SE (southeast) and Main (northwest) components of Her 36. Lower panel : The same as the upper panel but around the G5.97 proplyd. In both panels, contours are -3, 3, 4, 6, 10, 18 and 30 times the rms noise level of the map (0.45 mJy beam−1 ). The synthesized beam of the map is shown in the bottom left corner of the lower panel.
– 18 –
Table 1: Summary of the observations taken from the VLA archive.a
Date 1985 Apr 8 1986 Apr 27 1988 Jan 22 1995 Sep 25 1996 Jan 23 1996 Dec 24 2003 Jul 5 2005 May 5 2014 May 28 a The
Conf. B A B BnA BnA CnB CnB A A A B A
Project AG178 AW158 AT089 AH557 AH557 AH557 AH557 AH605 AB1094 AB1094 AK586 14A-481
λ (cm) 6.0 6.0 2.0 6.0 3.6 2.0 1.3 2.0 6.0 3.6 1.3 1.3
Pointing α (J2000) 18h 03m 39.s 077 18h 03m 41.s 666 18h 03m 40.s 766 18h 03m 41.s 565 18h 03m 41.s 565 18h 03m 41.s 565 18h 03m 41.s 565 18h 03m 40.s 514 18h 03m 40.s 000 18h 03m 40.s 000 18h 03m 40.s 000 18h 03m 40.s 500
center δ (J2000) −24◦ 230 10.00 74 −24◦ 220 40.00 57 −24◦ 220 40.00 62 −24◦ 220 38.00 56 −24◦ 220 38.00 56 −24◦ 220 38.00 56 −24◦ 220 38.00 56 −24◦ 220 44.00 08 −24◦ 220 40.00 00 −24◦ 220 40.00 00 −24◦ 220 40.00 00 −24◦ 220 44.00 40
Phase Calibrator 1748-253 1808-209 NRAO530 1730-130 1730-130 1730-130 1730-130 1730-130 1820-254 1820-254 18210-25282 J1745-2900
Bootstraped Flux (Jy) 0.4773 ± 0.0003 0.3079 ± 0.0004 5.15 ± 0.05 5.8 ± 0.1 8.8 ± 0.1 11.8 ± 0.1 14.36 ± 0.02 17.04 ± 0.13 0.7022 ± 0.0006 0.759 ± 0.002 0.782 ± 0.003 0.992 ± 0.001
Rms noise (10−4 Jy beam−1 ) 4.5 5.1 4.2 5.0 5.7 5.5 7.3 1.7 2.5 1.2 3.2 0.5
data are from the VLA archive, with the exception of the May 2014 data that was taken by us with the Jansky Very Large Array.
– 19 –
Table 2: Parameters of the radio source associated with Her 36 SE.a α (J2000)b (18h 03m ) – – 40.338s – – – – 40.338s – 40.340s 40.337s 40.346s
δ (J2000)b (−24◦ 220 ) – – 4200.86 – – – – 4200.92 – 4200.97 4200.99 4200.83
Position Uncertaintyc (00 ) – – 0.14 – – – – 0.13 – 0.07 0.13 0.02
Sν (mJy) ≤ 1.35 ≤ 1.53 1.78 ± 0.42 ≤ 1.50 ≤ 1.71 ≤ 1.65 ≤ 2.19 1.79 ± 0.40 ≤ 0.75 0.91 ± 0.12 1.45 ± 0.32 1.22 ± 0.05
Epoch 1985.3 1986.3 1988.1 1995.7 1995.7 1996.1 1996.1 1997.0 2003.5 2003.5 2005.3 2014.4
λ (cm) 6.0 cm 6.0 cm 2.0 cm 6.0 cm 3.6 cm 2.0 cm 1.3 cm 2.0 cmd 6.0 cm 3.6 cm 1.3 cm 1.3 cme
a
Assuming that the source is not resolved. Peak position measured on the map. c Obtained using the expression θs /(Speak /rms), where θs is the source size that, being unresolved, corresponds to the beamsize, and Speak is the peak emission of Her 36 that is equivalent to Sν , given in column 4. Finally, rms is the root mean square noise of the image. d We used the map restored with the beam of the January 1988 observations at 2.0 cm. e We used the map restored with the beam of the May 2005 observations at 1.3 cm. b
Table 3: Parameters of G5.97 resulting from a Gaussian fit (see text).a α (J2000) (18h 03m ) 40.517s 40.510s 40.501s 40.515s 40.505s 40.498s 40.486s 40.501s 40.505s 40.503s 40.501s 40.508s a b c d
δ (J2000) (−24◦ 220 ) 4400 .31 4400 .54 00 44.29 4400 .26 4400 .24 4400 .50 4400 .50 00 44.40 4400 .43 4400 .50 00 44.46 4400 .34
Position Uncertainty (s ,00 ) (0.001 , 0.03) (0.001 , 0.02) (0.001 , 0.02) (0.002 , 0.02) (0.002 , 0.02) (0.002 , 0.04) (0.003 , 0.04) (