employs image registration in order to align images quasi-simultaneously acquired from different video ... small, simple, cheap sensor nodes that cooperatively.
WSEAS TRANSACTIONS on COMPUTERS
Daniela Fuiorea, Vasile Gui, Dan Pescaru, Petronela Paraschiv, Istin Codruta, Daniel Curiac and Constantin Volosencu
Video-based Wireless Sensor Networks Localization Technique Based on Image Registration and SIFT Algorithm DANIELA FUIOREA*, VASILE GUI*, DAN PESCARU**, PETRONELA PARASCHIV*, ISTIN CODRUTA**, DANIEL CURIAC**, CONSTANTIN VOLOSENCU** * Faculty of Electonic and Communication, **Faculty of Automation and Computers “Politehnica” University of Timisoara 2 V. Parvan, 300223 Timisoara ROMANIA * {daniela.fuiorea, vasile.gui}@etc.upt.ro, **{dan.pescaru, codruta.istin}@cs.upt.ro, {daniel.curiac, constantin.volosencu}@aut.upt.ro Abstract: - Localization discovery techniques are required by most Wireless Sensor Networks applications. Moreover, in case of video surveillance, localization includes not only spatial coordination but also cameras direction and video-field overlap estimation. Accurate methods involve expensive and power consuming hardware. This paper presents an efficient node localization including video-field overlap estimation that employs image registration in order to align images quasi-simultaneously acquired from different video sensors. A SIFT algorithm is used to discover common features between pairs of images. Experimental and simulation evaluation shows the estimation accuracy comparing with a manual approach.
Key-Words: - wireless sensor networks, topology, localization, deployment, image processing, image registration, SIFT After sensor network is distributed randomly in a given region a very first step consists in selflocalization. Precise GPS-based solutions are not feasible due to expensive and power consuming hardware involved [6]. Therefore several alternative methods were proposed [7], [8]. Video-based Wireless Sensor Networks are a special kind of wireless sensor networks in which large amounts of video data are sensed, processed in real-time, and then transferred over the wireless network. In this paper we propose a novel technique of node localization designed for Video-based Wireless Sensor Networks. Video is an important medium for the observation of a variety of phenomena in the physical world. For example, in the cameras can be used to monitor different activities as evaluate land erosion or observe a variety of animal species. Due to the fact that cameras from a Video-based WSN can exist in a great number, the pictures gathered from them could contain images with a common field of view, images that are taken from different position and angles. A reconstruction of the scene would imply combining these images in order to give us a panoramic view over environment. Therefore, an image registration task is involved. However,
1 Introduction Wireless Sensor Networks (WSNs) consist of many small, simple, cheap sensor nodes that cooperatively monitor physical environment. They operate in the absence of a pre-deployed infrastructure, are selfconfigurable, low cost, can be rapidly deployed and can work in hostile scenarios. The sensors interact with the surroundings monitoring and measuring light, heat, position, movement, chemical presence, etc. The information collected is then delivered to the other nodes over the wireless network. Wireless Sensor Networks have applications in various fields such as emergency rescue, environmental monitoring [1], military operations, medical monitoring and industrial systems [2]. But WSNs impose unique challenges in terms of power consumption [3], network protocols [4], efficient data processing and aggregation [5], lifetime and connectivity preservation. Furthermore, most WNSs applications highly depend on the capacity of the networks to determine their nodes’ locations. Indeed, location is assumed known in the realization of many network operations such as routing or security protocols. Therefore significant research work has focused on developing efficient node localization techniques. ISSN: 1109-2750
990
Issue 7, Volume 7, July 2008
WSEAS TRANSACTIONS on COMPUTERS
Daniela Fuiorea, Vasile Gui, Dan Pescaru, Petronela Paraschiv, Istin Codruta, Daniel Curiac and Constantin Volosencu
information gathered by this task will add to basic node localization useful information like cameras’ direction and field of view. The approach investigated here analyzes the opportunity of using an automatic feature selection as a base for image registration localization. The rest of the paper is organizes as following. Section 2 provides an overview of existing localization techniques. Image registration is presented in Section 3. Next section describes how the registration is performed using a SIFT algorithm. Section 5 presents evaluation results on real world images. Finally, conclusions of this work are presented in the last section.
by using the maximum likelihood (ML) algorithms. Various ML algorithms were developed. The bestknown examples are Multiple Signal Classification (MUSIC) [11] and Conjugate Estimation of Signal Parameters by Rotational Invariance Techniques (CESPRIT) [12]. Distance related measurements are based on propagation time or radio signal strength. In the first case one possibility is to estimate distances between neighboring sensors using time-of-arrival. It represents the propagation time of a signal between the transmitter and the receiver. Therefore it requires the local time at the transmitter and the local time at the receiver to be accurately synchronized. This disadvantage makes time-toarrival time measurements a less attractive [13]. An improved technique is called roundtrip propagation time. It measures the difference between the time when a sensor sends a signal and the time when the answer is received at the original sensor. Since the same clock is used to compute the time synchronization problem is avoided. However, a major error source in roundtrip propagation time measurements is the delay required for handling the signal in the second sensor [14]. Another interesting approach to distance measurements is the lighthouse approach [15] which derives the distance between an optical receiver and a transmitter of a parallel rotating optical beam by measuring the time duration that the receiver dwells in the beam. Weak points of this approach are the cost of optical sensor and requirements of a direct line-of-sight between the optical receiver and the transmitter. Another category of distance related measurement techniques estimates the distances between neighboring sensors from the received signal strength. They are attractive because they require no additional hardware. However, depending of the deployment environment the propagation of a signal is affected by reflection, diffraction and scattering [16]. As concerning RSS profiling-based localization, it works by constructing a form of map of the signal strength behavior in the coverage area. The map is obtained either offline by a priori measurements or online using sniffing devices [17] deployed at known locations. They have been mainly used for location estimation in WLANs, but they would appear to be attractive also for wireless sensor networks. The model is stored in a central location. By referring to the RSS model, a non-anchor node can estimate its location using the RSS measurements from anchors.
2 WSN Localization Techniques As presented before, sensor nodes of a WSN are usually deployed in a random, ad-hoc manner. Often they are scattered from an airplane or moving vehicle on an unplanned infrastructure. The key problem of estimating spatial-coordinates of network nodes is referred as topology extraction or localization. A simple solution uses GPS at the level of each node. However, this can work only outdoors and, as the receiver is expensive, large and power consuming, it is not suitable for the construction of small, cheap and energy efficient sensor nodes. Indeed, many localization methods estimate the locations of sensors by using knowledge of the absolute positions of only a few GPS-based sensors based on inter-sensor distance measurements [9]. Moreover, advanced techniques are proposed to reduce the power consumption required by localization phase [10].
2.1 Distance Measurement Algorithms Distance measurement algorithms are used to estimate relative position for network nodes. A coarse classification of these algorithms contains three main categories: angle-of-arrival measurements, distance related measurements and RSS profiling measurements. The angle-of-arrival measurement techniques can use the receiver antenna’s amplitude response or they can consider the receiver antenna’s phase response. The accuracy of these techniques is limited by the directivity of the antenna, by shadowing and by multi-path reflections. A multipath component may appear as a signal arriving from an entirely different direction and can lead to very large errors in AOA measurements. Multi-path problems in AOA measurements can be addressed
ISSN: 1109-2750
991
Issue 7, Volume 7, July 2008
WSEAS TRANSACTIONS on COMPUTERS
Daniela Fuiorea, Vasile Gui, Dan Pescaru, Petronela Paraschiv, Istin Codruta, Daniel Curiac and Constantin Volosencu
energy level and the hop-count until the server. To obtain energy-efficiency, when node energy is over 50% no restrictions are considered in electing a node as next hop. When energy node is between 20%-50% the node will be elected as next hop only if there aren’t other nodes (also neighbors of the current node) with lower hop-count and energy level over 20% or nodes with equal hop-count but in the same or lower major energy level. If we have more than one candidate as possible next hop we will use a LRU like algorithm to impose equal energy consumption for neighbors. At server request the sensor nodes will send back an image captured by node's camera. The server makes a single multicast request available for all nodes connected inside the network. Due the deployment density, a request from server will be received by a node possibility multiple times. In order to avoid sending same image twice, each request has a unique ID. Then, the message containing node's response will be sent back to the server using the most energy-efficient path with network integrity preservation. The most energyefficient path is considered the path with the lowest hop-count to server having enough energy to cover communication. After receiving all nodes images localization involves image registration applied against each pairs of them. Furthermore, to accomplish the registration task for a pair of corresponding images the first step is the feature selection. Considering the features detected, a transformation is found and each point in one image is mapped to a point in the considered pair of it. The first version of our localization algorithm has used manually selection of the corresponding features. Indeed, it was based on detecting corners by a simply click of the mouse on the images. For this, we need a human operator to interact with the mouse in choosing the corresponding pairs of feature points in the images. After evaluation the algorithm was still affected by small errors (1 to 5 pixels) specific to correspondence point setting procedure. To deal with these errors a post-processing step was required. Therefore, a chamfer-matching postprocessing was considered [20]. However, as suggested above the main drawback of the method consists in large amount of time involved. The work presented here is motivated by the need of an fast automatic extraction of corresponding points as the starting point for registration.
2.2 Localization in Context of Video-based Wireless Sensor Networks In context of video-based Wireless Sensor Networks the localization problem is more complex. In addition to nodes coordinates the information regarding topology includes the angles between cameras and video fields overlapping. Indeed, these extra parameters are essential for most video surveillance applications. In [18] we propose an earlier version of a solution for node localization and video-filed overlap estimation. It starts from video images acquired from different nodes and computes video fields superposition with the help of a central server (could be a PC or a notebook). Then it computes parameters like coordinates translation, rotation angle and scaling factor and diffuses the extracted information into the entire network. Node localization is based on estimation of these parameters between each pair of neighbor nodes. First a setup protocol is used to collect video data from entire network and allow a central sink to calculate all necessary transformation parameters between each pair of cameras. These parameters are then distributed back to the network and used by nodes to cooperate in object tracking work. Same time, the server is able to estimate the fine-grained localization based on scaling factor. This set-up phase represents the initial step after the node deployment. However, this phase could by repeated time to time to ensure configuration update. The protocol is derived from LAR [19] and Direct Diffusion [4]. It has a dual scope. The first one is to fill routing tables, maintained by each node, with information about proximity and hop count to the central point. The second is to query the nodes for synchronously image information used to extract topology. The central server broadcasts a setup message containing empty route path information. Each node that receives a setup message will determine if itself is included or not in the route information. If included, it simply drops the message. It not, it refreshes its routing table from the message routing information and broadcasts the message further. Same time, it starts a timer that manage the image capturing. Nodes are both routers and end points in the same time. Each nodes help server requests to be propagated to the entire network by forwarding the request to its neighbors. Also images that are sent to the server are routed back to the server in an energyefficient manner that preserves network integrity. Each node keeps simple routing information that will describe each of its neighbors by its current ISSN: 1109-2750
992
Issue 7, Volume 7, July 2008
WSEAS TRANSACTIONS on COMPUTERS
Daniela Fuiorea, Vasile Gui, Dan Pescaru, Petronela Paraschiv, Istin Codruta, Daniel Curiac and Constantin Volosencu
multivariate probability density function p(x), it estimates the density at the vector (point) x as:
3 Image Registration Image registration is a basic image processing operation employed by many computer vision applications used in areas such as remote sensing, biomedical imaging, surveillance and robotics [21]. Its goal is to overlay two or more images of the same scene taken at different times, from different viewpoints, and/or by different cameras. In order to register two images, a transformation must be found so that each point in one image (reference image) can be mapped to a point in the second (sensed image). In other words, registration optimally aligns two images. Due to the diversity of images to be registered and various types of degradations encountered (mainly caused by transmission errors), it is impossible to design a universal method applicable to all registration tasks. Every method should consider not only the assumed type of geometric deformation between images but also radiometric deformations and noise corruption, required registration accuracy and applicationdependent data characteristics. In the context of general real-life images the registration problem is difficult and prone to errors like noise, small movements or various reflections. Therefore robust estimation methods are needed to cope with point correspondence errors. One of the first robust estimators proposed for image registration was the RANSAC [22]. More recently the M-estimators-based solution and a related scheme that relies on kernel-based estimators received much attention in the research community [23]. The two methods have complementary merits. The M-estimators scheme finds good solutions but requires a good initial estimate to converge correctly. RANSAC does not need to start from an initial estimate [24], but the solution does not consider all the available data, reducing its precision. In this work we use a mean shift based solution [25] for robust parameters like coordinates translation, rotation angle and scaling factor estimation. Like RANSAC, the Mean Shift Estimator method does not require an initial estimation and like the M-estimators scheme, it makes a better use of the available data samples. The Mean Shift Estimator is based on the mean shift algorithm, a fast and robust method to detect local maxima of a multivariate probability density. Mean Shift Estimator allows us to find the parameters of the geometric transform aligning two images as the parameters with the highest probability density in the solution space. Starting from a sample of N d-dimensional data points, xi, drawn from a distribution with ISSN: 1109-2750
pˆ H (x) = where
1 N
N
∑K i =1
H
(x − x i ) ,
(
K H (x ) =| H |−1 / 2 K H H −1 / 2 x
(1)
)
(2)
is the kernel function depending on the symmetric positive definite d×d matrix H, called bandwidth matrix. Frequently H has a diagonal form or even the form H= h2I, assuming the same scale h for all dimensions, i.e. a single scale parameter. In this case, an isotropic estimator, Kh is used. A radially symmetric estimator can be generated starting from a 1D kernel function K1 as:
K R (x ) = αK1 (|| x ||) ,
(3)
with α is a strictly positive constant chosen such that the kernel function integrates strictly to 1. The profile of the radially symmetric kernel is defined as:
K R (x ) = ck (|| x || 2 ) ,
(4)
where c is a normalization constant. Starting from any location y0, a gradient ascent mean shift algorithm [17] can be used to find the location of the maxima of the estimated PDF closest to the starting location. This can be simply done by iterating until convergence the equation
⎛ y j − xi 2 ⎞ ⎜ ⎟ g x ∑ i ⎟ ⎜ h i =1 ⎝ ⎠, = 2 n ⎛ y j − xi ⎞ ⎟ g⎜ ∑ ⎜ ⎟ h i =1 ⎝ ⎠ n
y j +1
j = 1,2,...
(5)
where
g ( x) = − k ' ( x) .
(6)
In practice the convergence is very fast, typically only two or three iterations being needed.
3.1 The Registration Model A widely used 2D geometric transformation in image registration is the similarity transform, consisting of rotation, translation and scaling. The model is defined by the equations:
⎡u ⎤ ⎡ s 1⎤ ⎡cos(ϕ ) − sin(ϕ )⎤ ⎡ x ⎤ ⎡t x ⎤ ⎢ v ⎥ = ⎢1 s ⎥ ⎢ sin(ϕ ) cos(ϕ ) ⎥ ⎢ y ⎥ + ⎢t ⎥ , (7) ⎣ ⎦ ⎣ ⎦⎣ ⎦⎣ ⎦ ⎣ y ⎦
993
Issue 7, Volume 7, July 2008
WSEAS TRANSACTIONS on COMPUTERS
Daniela Fuiorea, Vasile Gui, Dan Pescaru, Petronela Paraschiv, Istin Codruta, Daniel Curiac and Constantin Volosencu
Considering {φi}, i = 1,2,….,M as the set of M angles obtained from pairs of points, the rotation angle is defined as the highest density location obtained by the 1D mean shift algorithm (d =1) applied on all data angle data samples available. In a similar manner, scale factor estimates can be obtained from the sets of pairs of points using the following equation:
relating the old pixel coordinates (x, y) to the new ones. As this transform preserves the angles and curvatures, it has been named “shape-preserving mapping”. The four parameters of the transformation can be unambiguously determined from the correspondence of two pairs of points. However, in most of the cases, the number of the points available for estimating the transformation parameters s, φ, tx and ty is higher. By denoting the vector of parameters as
⎡s⎤ ⎢ϕ ⎥ x = ⎢ ⎥, ⎢t x ⎥ ⎢ ⎥ ⎣⎢t y ⎦⎥
s = ||vij||/||qij||.
After performing the inverse geometrical transform to compensate scale and rotation angle, robust translation vector component estimation is performed by point correspondences. Each pair of points generates pair of translation parameters. The same mean shift algorithm is used to find the best estimates of the translation vector.
(8)
the problem of estimating the geometric transformation can be formulated as the problem of minimizing a measure of the fitting error of the available data points:
x = arg min ∑ ρ (ri ) , 1 424 3 i
(11)
(9)
x
where the residuals ri represent the matching error between a pair of corresponding features after registration. (a)
3.2 Computation of the Rotation Angle, Scale Factor and Translation Vector Components The proposed algorithm starts from the observation that the angle between two line segments is not changed by translation or rescaling. Therefore, the rotation parameter, φ can be estimated based on such angles prior to estimating the translation or rescaling parameters. Rescaling parameter estimation can also be performed prior to translation or rotation estimation, based on the distances between known pairs of points. The translation vector components have to be calculated after the rotation and rescaling parameters have been estimated and compensated for. A minimal set of points is necessary to estimate the transformation parameters. For rotation angle estimation, the minimal set is defined by two pairs of points (Qi, Qj) and (Vi, Vj), and is represented by the corresponding vectors qij and vij. The angle between the two lines that connect (Qi, Qj) and (Vi, Vj) respectively is given by the equation: q Tij v ij (10) cos(ϕ) = T T q ij v ij
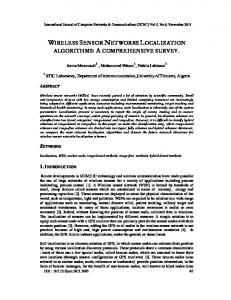
(b) Fig. 1. Chamfer Matching post-processing: (a) Images Difference before post-processing; (b) Images Difference after chamfer matching
3.3 Post-Processing Adjustments After registration, the result is still affected by small errors (1 to 5 pixels). To deal with these errors a post-processing step is required. We consider a Chamfer Matching method as the best one in our case. Chamfer Matching is an edge matching technique, which was first proposed by Barrow [26]
where xT denotes transpose of vector x.
ISSN: 1109-2750
994
Issue 7, Volume 7, July 2008
WSEAS TRANSACTIONS on COMPUTERS
Daniela Fuiorea, Vasile Gui, Dan Pescaru, Petronela Paraschiv, Istin Codruta, Daniel Curiac and Constantin Volosencu
and then refined by Borgefors [20]. It involves several steps. First the distance transformation is computed and the distance map is produced starting from the upper right corner. The pattern we are looking for is then moved over the relief defined by the distance map. Under the action of gravity, the pattern slides over the relief until it reaches the lowest possible altitude. If this altitude is zero or close to zero, an optimal matching pattern was found in the image. More formally, the matching criterion is the correlation of the searched pattern with the distance map. The pattern is located where this correlation reaches an absolute minimum. The hierarchical Chamfer matching method proposed by Borgefors is relaying on a resolution pyramid. The matching is done not only in the original image resolution but also in a series of images, where each image is a representation of the original scene at a lower resolution. Poor local minima are rejected. The remaining positions are considered at next higher resolution level of the pyramid, and the procedure is repeated until local minima are found at the highest resolution level of the pyramid. However, due the small correction – 1 to 5 pixels – required in our case, the computation overhead of hierarchical matching is not justified. Fig. 1 depicts the result of chamfer postprocessing. It can be seen how the original result presented in Fig. 1a is improved in Fig. 1b when using chamfer post-processing.
4 Registration using Feature Selection for Estimation
the images are computed. The second step is identifying feature correspondences in pairs of images. And the last step is estimating parameters of geometrical transforms optimally mapping features between pairs of images. Feature selection can be carried out in two ways. We can select feature correspondences manually, using only the button of the mouse or we can select automatically using an algorithm for feature detection. The automatic selection is based on a SIFT feature selection algorithm. SIFT is coming from Scale-Invariant Feature Transform which is an algorithm in computer vision to detect and describe local features in images. These local features are invariant to image scale and rotation. They are also robust to changes in illumination, noise, occlusion and minor changes in viewpoint. In addition to these properties, the local features given by SIFT are distinctive, easy to extract, allow for correct object identification with low probability of mismatch and are easy to match against a (large) database of local features and they can be used for matching. In order to generate a set of image features four steps of computation are used: • Scale-space extrema detection • Key-point localization • Orientation assignment • The local image descriptor An important aspect of this approach is that it generates large numbers of features that densely cover the image over the full range of scales and locations. After one of these steps is accomplished, the next step based on a robust estimation method gives the best estimate of the parameters of geometrical transform, mapping features between pairs of images.
Automatic Parameter
The correspondence between the features can be classified in two categories: feature-based and region-based. Due to the fact that the region-based registration is prone to errors generated by segmentation and different color sensitivities of the cameras, image point features can be used instead. This approach has been shown to be more robust with viewpoint, scale and illumination changes, and occlusion. Feature selection can be carried out manually or automatically. While first approach involves a human operator, the second one uses a SIFT derived algorithm [27]. Unfortunately, even is more precise, first approach is to slow in case of a real world application involving thousands of nodes. The point mapping technique is a primary approach taken to register two images that type of misalignment is unknown. The general method consists of three steps. In the first step features in
ISSN: 1109-2750
5 Testing Results In order to test the performances of the automatic selection, we used image pairs containing a common field of view, obtained for different camera positions and orientations. As test bed we use a five TRENDNET IP-400W wireless camera nodes network.
995
Issue 7, Volume 7, July 2008
WSEAS TRANSACTIONS on COMPUTERS
Daniela Fuiorea, Vasile Gui, Dan Pescaru, Petronela Paraschiv, Istin Codruta, Daniel Curiac and Constantin Volosencu
The real world applications could be deployed in various environments. However, we identify three common situations for most applications. First is represented by nature scenes, like forests or desert; the second is city landscapes, like squares or intersections; and the last is indoor, like rooms or passage. Due to this fact, the experiments were realized with images considering these environments. Consequently, the images were split in three categories: forest, office and urban landscape. Fig. 2, Fig. 3 and Fig. 4 depict some examples involving two overlapped sensors deployed in each of considered environments.
(Sensor 1)
(Sensor 2) Fig. 2 Feature Point Extraction in a Natural Environment. (Sensor 1)
(Sensor 2)
(Sensor 1)
Fig. 4 Feature Points Extraction in an Urban Environment
For each image, the selection was made automatic and manual for different number of feature points. Each method is tested on 15 images (5 images x 3 categories). The parameters of the similarity transform (s, φ, tx and ty), which are resulting from using manual selection, are considered as the ideal ones. All comparisons use a relative error computed with the equation:
(Sensor 2) Fig. 3 Feature Points Extraction in an Office Environment. ISSN: 1109-2750
996
Issue 7, Volume 7, July 2008
WSEAS TRANSACTIONS on COMPUTERS
err =
Daniela Fuiorea, Vasile Gui, Dan Pescaru, Petronela Paraschiv, Istin Codruta, Daniel Curiac and Constantin Volosencu
( x − y) *100, dim
A trimmed mean is calculated by discarding a certain percentage of the lowest and the highest values of the relative error followed by computing the mean of the remaining values.
(12)
where x is the ideal value, obtained from using the manual selection, y is the value obtained from using the automatic method and dim is the horizontal dimension of the image for x and y translation, 1 for scale parameter and π for angle parameter. This equation is applied to every parameter of the similarity transform. Equation (12) quantifies the deviation of the automatic method from the manual method, considered ideal. The resulting values are presented in Table 1. Small deviation errors are present for the scale and angle estimate in all three categories. Horizontal and vertical translation estimate presents small errors for pictures with office and urban environment. The worst case is for the horizontal translation estimate, where the worst-case error is about 32%. The best results are obtained for scale and angle on urban images which contain buildings. The vertical translation estimate presents a relative highest error, 6.51%, when an indoor image is used.
Table 2 The Trimmed Mean Value (in percentage) Parameters of the of similarity transform Translation X Translation Y Scale Angle
Parameters of the of similarity transform Translation X Translation Y Scale Angle
32 6.51 4.41 0.96
0.71 0.83 0.66 0.23
0.001 0.021 0.06 0.012
computing by sorting all the N values, discarding α % of the lowest and α % of the highest values, and computing the mean of the remaining values. In our case, to calculate a trimmed mean α % = 6.66 % for a set of values N=15, steps are the following: • Step 1. Sort the values. • Step 2. Discard 20% of the largest values and 20% of the smallest values. • Step 3. Compute the mean of the remaining values.
Forest Img1
Img2
Img3
Img4
Img5
32 0.36 0.064 0.049
1.7 1.46 0.42 0.24
0.07 0.08 0.90 0.35
0.67 0.29 0.49 0.28
0.35 1.43 0.41 0.46
The idea of a trimmed mean is to eliminate outliers, or extreme observations that do not seem to have any logical explanations in calculating the overall mean of a distribution. Table 3 The Execution Time
Office Img1
Img2
Img3
Img4
Img5
1.58 0.64 0.33 0.18
0.39 3.18 2.06 0.19
0.98 0.08 1.8 0.96
1.69 0.79 0.06 0.072
0.19 6.51 4.46 0.79
Parc 4’10”
Manual 25 pts Office Urban 3’10” 2’10” 15 pts 1’30” 1’30”
Parc 15” 14”
Automatic 25 pts Office Urban 12” 9” 15 pts 11” 8”
Urban Img1
Img2
Img3
Img4
Img5
0.001 0.50 0.18 0.013
0.70 0.59 0.22 0.16
0.14 0.19 0.28 0.012
0.55 1.19 1.13 0.16
0.17 0.021 0.35 0.11
Table 3 presents the time measurement for each category in the case of 25 points and 15 points. In a real WNS the number of gather images is large. Based on the measurements from the Table III, we can estimate the time involved by a real application. Suppose we gather 500 pairs of images. When the number of considered points is 25 and the selection is manually, the registration process will take about 4’10” x 500 pairs of images resulting in 35 hours. When the feature selection is automatic, the estimated time for registration process will be 15”x
The highest and the lowest values of the error are presented in Table 2, along with the trimmed mean for every parameter of the similarity transform.
ISSN: 1109-2750
Lowest value
The trimmed mean is a family of measures. The
3’5” Parameters of the of similarity transform Translation X Translation Y Scale Angle
Trimmed mean
α % - trimmed mean of N values x1 ,..., xn is
Table 1 The Relative Error (in percentage) Parameters of the of similarity transform Translation X Translation Y Scale Angle
Highest value
997
Issue 7, Volume 7, July 2008
WSEAS TRANSACTIONS on COMPUTERS
Daniela Fuiorea, Vasile Gui, Dan Pescaru, Petronela Paraschiv, Istin Codruta, Daniel Curiac and Constantin Volosencu
Processing Magazine, Vol. 22, No. 4, 2005, pp. 24–40. [7] C. Buschmann, H. Hellbruck, S. Fischer, A. Kroller and S. P. Fekete, Radio PropagationAware Distance Estimation Based on Neighborhood Comparison, in Proc. of the 4th European Conference Wireless Sensor Networks, EWSN 2007, Delft, Netherlands, January 29-31, 2007, pp. 325-340. [8] G. Mao, B. Fidan, and B. Anderson, Wireless sensor network localization techniques, ACM Computer Networks Journal, Vol. 51, No. 10, July 2007, pp. 2529-2553. [9] S. Guolin, C. Jie, G. Wei, and K. J. R. Liu, Signal processing techniques in network-aided positioning: a survey of state-of-the-art positioning designs, IEEE Signal Processing Magazine, Vol. 22, No. 4, 2005, pp. 12–23. [10] J. Chung, K. Cho, H. Kim, M. Choi, J. Pak, N. Ha, B. Lee, K. Han, An Efficient Topology Configuration Scheme for Wireless Sensor Networks, in Proceedings of the 6th WSEAS International Conference on Electronics, Hardware, Wireless and Optical Communications, 2007, pp. 145-150. [11] M. Kaveh and A. Bassias, Threshold extension based on a new paradigm for MUSIC-type estimation, in Proceedings of the International Conference on Acoustics, Speech, and Signal Processing, Vol. 5, 1990, pp. 2535–2538. [12] N. Tayem and H. M. Kwon, Conjugate ESPRIT (C-SPRIT), IEEE Transactions on Antennas and Propagation, Vol. 52, No. 10, 2004, pp. 2618–2624. [13] E. Elnahrawy, X. Li and R. P. Martin, The Limits of Localization Using Signal Strength: A Comparative Study, In Proceedings of the First IEEE International Conference on Sensor and Ad hoc Communications and Networks (SECON 2004), Santa Clara, CA, USA, October 2004, pp. 41-52. [14] D. McCrady, L. Doyle, H. Forstrom, T. Dempsey, and M. Martorana, Mobile ranging using low-accuracy clocks, IEEE Transactions on Microwave Theory and Techniques, Vol. 48, No. 6, 2000, pp. 951–958. [15] K. Romer, The lighthouse location system for smart dust, in Proceedings of ACM Conference on Mobile Systems, Applications, and Services, 2003, pp. 15–30. [16] E. Elnahrawy, X. Li, and R. Martin, The limits of localization using signal strength: a comparative study, in Proceedings of the First Annual IEEE Conference on Sensor and Ad-
500 pairs of images that means around 2 hours. Even considering the best case of city landscapes, for manual selection the localization time is unacceptable (around 18 hours) while the automatic selection takes just 1 hour.
6 Conclusion This paper proposes a localization algorithm based on registration applied on images gathered from network nodes. It uses an automatic features selection based on SIFT algorithm. In addition to spatial localization we estimate also the video-field overlap between each pair of camera-nodes. All processing are done on the central server and localization information is sent back into the network. Test results demonstrate the benefit of this technique in terms of execution time while loosing in precision is kept very low. The method presented in the paper may find a large application in system identification based on sensor networks [28]. References: [1] S.Y. Na, D. Shin, J.Y. Kim, Y. Won, B. Lee, Development of Autonomous and Active Monitoring Fish Robots for Water Pollution Using GPS and Ubiquitous Sensor Networks, WSEAS Transactions on Electronics, Vol. 5, 2008, pp. 1-11. [2] I. Akyildiz, S. Weilian, Y. Sankarasubramaniam, E. Cayirci, A survey on sensor networks, IEEE Communications Magazine, Vol. 40, No. 8, August 2002, pp. 102-114. [3] H. Lee, E. Kim, K. Cho, N. Ha, Y. Choi, J. Jung, K. Han, An energy-efficient data dissemination using cross topology in wireless sensor network, in Proceedings of the 8th WSEAS International Conference on Neural Networks, Vol. 8, Vancouver, Canada, 2007, pp. 48-53. [4] C. Intanagonwiwat, R. Govindan, D. Estrin, J. Heidemann, F. Silva, Directed Diffusion for Wireless Sensor Networking, IEEE/ACM Transaction on Networking, Vol. 11, No. 1, February 2003, pp. 2-16. [5] W. Su, T.C. Bougiouklis, Data fusion algorithms in cluster-based wireless sensor networks using fuzzy logic theory, in Proceedings of the 11th WSEAS International Conference on Communications, Vol. 11, 2007, pp. 291-299. [6] A. H. Sayed, A. Tarighat, and N. Khajehnouri, Network-based wireless location: challenges faced in developing techniques for accurate wireless location information, IEEE Signal
ISSN: 1109-2750
998
Issue 7, Volume 7, July 2008
WSEAS TRANSACTIONS on COMPUTERS
Daniela Fuiorea, Vasile Gui, Dan Pescaru, Petronela Paraschiv, Istin Codruta, Daniel Curiac and Constantin Volosencu
Cartography, Morgan Kaufmann Readings in Computer Vision, 1987, pp. 726-740. [23] H. Chen, P. L. Meer, D. E. Tyler, Robust Regression for Data with Multiple Structures, IEEE Conference on Computer Vision and Pattern Recognition, 2001, pp. 1069–1075. [24] V. Lepetit, P. Fua, Monocular Model-Based 3D Tracking of Rigid Objects: A Survey, Foundations and Trends in Computer Graphics and Vision, Vol. 1, No. 1, October 2005, pp. 1– 89. [25] D. Comaniciu, P. Meer, Mean Shift: A Robust Approach toward Feature Space Analysis, IEEE Transactions on Pattern Analysis and Machine Intelligence, Vol. 24, No. 5, 2002, pp.603-619. [26] H. G. Barrow, J. M. Tenenbaum, R. C. Bolles, H. C. Wolf, Parametric correspondence and chamfer matching: Two new techniques for image matching, in Proceedings of the Fifth International Joint Conference on Artificial Intelligence, Cambridge, 1977, pp. 659-663. [27] D. G. Lowe, Distinctive image features from scale-invariant key-points, International Journal of Computer Vision, Vol. 60, 2004, pp. 91-110. [28] C. Volosencu, Identification in Sensor Networks, in Automation & Information: Theory and Advanced Technology, Proceedings of the 9th WSEAS Int. Conf. on Automation and Information (ICAI’08), WSEAS Press, 2008, pp. 175÷183.
hoc Communications and Networks, 2004, pp. 406–414. [17] P. Krishnan, A. Krishnakumar, W.-H. Ju, C. Mallows, and S. Gamt, A system for LEASE: location estimation assisted by stationary emitters for indoor RF wireless networks, in Proceedings of IEEE INFOCOM’04, Vol. 2, 2004, pp. 1001–1011. [18] D. Fuiorea, V. Gui, D. Pescaru and C. Toma, Using Registration Algorithms for Wireless Sensor Network Node Localization, In Proc. of the 4th IEEE International Symposium on Applied Computational Intelligence and Informatics SACI2007, May 17-18, 2007, pp. 209-214. [19] Y. B. Ko and N. Vaidya, Location-Aided Routing (LAR) in Mobile Ad-hoc Networks, in Proceedings of The 4th ACM/IEEE Int. Conf. Mobile Computing and Networking, October 1998, pp. 66–75. [20] G. Borgefors, Hierarchical Chamfer Matching: A parametric edge matching algorithm, IEEE Transaction on Transactions on Pattern Analysis and Machine Intelligence, Vol. 10, No. 6, 1988, pp. 849-865. [21] B. Zitova, J. Flusser, Image registration methods: a survey, Image Vision and Computing 21, Elsevier, 2003, pp. 977-1000. [22] M. A. Fischler, R. C. Bolles, Random Sample Consensus: a Paradigm for Model Fitting with Applications to Image Analysis and Automated
ISSN: 1109-2750
999
Issue 7, Volume 7, July 2008