Video Quality Objective Metric Using Data Hiding Mylbne C.Q. Farias, Sanjit K. Mitra
Marco Carli
University of Califomia, Santa Barbara Electrical and Computer Engineering Dept. Santa Barbara, CA 93106-9560, USA
University of Roma TRE Electrical Engineering Dept. via della Vasca Navale. 84 00146 Rome - Italy Email:
[email protected]
Email: mylene,
[email protected]
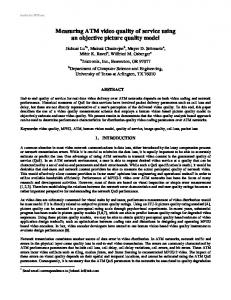
Abstracl4n this paper a non-referenceohjeclive video quality At present, no physical measure can accurately predict the metric is proposed. The quality metric is obtained by means of a quality of a video. The only way to determine it is to meanon conventional use of data hiding technique. Test data are em- sure it directly in psychophysical experiments with human subbedded in an MPEG-2 video; the basic w m p t i o n is that the data embedded undergo under the same degradation as the host video. jects. However, psychophysical experiments are too expensive To analyze the performance of the system, a comparison between and time-consuming to be a practical method for measuring imthe results obtained using this metric and the perceived mean an- age quality. Therefore, there is an increasing interest for an noyance values was performed. The annoyance values were ob- objective quality metric, which correlates well with the human tained through a psychophysical experiment, which measured the perception of quality. In order to be used in multimedia applithreshold and mean annoyance values of compressed videos cation, this metric should be also fast and reliable. In this paper, a new objective metric using data hiding is I. INTRODUCTION proposed. The performance of the proposed metric have been Multimedia communication is becoming a reality. Two ele- compared with the results obtained for a set of compressed ments are pushing this revolution. The proliferation of Intemet videos with perceived annoyance values, obtained through a and the new commercial services that are going to be provided psychophysical experiment [I]. The goal of this research is to as streaming video, remote video database browsing, on line get a fairly good estimate of the perceptual quality of a video usbooking and so on. Also, the third generation of mobile com- ing a simple single measure. If successful, this technique could munication, which is focused on the multimedia communica- a first step in the process of reducing the cost of a system evaluation by eliminating the need of a psychophysical experiment. tion and it will allow the video on mobile handset. This paper is organized as follows. In Section II a description In the future communication framework the QoS is an issue. Therefore, the quality of the media delivered to the user needs of the embedding system is given. In Section IIIdetails of the to be measured. Since, the whole communication system is objective metric are given. In Section N the setup used for the composed by several subsystems, quality must be measured at psychophysical experimental is detailed. Section V presents the the end of each block as well as at the end of the whole system. results and section VI the conclusions. Unfortunately, due to the variety and diversity of the communication components, video quality depends on several factors 11. THE EMBEDDING SCHEME like time varying channel, image processing techniques (comSeveral embedding methods have been proposed in the literpression, enhancement, etc.), IP transmission errors, and so on. ature: the data insertion can be done in the spatial domain [4] Therefore it is important to design a system which automatically measures the quality of the media at the end of each block of the communications system as well as at the end of it. BeVdeo cause in most real-time video communication the reference is not available, the measurement used cannot require the knowledge of the reference video (original). A big effort in the scientific community is now devoted to design system able to detect and to measure the quality of a multimedia communication. The techniques used vary from using feedback control error to embedding watermarks into still images or video [2], [3]. For multimedia applications, videos are meant for human consumption and therefore humans should decide if the quality of the video is satisfactory.
I
This rerearch is suppolfed by CAPES-Braril, in part by a National Foundation G m t No. CCR-0105404. and in part by an ltillian National Rerearch Council.
0-7803-7713-3/02/$17.00 @ 2002 IEEE
Fig. 1. Block dia-
464
of the embedding system
or in an ad hoc transform domain such as the DCT (Discrete transmission itself might also introduce further artifacts. In this Cosine Transform) domain (51, the Fourier domain [6], and the paper we concentrate on the artifacts introduced by compresWavelet domain (71. sion. In this work, an image is embedded in the DCT domain. FigThe retrieval method can be summarized in this way. First, ure I depicts the block diagram of the embedding system. A the logarithm of the luminance of the received frame f: (n) is high bit rate multimedia communication system has been con- taken and its DCT is calculated: sidered: the video frame size is 720x486, in YCrCB format, 4 2 2 digital component video. The data image has a size of (4) 84x42 pixels. The embedding procedure can be summarized as follows. Second, for each frame the DCT coefficients where the mark First, a pseudo random algorithm is used to generate the was inserted are extracted and then multiplied by the corre(n1,n2),with values in the sponding pseudo-noise image. We assume that the receiver pseudo-noise image p(n), n range [-I ,I]. The pseudo-noise p(n) is normalized, and bina- knows the initial position in the DCT domain where the mark is inserted. The result is averaged for a chosen number of frames rized zj(4= (P (n) - E {P (n)}), (1) N f . The extracted binary image is obtained by applying a nonlinearity function: One pseudo-noise image is created for each frame of the video to avoid visual latency. For a generic frame of a video sequence fi(n), the final mark wi is obtained by multiplying the image I(n)by p:(n): w i)(. = I (n)pi )(. (2) Then, the log of the luminance is taken and then the DCT coefficients are computed. Taking the logarithm of the luminance has the effect of flattening its distribution allowing lower scaling values to be used in a linear manner. 'The mark is then added to the mid-frequencies DCT coefficients. In our experimental trials, the data are embedded starting from the (215, 390) DCT coefficient. Several starting points have been tested the results show that the range of frequencies where the mark is inserted is strongly dependent on the application. For the purpose of delivering a high quality video through an ideal channel, the mid-frequencies are a good choice. Inserting the data in the low-frequencies would cause visible artifacts in the image, while inserting it in the high frequencies would make it easier to remove it. The final mark is multiplied by a scaling factor a and is added to the DCT coefficients:
The Equation (3) is always invertible, i.e., an inverse function
can be computed and the original data extracted. However, a degradation of the embedded data will be present due to the DCT transformation and to the pseudo-noise image pi (n).This scaling factor a can be used to vary the strength of the mark. In various applications and video formats different values for Q are desirable. By increasing a, we also decrease the quality of the video. Experimental results show that, if other noise sources are not present, the degradation of the mark is due only to the DCT and to the pseudo-random noise image pi (n). In a previous work [SI we measured the annoyance and visibility of the artifacts introduced by the embedding system. The strength of the mark has to be chosen below the threshold of visibility. Before being transmitted the video is generally compressed (MPEG, PEG), what introduces distortions (artifacts). The
where I, (h) is a binary image. 111. VIDEO QUALITY OBJECTIVE METRIC The proposed video quality objective metric is based on the assumption that the embedded data should go through the same degradation as the host video. Therefore, the degradation of the extracted image can be used as a measure of the quality of the distorted host video. An objective measure of the degradation of the recovered data caused by the embedding procedure is obtained by calculating the mean square error of the extracted data:
E,
(I(n) - I, (.)I2,
=
(6)
n
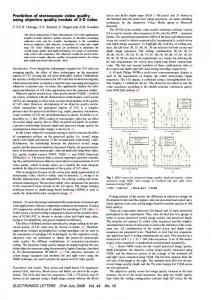
where I (n) is the original embedded image and I, (n) is the extracted image. The bigger the difference between the.extracted and the original data, the more annoying and visible are the artifacts present in the distorted video. Figure 2 depicts a graph of the objective metric obtained nsing the log of 6 versus the MSE (Mean Square Error) of the video corresponding to the video Flower. Figure 5 shows the same graph for the video Cheerleaders. As can be seen from these graphs, E, increases with MSE of the degraded video. This was true for all the videos we tested, Nevertheless, because different videos have different data hiding capacities the size the of variations is different for each .video. IV. THE PSYCHOPHYSICAL EXPERIMENT The only way to accurately predict the quality of a video it is to measure it directly in psychophysical experiments with human subjects. For any objective metric to be valuable, a good correlation with the perceivedquality is desirable. Therefore, to
465
nal to dominate), strengthen the artifact (allowing the artifact to dominate), or even exaggerate the artifact (boost the difference between the artifact and original). This procedure guarantees that the appearance of the artifacts we are testing do not change over the test sequences, only their strength varies. The basic formula for combining the videos is:
10
Y=Xo.(l-r)+r.X1
0
1”
2”
anm
4”
(7)
where Y is the result, Xo is the original, XI is the degraded sequence, and T is the scaling factor. The defects are added only to the defect zones. All other areas are not distorted. This allows checking the annoyance for different areas of the frame. To find artifact detection and annoyance values, the contrast of the error patterns must range from nearly imperceptible to highly annoying. This is obtained by varying T in (7). The set of scaling factors used is 0.24 0.32 0.42 0.57 0.75 and 1.00. The total number of test sequences used in this experiment is 95, which includes 60 test sequences (5 originals times 6 strength factors times 3 defect zones) plus the 5 original sequences. The sequences are shown in a random order during the main experiment. The total squared error (TSE) is used as our objective error measure:
”5
w_ridso
Fig. 2. Objective metric versus MSE of the video Flower
TSE = x,xi(y,(n)
- fi(n))’,
(8)
where yj is the i-th frame of the embedded video and ft is the i-th frame of the original video. Standard methods [9] are used to analyze the data provided by the test subjects and to compute the mean annoyance values. The mean annoyance values for each test sequence is fitted with the standard logistic function:
MSE-ddeo
Fig.3. Objective metric versus MSE of rhe video cteerleaders
analyze the performance of the proposed metric we compared its results with the data gathered in a psychophysical experiment [I]. In this experiment, 32 test subjects drawn from a pool of students in the introductory psychology class at UCSB were used. A Sony PW-1343 monitor was used to display the test video sequences. The experiment is run with one subject at a time. The subjects are positioned at a distance of four screen heights (80 cm) from the video monitor. Five original video sequences of assumed high quality were used Bus, Cheerleader, Flower-garden, Football and Hockey. The video clips are all 5 seconds long and contain scenes that are typical of normal television. After each video is displayed, the subject is asked to enter if he/she saw any defect. If the answer is no, no further questions are asked and the next video is shown. If the answer is yes he/she is asked to enter a value between 0 and 100; representing how annoying the defect is, compared to the worst defect present in the training sequences. To create the test sequences we first generated sequences with high level of compression ( I Mbps). Then, to generate the test sequences we linearly combined the original video and the impaired video in different proportions. By varying their relative weights, we could weaken the artifact (allowing the origi-
where y is the predicted annoyance and z is the logarithmic error energy. The parameters ymaz and ymin establish the limits of the annoyance value range. The parameter I translates the curve in the z-direction and the parameter 0controls the steepness of the curve.
V. CONCLUSIONS AND REMARKS In this paper a non-reference objective video quality metric is proposed. The quality metric is obtained by means of a non conventional use of a fragile data hiding technique. A comparison between an objective quality measure and the mean annoyance values of degraded videos is presented. Figure 4 and 5 depicts the mean annoyance curves versus the logarithmic error energy for the degraded videos originated from a 7.5Mbps MF’EG-2 compressed video using eq.9. Figure 4 corresponds to the video Cheerleaders and Figure 5 corresponds to the video Bus. The annoyance curves for every video have the same S-shape, but the parameters Z and 0 vary according to the video.
466
10 ..........................................................................
:
m i‘D
_... .....i .........+.................
:
:~ ........ ;......... :......... 1
81 .......... ....~~~~~~i ......... ;.....~~~~;~~~~ .....;.........
o,
:.
~~
~
....... / ....................
:....~
iI
P
i...... ...4
/ L;