FEATURE TRACKING WITH SMALL UAV VIDEO by ... like to thank Brandon Call for always catching my boneheaded math errors and for being able to tell ...... target center caused by the skewing of the target in the image results in the error.
VIDEO STABILIZATION AND TARGET LOCALIZATION USING FEATURE TRACKING WITH SMALL UAV VIDEO
by David L. Johansen
A thesis submitted to the faculty of Brigham Young University in partial fulfillment of the requirements for the degree of
Master of Science
Department of Electrical and Computer Engineering Brigham Young University December 2006
c 2007 David L. Johansen Copyright ° All Rights Reserved
BRIGHAM YOUNG UNIVERSITY
GRADUATE COMMITTEE APPROVAL
of a thesis submitted by
David L. Johansen
This thesis has been read by each member of the following graduate committee and by majority vote has been found to be satisfactory.
Date
Randal W. Beard, Chair
Date
Clark N. Taylor
Date
Timothy W. McLain
BRIGHAM YOUNG UNIVERSITY
As chair of the candidate’s graduate committee, I have read the thesis of David L. Johansen in its final form and have found that (1) its format, citations, and bibliographical style are consistent and acceptable and fulfill university and department style requirements; (2) its illustrative materials including figures, tables, and charts are in place; and (3) the final manuscript is satisfactory to the graduate committee and is ready for submission to the university library.
Date
Randal W. Beard Chair, Graduate Committee
Accepted for the Department
Michael J. Wirthlin Graduate Coordinator
Accepted for the College
Alan R. Parkinson Dean, Ira A. Fulton College of Engineering and Technology
ABSTRACT
VIDEO STABILIZATION AND TARGET LOCALIZATION USING FEATURE TRACKING WITH SMALL UAV VIDEO
David L. Johansen Department of Electrical and Computer Engineering Master of Science
Unmanned Aerial Vehicles (UAVs) equipped with lightweight, inexpensive cameras have grown in popularity by enabling new uses of UAV technology. However, the video retrieved from small UAVs is often unwatchable due to high frequency jitter. Beginning with an investigation of previous stabilization work, this thesis discusses the challenges of stabilizing UAV based video. It then presents a software based computer vision framework and discusses its use to develop a real-time stabilization solution. A novel approach of estimating intended video motion is then presented. Next, the thesis proceeds to extend previous target localization work by allowing the operator to easily identify targets—rather than relying solely on color segmentation—to improve reliability and applicability in real world scenarios. The resulting approach creates a low cost and easy to use solution for aerial video display and target localization.
ACKNOWLEDGMENTS
This work would not have been possible without the efforts, help, understanding, patience, and wisdom of a lot of people. The help of my committee members, Dr. Randy Beard, Dr. Clark Taylor, and Dr. Tim McLain, has been invaluable, and I could not have completed this thesis without all of the opportunities and assistance that they have given me. I would also like to thank Brigham Young University and the Electrical and Computer Engineering Department for all of the challenges and learning opportunities that they have so generously given me. The helping hands of my lab mates and friends has been the mortar that held this thesis together, and I truly can say that I have stood on the shoulders of giants. I would like to thank Derek Kingston for all of the brain storming, debugging, and just plain old fashioned help that he has so selflessly given me. His willingness to lend a helping hand is something that I will always strive to have in my life. I would also like to thank Andrew Eldredge for all of his support. He was always the guy to bounce an idea off of and his enthusiasm has always kept me motivated. I must also thank Josh Redding for making me a true ”MAGICC Labber” and for showing me how awesome UAVs really are. Joe Jackson has always been the eternal optimist and I’m glad to say that he’s proved me wrong more times than I can count. I would like to thank Brandon Call for always catching my boneheaded math errors and for being able to tell me I was wrong, even when I swore I wasn’t. Everyone should be grateful to James Hall for his willingness to read my thesis more times than any human should be required to, and his feedback was invaluable. Blake Barber is one of the few people I’ve met that’s willing to be just as stubborn as me, and I hope that I can always have a fraction of his drive and a tiny portion of his intelligence. I
would also like to thank all of the other unmentioned lab members that have done so much in helping me reach this goal. In conclusion, I would like to give endless thanks to the foundation of this thesis, my beautiful wife, Jenni. She has supported me and stood by me through too many long nights, and has always been my biggest fan. This thesis, and my life, would not be the same without her.
Table of Contents
Acknowledgements
xi
List of Tables
xix
List of Figures
xxi
1 Introduction
1
1.1
Motivation . . . . . . . . . . . . . . . . . . . . . . . . . . . . . . . . .
1
1.2
Problem Description . . . . . . . . . . . . . . . . . . . . . . . . . . .
2
1.3
Related Work . . . . . . . . . . . . . . . . . . . . . . . . . . . . . . .
4
1.3.1
Video and Telemetry Synchronization . . . . . . . . . . . . . .
4
1.3.2
Video Stabilization . . . . . . . . . . . . . . . . . . . . . . . .
5
1.3.3
Target Identification and Localization . . . . . . . . . . . . . .
10
1.4
Contributions . . . . . . . . . . . . . . . . . . . . . . . . . . . . . . .
10
1.5
Outline . . . . . . . . . . . . . . . . . . . . . . . . . . . . . . . . . . .
11
2 Development Platform
13
2.1
Timestamps . . . . . . . . . . . . . . . . . . . . . . . . . . . . . . . .
13
2.2
Video Handling Pipeline . . . . . . . . . . . . . . . . . . . . . . . . .
15
2.3
FrameProcessor . . . . . . . . . . . . . . . . . . . . . . . . . . . . . .
18
2.4
Synchronization Results . . . . . . . . . . . . . . . . . . . . . . . . .
19
2.5
Video Stabilization and Target Localization Architecture . . . . . . .
20
xv
2.5.1
Video Stabilization . . . . . . . . . . . . . . . . . . . . . . . .
20
2.5.2
Target Localization . . . . . . . . . . . . . . . . . . . . . . . .
22
3 Feature Selection 3.1
3.2
3.3
3.4
25
What Makes a Good Feature? . . . . . . . . . . . . . . . . . . . . . .
26
3.1.1
Identifiable and Unique . . . . . . . . . . . . . . . . . . . . . .
26
3.1.2
Exists from Frame to Frame . . . . . . . . . . . . . . . . . . .
26
3.1.3
Provides New Information . . . . . . . . . . . . . . . . . . . .
28
Feature Rating . . . . . . . . . . . . . . . . . . . . . . . . . . . . . .
28
3.2.1
Gradient Difference . . . . . . . . . . . . . . . . . . . . . . . .
28
3.2.2
Canny Edge Detector . . . . . . . . . . . . . . . . . . . . . . .
29
3.2.3
Forstner Interest Operator . . . . . . . . . . . . . . . . . . . .
29
3.2.4
Harris Corner Detector . . . . . . . . . . . . . . . . . . . . . .
29
3.2.5
Binary Corner Detector . . . . . . . . . . . . . . . . . . . . .
29
Feature Selection . . . . . . . . . . . . . . . . . . . . . . . . . . . . .
30
3.3.1
Region Based Feature Selection . . . . . . . . . . . . . . . . .
30
3.3.2
Minimum Separation Feature Selection . . . . . . . . . . . . .
30
3.3.3
Grid Based Feature Selection . . . . . . . . . . . . . . . . . .
30
Results . . . . . . . . . . . . . . . . . . . . . . . . . . . . . . . . . . .
31
3.4.1
Feature Rating . . . . . . . . . . . . . . . . . . . . . . . . . .
31
3.4.2
Feature Selection Method . . . . . . . . . . . . . . . . . . . .
35
4 Feature Tracking
37
4.1
Template Matching . . . . . . . . . . . . . . . . . . . . . . . . . . . .
38
4.2
Profile Matching . . . . . . . . . . . . . . . . . . . . . . . . . . . . .
39
4.3
Optical Flow
. . . . . . . . . . . . . . . . . . . . . . . . . . . . . . .
40
4.4
Results . . . . . . . . . . . . . . . . . . . . . . . . . . . . . . . . . . .
40
xvi
4.4.1
Low Noise Levels . . . . . . . . . . . . . . . . . . . . . . . . .
40
4.4.2
High Noise Levels . . . . . . . . . . . . . . . . . . . . . . . . .
41
4.4.3
Pyramidal Template Matching . . . . . . . . . . . . . . . . . .
43
5 Frame Motion Estimation
47
5.1
Frame Motion Models . . . . . . . . . . . . . . . . . . . . . . . . . .
48
5.2
Translational Model . . . . . . . . . . . . . . . . . . . . . . . . . . . .
48
5.2.1
Iterative Least Squares . . . . . . . . . . . . . . . . . . . . . .
49
5.2.2
RANSAC . . . . . . . . . . . . . . . . . . . . . . . . . . . . .
50
5.3
Properties of Iterative Least Squares and RANSAC . . . . . . . . . .
52
5.4
Affine Model . . . . . . . . . . . . . . . . . . . . . . . . . . . . . . . .
54
5.4.1
Least Squares . . . . . . . . . . . . . . . . . . . . . . . . . . .
54
5.4.2
Iterative Least Squares . . . . . . . . . . . . . . . . . . . . . .
55
5.4.3
RANSAC . . . . . . . . . . . . . . . . . . . . . . . . . . . . .
55
Results . . . . . . . . . . . . . . . . . . . . . . . . . . . . . . . . . . .
56
5.5.1
Affine Model with Three-Dimensional Motion . . . . . . . . .
57
5.5.2
Iterative Least Squares and RANSAC . . . . . . . . . . . . . .
58
5.5
6 Video Display
63
6.1
PID Camera . . . . . . . . . . . . . . . . . . . . . . . . . . . . . . . .
64
6.2
Parabolic Fit Camera . . . . . . . . . . . . . . . . . . . . . . . . . . .
65
6.3
Results . . . . . . . . . . . . . . . . . . . . . . . . . . . . . . . . . . .
70
6.3.1
Intended Video Motion . . . . . . . . . . . . . . . . . . . . . .
70
6.3.2
Unwanted Jitter Removal . . . . . . . . . . . . . . . . . . . .
73
7 Target Localization 7.1
79
Operator Input . . . . . . . . . . . . . . . . . . . . . . . . . . . . . .
xvii
80
7.1.1
Hold and Follow . . . . . . . . . . . . . . . . . . . . . . . . . .
80
7.1.2
Selection Area . . . . . . . . . . . . . . . . . . . . . . . . . . .
80
7.1.3
Click-to-Follow . . . . . . . . . . . . . . . . . . . . . . . . . .
80
7.2
Screen to Image Transformation . . . . . . . . . . . . . . . . . . . . .
81
7.3
Image to World Ray Transformation . . . . . . . . . . . . . . . . . .
82
7.4
World Position from World Rays . . . . . . . . . . . . . . . . . . . .
85
7.5
Results . . . . . . . . . . . . . . . . . . . . . . . . . . . . . . . . . . .
86
7.5.1
Hold and Follow . . . . . . . . . . . . . . . . . . . . . . . . . .
86
7.5.2
Click-to-Follow . . . . . . . . . . . . . . . . . . . . . . . . . .
88
7.5.3
Click-to-Follow with Feature Movement . . . . . . . . . . . . .
88
8 Conclusions and Future Work
91
8.1
Conclusions . . . . . . . . . . . . . . . . . . . . . . . . . . . . . . . .
91
8.2
Future Work . . . . . . . . . . . . . . . . . . . . . . . . . . . . . . . .
91
Bibliography
95
xviii
List of Tables
6.1
Stabilization Results with Translational Model . . . . . . . . . . . . .
77
6.2
Stabilization Results with Affine Model . . . . . . . . . . . . . . . . .
78
xix
xx
List of Figures
2.1
Development Platform . . . . . . . . . . . . . . . . . . . . . . . . . .
14
2.2
Average Telemetry Delay Estimate . . . . . . . . . . . . . . . . . . .
16
2.3
Video Handling Pipeline . . . . . . . . . . . . . . . . . . . . . . . . .
17
2.4
Localization with Synchronization . . . . . . . . . . . . . . . . . . . .
21
2.5
Stabilization and Localization Architecture . . . . . . . . . . . . . . .
22
3.1
Feature Selection . . . . . . . . . . . . . . . . . . . . . . . . . . . . .
25
3.2
Feature Rating Line Rejection . . . . . . . . . . . . . . . . . . . . . .
32
3.3
Feature Rating Noise Rejection . . . . . . . . . . . . . . . . . . . . .
34
3.4
Low Noise Level Feature Distribution . . . . . . . . . . . . . . . . . .
36
3.5
High Noise Level Feature Distribution . . . . . . . . . . . . . . . . . .
36
4.1
Feature Tracking . . . . . . . . . . . . . . . . . . . . . . . . . . . . .
37
4.2
Feature Tracking with Low Noise Levels . . . . . . . . . . . . . . . .
42
4.3
Feature Tracking with High Noise Levels . . . . . . . . . . . . . . . .
43
4.4
Pyramidal Template Matching . . . . . . . . . . . . . . . . . . . . . .
45
5.1
Frame Motion Estimation . . . . . . . . . . . . . . . . . . . . . . . .
47
5.2
Translation Model Biasing . . . . . . . . . . . . . . . . . . . . . . . .
49
5.3
Translation Model Rotation Rejection . . . . . . . . . . . . . . . . . .
51
5.4
Translation Model Zero Mean Noise Rejection . . . . . . . . . . . . .
53
5.5
Translation Model Non-Zero Mean Noise Rejection . . . . . . . . . .
53
xxi
5.6
Affine Model with valid 3D motion . . . . . . . . . . . . . . . . . . .
59
5.7
Affine Model with invalid 3D motion . . . . . . . . . . . . . . . . . .
60
5.8
Iterative Least Squares and RANSAC rejection of φ . . . . . . . . . .
61
5.9
Iterative Least Squares and RANSAC rejection of θ . . . . . . . . . .
62
6.1
Video Display . . . . . . . . . . . . . . . . . . . . . . . . . . . . . . .
63
6.2
Parabolic Fit . . . . . . . . . . . . . . . . . . . . . . . . . . . . . . .
66
6.3
Estimates of Intended Video Motion . . . . . . . . . . . . . . . . . .
71
6.4
Bode Plot of the Proportional Only PID Camera . . . . . . . . . . .
72
6.5
Bode Plot of the Full PID Camera . . . . . . . . . . . . . . . . . . .
73
6.6
Bode Plot of the Parabolic Fit Camera . . . . . . . . . . . . . . . . .
74
6.7
Average Out of Band Energy of Parabolic Fit Camera . . . . . . . . .
75
6.8
Unwanted Jitter Removal
. . . . . . . . . . . . . . . . . . . . . . . .
76
7.1
Target Localization . . . . . . . . . . . . . . . . . . . . . . . . . . . .
79
7.2
Hold and Follow Tracking . . . . . . . . . . . . . . . . . . . . . . . .
87
7.3
Click-to-Follow Tracking . . . . . . . . . . . . . . . . . . . . . . . . .
89
7.4
Click-to-Follow with Feature Movement Tracking . . . . . . . . . . .
90
xxii
Chapter 1 Introduction Small Unmanned Aerial Vehicles (UAVs) have attracted increased interest in recent years due to the advent of small, inexpensive onboard cameras. This new technology serves several purposes: rapid surveillance of an area by a search-and-rescue team, performance of a tactical or reconnaissance mission by a military squad without endangering lives, or helping aid-workers identify problem areas in need of immediate attention in a disaster torn area. This list will continue to grow as small UAVs becomes a more robust and effective platform for simple gathering and disseminating information from aerial video. 1.1
Motivation Camera-equipped small UAVs present the possibility of obtaining aerial video
where the cost of using other methods may be prohibitive or deployment times may be excessive. Unfortunately, small UAVs are highly susceptible to atmospheric turbulence which induces jitter and makes the video difficult to watch. Because of the size and weight constraints of small UAVs, fixed cameras have typically been used. However, 2 and 3-axis gimbaled cameras have decreased in size, enabling their use on a small UAV. The availability of gimbaled cameras opens the door for mechanical video stabilization, but the added weight and power usage make mechanical video stabilization impossible for small UAVs at the current time. Even without the weight and power limitations, the sensor noise and actuator delay common on small UAVs would not allow for complete removal of the jitter. Therefore, stabilization performed on the ground station is required to create watchable video. Specialized hardware exists to stabilize video, but is available only as an external device or PCI card meant for 1
use on a standard PC. The ground station used with a small UAV must be compact and mobile to enable its use by surveillance and reconnaissance teams. Specialized hardware solutions do not meet these requirements, so a real-time software-based solution for removing unwanted camera jitter is necessary for a mobile UAV ground station. In addition to creating stable footage, video stabilization enables other applications for UAV video. One such use is localization—the estimation of the world location—of visible targets in the video. Knowledge of the position of the target in standard GPS format enables the UAV operator to transmit this information to other team members. In order to localize a target, it must first be identified. Unfortunately, methods for autonomous recognition of targets requires prior knowledge of the target based on large training sets and suffer from very high false positive rates. However, stabilized video allows the operator to more easily identify a target in the video which can then be localized by the ground station software. The added capability of video stabilization and localization of operator defined targets assists the small UAV platform in serving as a powerful tool for surveillance and reconnaissance teams. 1.2
Problem Description In order to enable the use of small UAVs in surveillance and reconnaissance
missions, this thesis addresses four major problems: (1) a mobile platform that allows for the processing of UAV video and communicating with the UAV, (2) synchronization of video with UAV telemetry data, (3) video stabilization, and (4) localization of specified targets. The solutions to these problems can be grouped into two main categories: (1) a video processing development platform and (2) a stabilization and localization system. The development platform acts as the central communication hub between the UAV, video processing software, and the operator. It must be able to receive video and telemetry data from the UAV, synchronize this data, efficiently relay this data to the video processing software, and enable communication of commands from 2
the video processing software to the UAV. Handling of the video and telemetry data is necessary to allow the operator to make use of the information gathered by the UAV. Video is received at a constant rate of 30 Hz with a constant transmission delay. Telemetry data is transmitted at an irregular rate, between 3-5 Hz, with a variable transmission delay. Because of this, the video and telemetry data must be synchronized to accurately estimate the location of the identified target. The development platform also enables operator interaction with the stabilized video and allows both the video processing software and the operator to issue commands to the UAV. The video stabilization and target localization system is built using the described development platform. In order to meet the demands of surveillance and reconnaissance teams, all video processing must occur at real-time rates on a mobile ground station and all processing must be performed online—while the UAV is in flight. In order to meet these requirements, feature tracking is used to estimate the frame-to-frame motion in the video. The intended video motion is then estimated and removed from the estimated video motion to display the video as if unwanted motion had not occurred. This requires the online estimation of intended video motion. Despite the availability of this information in the telemetry data received from the UAV, the error in attitude estimation combined with the infrequent and delayed transmission of the telemetry data makes its use impractical for estimating intended video motion. Therefore, the intended video motion must be estimated from the video processing. The resulting stabilized video enables the operator to easily identify targets. The burden placed on the operator must be minimized so as to not excessively distract from other important tasks. The received operator input must be transformed to world coordinates to estimate the location of the target in a way that can be meaningfully transmitted to other team members.
3
1.3
Related Work An examination of the previous work that is related to this thesis will now be
presented. Three areas of research will be the primary focus: (1) video and telemetry synchronization, (2) video stabilization, and (3) target identification and localization. 1.3.1
Video and Telemetry Synchronization Video and data synchronization is a common problem in several areas of re-
search. The details of the implemented solutions depends on the task and available equipment, but all work in this field shares a common goal: improving the accuracy of data analysis. This work can be divided into two segments with distinct properties. The first set of research involves video and data that are recorded directly, where the synchronization is performed offline—after the entire data stream has been captured. The second set of research involves video and data that are transmitted with the synchronization being performed online—during transmission. In UAV applications, online synchronization is necessary in order to display the video and make use of the telemetry data while the UAV is in flight. However, the research in both of these areas is relevant and this thesis builds on the work done in both. As just mentioned, the research involving offline synchronization is not directly related to UAVs, but still offers important insights into existing methods of video and data synchronization. Gaskill [1] shows that video tape can be tagged with a Society of Motion Picture and Television Engineers (SMPTE) time code while data from various sensors is tagged with an Inter-Range Instrumentation Group (IRIG) time code. Commercially available converters are used to convert the IRIG time code into an SMPTE time code and this allows for video playback with synchronized data being displayed to the operator. Zeng, Powers, and Hsiao [2] extend the work of Gaskill by using an SMPTE time code for both video and data. This eliminates the need for converters when retrieving the data for a given frame, thus simplifying the synchronization process. Of the offline methods, the most closely related to this thesis is the work of Anderson and Stump [3], where the UTC time available on GPS units is used to timestamp data from geological sensors and video of the monitored 4
occurrences. This allows for sensors and video cameras that are separated by large distances to be synchronized during offline analysis. The work more closely related to this thesis is the research done with transmitted video involving online synchronization. Rieger [4] encodes telemetry data directly into the video signal. This method simplifies the synchronization task, but requires either encoding the telemetry data into the analog video signal or transmitting the video digitally. Unfortunately, analog video transmission is highly susceptible to noise, which often makes accurate recovery of the encoded data impossible, and the weight and power requirements of existing digital modems are beyond the payload capacities of small UAVs. Zhang [5] shows that specialized communication hardware can be used to transmit the video and telemetry data on separate channels simultaneously. Unfortunately, like Rieger’s solution the weight and power requirements of existing technology do not allow for this hardware to be used on small UAVs. On a more encouraging note, Walrod [6] shows that asynchronous transmission provides for more efficient use of available bandwidth and that the transmitted data can still be synchronized. All of the discussed synchronization methods are based on timestampping the video and data in order to perform synchronization, and they all show that synchronization can improve the accuracy of data analysis. However, the principles outlined in the work of Anderson and Stump [3] and Walrod [6] serve as the basis of the video and telemetry synchronization technique used in this thesis. The details of our method and its role in the development platform will be discussed in Chapter 2. 1.3.2
Video Stabilization Before discussing work related to video stabilization, it is necessary to note the
differences between the video that has been the focus of previous research—video from hand-held cameras and ground vehicles—and video from UAVs. There are three main distinguishing factors: (1) camera motion, (2) properties of foreground objects, and (3) video noise. Video from a hand-held camera is usually captured from a standing or slowly-moving platform with slight rotations about the camera’s optical axis. UAV 5
video, however, is captured from a fast-moving vehicle with significant rotation about all axes. This difference creates larger frame-to-frame motion and adds complexity to the stabilization process. The second distinguishing factor is the properties of foreground objects in the video. The foreground objects in footage from a handheld camera are typically independently mobile objects that are close to the camera and whose motion does not match that of the entire scene. However, UAV video is typically taken from an altitude of at least 50 meters with foreground objects whose motion is dwarfed by the scene motion. This difference allows for the assumption that there is a single dominant motion in the video and simplifies the stabilization process. The final and most challenging difference is the increased signal-to-noise ratio common in UAV video. Video from a hand-held camera is virtually noise free, but UAV video often has very high noise levels caused by the analog transmission of the video. Methods for detecting and rejecting noise will be discussed throughout the thesis. The majority of video stabilization techniques are based on two assumptions: (1) the flat world assumption and (2) the assumption that feature motion is purely translational. The flat world assumption states that the scene content is predominantly flat with minor variations in depth and can be reasonably assumed to lie on a plane. Fortunately, UAV video is taken from altitudes of at least 50 meters, so real-time video processing allows this assumption to hold in all but the most extreme cases. The importance of this assumption will be further discussed in regards to feature selection in Section 3.1.2. The second assumption is that minimal rotation occurs between frames at the feature level, so that feature movement can be classified as purely translational. When features are tracked at real-time rates, this assumption holds and feature motion can be accurately classified as purely translational. Both of these assumptions simplify the processing necessary to stabilize UAV video and show the importance of stabilizing the video in real-time. The primary focus of video stabilization research has typically been on video from hand-held cameras, with the few exceptions noted throughout this section. Also, unless specifically noted, these methods cannot run at real-time rates and are therefore 6
post processed. In spite of these facts, many of the techniques can be applied to stabilization of UAV video. For clarity, previous video stabilization research will be categorized into three groups: (1) feature tracking-based methods, (2) hardwarebased methods, and (3) other contributions to video stabilization that do not directly apply to stabilization of UAV video. Ratakonda [7] was one of the first to research video stabilization. The work shows that real-time performance on a low resolution video stream can be achieved through the use of profile matching and sub-sampling. A single, large template window and a small search window are used and the method is only capable of stabilizing mild translational motion. Because of the use of a single template match, this method resembles a simplified version of current mosaicing techniques. Chang, Lai, and Lu [8] present a novel approach to feature tracking based on optical flow. Optical flow is calculated on a fixed grid of points in the video. It is of interest to note that the grid-based optical flow calculation results in invalid feature motion vectors near homogenous image regions and is similar to the effects of noise in UAV video. Chang, Lai, and Lu solve this problem with iterative least squares and show that stabilization is possible in environments with significant noise levels. In order to estimate intended video motion, a set of cost functions based on smoothness and the deviation of intended video motion from measured video motion is applied. This allows for an intuitive tuning of the camera motion parameters, but requires knowledge of the motion of the entire video and cannot be used to perform online video synchronization. However, real-time rates are possible with this method. Van der Wal, Hansen, and Piacentino [9] presented their work on the Acadia Vision Processor. It is a custom hardware processing chip mounted on a PCI card that is used in a common desktop PC and is capable of, among other things, stabilizing video with motion of up to 64 pixels between frames in real-time. The stabilization is based on an affine model and handles translation, scaling, and rotation. It also employs pyramidal techniques to achieve real-time performance. While the use of a similar solution involving custom hardware on a UAV or in the ground station would be ideal, the weight and power constraints prevent its use on small UAVs, and, 7
in order to maintain mobility, the current ground station software runs on portable computers, such as laptops and tablet PCs, which do not have PCI slots. Darmanjian, Arroyo, and Schwartz [10] present a low cost, hardware solution for video stabilization. Hardware generated temporal differences are used to detect motion, and features are tracked along motion edges. The dominant translational motion is extracted from the feature motion vectors and a damping factor is applied to account for intended video motion. Even though this hardware is not as feature rich as the Acadia Vision Processor, it shows that advances are being made towards creating hardware that can satisfy the power and weight requirements of small UAVs. Cardoze, Collins, and Arkin [11] use specialized hardware located at the ground station to stabilize video from a rotorcraft. Motion detection was applied to the stabilized video to identify moving targets. It should be noted that the primary goals of the work of Cardoze, Collins, and Arkin are closely related to this thesis. However, video from a rotorcraft often has characteristics more closely related to video from a hand-held camera than video from a small UAV, and the size requirements of the added hardware are beyond those of a small UAV ground station. Buehler, Bosse, and McMillian [12] introduced the novel approach of applying Image-Based Rendering techniques to video stabilization. Camera motion is reconstructed from the video, and the path of camera motion is smoothed. In order to estimate camera motion in Euclidean distance, knowledge of the scene is required. This information is unavailable during stabilization, so camera motion is estimated in the camera frame. Image-Based Rendering is then applied to reconstruct a stabilized video using the original video and the smoothed camera motion. Because of the estimation of camera motion in the camera frame, this method performs well with simple, slow camera motion, but is unable to handle complex or fast movement. Jin, Zhu, and Xu [13] introduce a 2.5D motion model to handle video with large depth variations. A 2.5D motion model uses an added depth parameter and is referred to as a depth model. This method requires the use of one of three depth motion models. None of the three depth motion models can simultaneously handle horizontal translation, vertical translation, and rotation. The motion in UAV video has both 8
translational and rotational components and so this method cannot be used to stabilize UAV video. Also, the added benefit of the depth motion models with regard to UAV video is insignificant in almost all scenarios. Duric and Roseneld [14] argue that smoothing of video, rather than stabilization, is the more appropriate solution. This argument is based on the human sensitivity to rotational motion and the assumption that most unintended camera motion is rotational. This assumption holds true with video from a hand-held camera, but unintended camera motion is not confined to rotational motion in UAV video. Also, in order to remove the rotational motion from the video, this method relies on the presence of a distant visible object in the video, such as the horizon. The stabilization is done by maintaining the orientation of the object in the video. Due to the reliance on a distant object, this method cannot be applied to UAV-based surveillance video, in which the camera is pointed downward and a horizon is not visible. However, the technique applied by Duric and Roseneld presents interesting applications to other UAV research, such as computer vision assisted attitude estimation. Litvin, Konrad, and Karl [15] apply probabilistic methods to estimate intended camera motion and introduce the use of mosaicing to reconstruct undefined regions created by the stabilization process. This method of estimating intended camera motion produces very accurate results, but requires tuning of camera motion model parameters to match the type of camera motion in the video. Finally, Matsushita, Ofek, Tang, and Shum [16] develop an improved method for reconstructing undefined regions called Motion Inpainting. This method produces results that are free from the smearing and tearing present in previous methods for reconstructing undefined regions. Motion of foreground objects is detected by applying optical flow calculations to the stabilized video. Unfortunately, real-time frame rates are not possible at the current time. It is important to note that feature tracking has been used by the vast majority of existing stabilization techniques, but previous work has said very little regarding feature selection and its role in the stabilization process. This thesis will discuss feature selection and its impact on the stabilization of UAV video in Chapter 3.
9
1.3.3
Target Identification and Localization As previously mentioned, localization involves estimating the world position
of an identified target. The first step in this process is identifying the target. The existing work involved in autonomous target recognition can be grouped into three categories: (1) template matching [17, 18], (2) edge and vertex matching [19, 20, 11], and (3) neural network-based methods [21, 22]. All of these techniques require prior knowledge of the target’s appearance and suffer from high false-positive rates. Ratches, Walters, Buser, and Guenther [23] conducted a survey of the state of the art in target recognition. The primary conclusion of this work is that autonomous target recognition of arbitrary targets is not possible in the foreseeable future. However, they do point out that a robust target identification system does exist, the human visual system. As previously discussed, the stabilization work in this thesis creates a watchable video stream, and enables the operator to identify targets to be localized. Several research projects have addressed the localization problem from both the target and self-localization perspective. Of interest to this thesis is the work of Redding [24], which discusses the existing approaches to object localization and how they relate to UAV-based surveillance and reconnaissance. Redding then presents techniques for estimating the GPS position of a recognized target in video captured by a small UAV. The target recognition task was accomplished using threshold-based color segmentation and unfortunately lacked real-world applicability in all but the most extreme scenarios. This thesis addresses this limitation by allowing the operator to identify the target which is then localized by the ground station software using the techniques presented in [24]. 1.4
Contributions This thesis builds on the methods presented in the previously discussed related
work to enable the use of UAV video by surveillance and reconnaissance teams. The specific contributions of this thesis can be divided into three groups: (1) development platform, (2) stabilization, and (3) localization.
10
The development platform provides capabilities to synchronize video and telemetry data, allows for the development of new computer vision algorithms using UAV video, and more easily enables real-time processing of UAV video through the exploitation of multi-processor and simultaneous multi-threading systems. The second group of contributions of this thesis involves the use of the development platform to create an online stabilization system for UAV video. Specific contributions to the realm of stabilization work encompass enhancements to existing stabilization techniques to correctly handle the high noise levels seen in UAV video and methods to accurately estimate intended video motion in real-time without knowledge of the frame-to-frame motion of the entire video. The final group of contributions of this thesis is the contribution to previous localization work that extends its real-world applicability. This contribution uses the stabilized video to allow the operator to easily identify targets in the video, which are then localized by the ground station software. 1.5
Outline This thesis begins with a description of the computer vision development plat-
form created for processing UAV video in Chapter 2. It outlines the basic video processing architecture and presents the flow of video and telemetry data through the system. It also discusses the method of telemetry and video synchronization and its involvement in the video processing pipeline, and concludes with an overview of how the development platform is used to create stabilized video that enables the operator to easily identify targets. Chapter 3 begins the analysis of the video stabilization process with a discussion of the characteristics of an ideal feature for use during stabilization, and then gives a brief overview of existing feature selection techniques and discusses possible methods of noise detection during the feature selection process. These methods of noise detection are extended during an overview of existing feature tracking techniques in Chapter 4. Models for frame motion are then examined in Chapter 5 and two methods for detecting incorrectly tracked features during frame motion estimation are also explored. The discussion of video stabilization is concluded in Chapter 6 with an overview of the processes of estimating intended video 11
motion and displaying the stabilized video. Two novel approaches for estimating intended video motion are also presented in this chapter. The discussion then shifts to localization. Chapter 7 presents three methods of operator interaction with the stabilized video and explains the transformations needed to estimate the GPS position of a operator identified target. The conclusions of this work and a discussion of possible future work are then presented in Chapter 8.
12
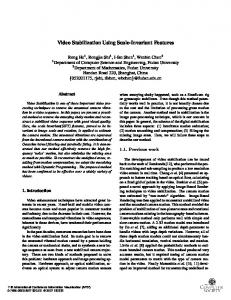
Chapter 2 Development Platform Small UAVs have the ability to rapidly obtain information, however, the use of this information is dependent on effective communication between the UAV and the operator. The first contribution of this thesis is a description of the enhancements made to the UAV ground station software to create a development platform that enables interaction between the UAV, video processing software (FrameProcessor ), and the operator. Figure 2.1 shows the data flow that occurs between each of these components. The ground station acts as the central hub between the UAV, FrameProcessor, and the operator. The UAV asynchronously transmits video and telemetry data to the ground station, which is then synchronized by the ground station and sent to the FrameProcessor. The FrameProcessor then sends commands to the ground station and presents the processed video to the operator. The ground station transmits the commands received from the FrameProcessor to the UAV. This system of handling and processing video has three components: (1) timestamping of video and telemetry data to enable synchronization, (2) the video handling pipeline, and (3) the FrameProcessor. 2.1
Timestamps The timestamps used for synchronizing the video and telemetry data can be
generated in two manners: (1) full synchronization and (2) half synchronization. Full synchronization is based on the in-flight availability of UTC time from the GPS unit used on the UAV and ground station. Half synchronization generates the timestamps based on estimating the average delay in the transmission of video and telemetry data and compensating for these delays in real time. 13
UAV
Telemetry Video
Commands
Synchronized Video and Telemetry
Ground Station
Telemetry
FrameProcessor
Commands
Input
Processed Video User
Figure 2.1: The ground station acts as the central hub between the operator, UAV, and video processing software (FrameProcessor ), and enables control of the UAV by the operator and FrameProcessor.
Full synchronization provides more accurate timestamps through the use of a GPS unit on the UAV and ground station. Each video frame is tagged with the current UTC time minus the estimated transmission delay, which will be discussed in the next section in regards to half synchronization, and then buffered for synchronization. Because of the constant delay in video transmission, this results in an accurate timestamp of when the video frame was originally captured by the camera. The telemetry data is timestamped on the UAV using the current UTC time. When the telemetry data is received by the ground station, the timestamp is then used to synchronize the telemetry data with buffered video. In order to perform half synchronization, two delays must be estimated to create the necessary timestamps. The first is the delay of the transmitted video, which is the time that it takes for the video to pass through the camera, transmitter, receiver, and framegrabber before arriving at the ground station. As previously mentioned, this delay is constant and can therefore be easily estimated and removed from the generated timestamp. The video transmission delay was estimated using full synchronization and a FrameProcessor created with the currently discussed development platform. An operator manually rotated the UAV in an oscillatory manner about 14
its roll axis with a camera pointed out the wing facing a colored object, while the autopilot recorded the roll with the UTC timestamp. The FrameProcessor located the object in the video and recorded the y pixel coordinate of the center of mass of the object in the image with the UTC timestamp available on the ground station. The peaks of the two data sets were found and false peaks were found by enforcing a one-to-one mapping and throwing out any matches whose phase shift was greater than two standard deviations from the mean phase shift. The mean phase shift was then recalculated and was used as the estimate of video transmission delay. Figure 2.2 shows a segment of the plot of the UAV roll and the y pixel coordinate of the center of mass of the object with matched peaks plotted. The final estimate was found to be 95 milliseconds. The second delay is the average delay of telemetry transmission, and unfortunately this delay is not constant. This delay was estimated by marking the telemetry packets with the UTC from the UAV and then calculating the difference between the current UTC time and the timestamp of the telemetry data when the telemetry data was received by the ground station. The mean delay of telemetry transmission was found to be 150 milliseconds with a standard deviation of 35 milliseconds. Therefore, most telemetry timestamps can be estimated to within one to two frames of the true time, compared to telemetry data being used with a frame that falls within three to four frames of the true frame when no synchronization is used, and can improve the accuracy of telemetry based image processing. The full synchronization method is preferred because of its increased accuracy, but the half synchronization method is an acceptable alternative when UTC time is not available in-flight. The effects of both synchronization methods will be discussed in Section 7.5.
2.2
Video Handling Pipeline Pipelining is a technique that is most commonly used in hardware development
to improve the throughput of a system at the cost of a slight increase in latency. It is accomplished by dividing the task into subtasks that depend only on the output of the previous subtask. In modern CPUs, hardware pipelining is performed on 15
500 450 400 350 300 250 200 150 100 50 230
232
234
236
238
240
242
244
Figure 2.2: The solid blue line is the y pixel coordinates and the dotted red line shows the UAV roll. The circles represent the matched peaks used to estimate the mean phase shift between the two data sets.
the instruction level and involves complex timing analysis and synchronization to achieve optimal results. Software pipelining is based on the same principles, but is done on a macro level to exploit modern multi-processor and simultaneous multithreading systems and does not require the same level of scrutiny to yield performance increases. The video handling system is built on a software pipelining architecture. Figure 2.3 shows the division of the video handling and synchronization process to enable software pipelining. Each task is performed in its own thread and outputs the data to the next task through a queue. This system also adds increased stability to the ground station software, because the FrameProcessor cannot crash or freeze the ground station software.
16
Capture Thread
ToConvert Queue
Conversion Thread
ToProcess Queue
Every Frame Thread
Between Telemetries Buffer
Between Telemetries Thread
Processed Queue
UAV Telemetry
ToRecord Queue
Record Video Thread
Figure 2.3: The blue boxes with rounded corners represent the tasks in the pipeline that are each performed in their own thread. The green boxes with square corners represent data that flows through the pipeline and that are used to pass data from task to task. Two separate video streams are displayed to the user. The first is displayed at a frame rate in the Every Frame thread and the second is displayed when telemetry is received in the Between Telemetries thread.
The video is initially captured and frames are added to the ToConvert queue. Three video sources are supported: (1) live video feed from the UAV, (2) video from the UAV flight simulator Aviones, and (3) video from a saved video file. The live video feed is used in real world scenarios while the Aviones video feed and video files allow for testing new methods in a controlled environment. Frames are taken from the ToConvert queue by the Conversion thread and converted to standard RGB format. The FrameProcessor can then convert the images to any image format that it requires for later processing. The frame is then added to the ToProcess queue, Between Telemetries buffer, and the ToRecord queue to be handled by the corresponding threads. The Every Frame thread takes the frame from the ToProcess queue and performs the operations required by the FrameProcessor. The FrameProcessor can request that the frame be stored in the Processed queue for later use. If requested by the operator, the Record Video thread records the frame to a operator specified video file with the associated telemetry. The Between Telemetries buffer behaves differently than the queues 17
which transfer data between tasks. It is a running buffer that stores a fixed number of frames for synchronizing the stored frames with telemetry data. When telemetry data is received from the UAV, the Between Telemetries thread extracts the frames that lie between the timestamp of the previous and current telemetry data from the Between Telemetries buffer. The FrameProcessor then performs the processing of synchronized video on the extracted frames. This system allows for handling of video streams in two manners: (1) immediately when the frames are received and (2) when telemetry is received. The first method relies solely on image processing techniques and makes no use of telemetry data. The second method, however, relies on the telemetry data received from the UAV. The synchronization of telemetry data with the received video frames allows for more accurate use of the data extracted during image processing. Without synchronization, the telemetry data would be used with data extracted from an incorrect frame and can be a significant source of error in any performed calculations. The effects of synchronization on the accuracy of localization will be discussed in Section 7.5. As previously stated, a bug in the FrameProcessor can only stop an individual task, which can be restarted after failure, and will not crash the ground station software. Also, computationally intensive processes will slow the pipeline causing dropped frames, rather than freezing the operator interface of the ground station. 2.3
FrameProcessor The FrameProcessor is the functional element that performs all vision process-
ing in the ground station software. As previously mentioned, it can perform custom conversions of video frames, process frames of the video as they are received, and handle synchronized video frames when telemetry is received. It is also capable of displaying both of these video streams to the operator simultaneously. A mechanism for capturing and displaying a paused frame of video for more detailed processing is also available. The ground station relays all operator input from the mouse and keyboard and allows for operator interaction with all of the displayed video streams. A
18
customized dialog that allows for operator input through standard operator interface elements is also available to the FrameProcessor. 2.4
Synchronization Results To demonstrate the added benefits of the presented synchronization method
the localization techniques that were original presented by [24] and that will be discussed in Chapter 7 will be used. The localization results using no synchronization, partial synchronization using the estimated delays, and full synchronization using the UTC time available in flight be be presented. To demonstrate the benefits of video and telemetry synchronization, Figure 2.4 shows results of localizing a target while loitering with each of the presented methods of synchronization. To remove the influence of human factors in the localization process, the threshold-based target localization proposed by [24] is used and all noise is removed from the state estimation in the simulator. Figure 2.4(a) shows the individual estimates of target location with no synchronization and has a mean error of 4.1 meters. The estimates are evenly distributed throughout the area with no definite grouping visible. Figure 2.4(b) shows the individual estimates of target location with half synchronization and has a mean error of 3.2 meters. The estimates demonstrate a visible grouping of estimates near the target’s true location, but several invalid estimates still exist out side of this grouping. Figure 2.4(c) shows the individual estimates of target location with full synchronization and has a mean error of 2.3 meters. A distinct group of estimates is visible near the target’s true location with only a few estimates falling outside of the group. Ideally, the full synchronization method would yield a mean error of 0 meters, but the incorrect estimation of the target center caused by the skewing of the target in the image results in the error seen in the estimate. The effects of the error in the individual estimates on the final estimate of target location are negligible when a target is localized during a loiter, but when localization is performed in areas where loitering is not possible, such as urban environments, the accuracy of the individual estimates of target location is crucial to achieving an accurate final estimate of target location. It has been shown 19
that both synchronization methods improve the accuracy of the individual estimates of target position. Despite the fact that full synchronization is the preferred method, half synchronization has been shown to truly be an acceptable alternative when full synchronization is not possible. 2.5
Video Stabilization and Target Localization Architecture The second contribution of this thesis is the application of the discussed devel-
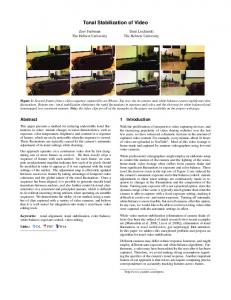
opment platform to create a real-time software-based stabilization system built using that enables the operator to easily identify targets that are then localized by the ground station software. This section outlines the steps of the stabilization process and how operator input is used in conjunction with the stabilized video to estimate the world location of a visible target. Figure 2.5 shows the data required for stabilization and localization and shows how the data flows through the pipeline. Each of the tasks will be discussed in the following chapters with an accompanying figure showing its role in the stabilization and localization architecture. 2.5.1
Video Stabilization The stabilization relies only on image processing techniques and is performed
in the Every Frame thread of the video handling pipeline shown in Figure 2.3. There are five steps performed on every frame received from the UAV. These steps are (1) feature selection, (2) feature tracking, (3) frame motion estimation, (4) estimation of intended video motion, and (5) display of the stabilized video. The first step, feature selection, is discussed in Chapter 3. It begins with a discussion of the properties of an ideal feature in UAV video and the influence of noise on these properties. Methods for quantifying these qualities as a feature rating are then examined and the method of selecting features based on the assigned feature rating are presented. Chapter 4 discusses methods of locating the features selected from the previous frame in the current frame. Also, methods for detecting invalid features are presented. This results in the generation of a set of feature motion vectors. The use of these vectors to estimate frame-to-frame motion is then outlined in Chapter 5. Also, two 20
10
8
6
4
2
0
−2
−4
−6
−8
−10 −10
−8
−6
−4
−2
0
2
4
6
8
10
8
10
8
10
(a) No Synchronization 10
8
6
4
2
0
−2
−4
−6
−8
−10 −10
−8
−6
−4
−2
0
2
4
6
(b) Half Synchronization 10
8
6
4
2
0
−2
−4
−6
−8
−10 −10
−8
−6
−4
−2
0
2
4
6
(c) Full Synchronization
Figure 2.4: The location of the target is shown as a blue asterisk and the individual estimates are shown as red asterisks. (a) shows the localization results when no synchronization is used; (b) shows the localization results when half synchronization is used; and (c) shows the localization results when full synchronization is used.
21
User Target Tracking
Current Video Frame Previous Video Frame
Feature Selection
Features in Previous Frame
Feature Tracking
Feature Motion Vectors
Frame Motion Estimation
Stabilization performed in the Every Frame Thread
Frameto-Frame Motion
Video Display
Intended Motion Estimation
Intended Motion
Target Location in Frame
Synchronized Telemetry
Estimate Target Location
Localization performed in the Between Telemetries Thread
Target Location in World
Figure 2.5: This architecture is an implementation of the FrameProcessor shown in Figure 2.1. The feature selection, feature tracking, frame motion estimation, intended video motion estimation, and video display occur in the Every Frame thread and the estimation of target location occurs in the Between Telemetries thread shown in Figure 2.3. The blue boxes with rounded corners represent the tasks in the stabilization and localization pipeline. The green boxes with square corners represent data that flows through the pipeline and that is used to pass data from task to task.
frame motion models are discussed and an evaluation of the effectiveness of two noise detection methods is presented. Chapter 6 discusses the challenges of estimating intended video motion in real-time and presents two novel techniques of extracting intended motion from the measured frame-to-frame motion. These four steps result in a stabilized video stream that enables an operator to identify targets. 2.5.2
Target Localization Because of its dependence on telemetry data, target localization is performed
in the Between Telemetries thread shown in Figure 2.3. Chapter 7 discusses the methods used to estimate the GPS location of an operator identified target. Chapter 7 also presents the transformations needed to convert the input received from operator interaction with the stabilized video to image coordinates. The chapter then discusses the use of the methods outlined in [24] to generate rays in world frame from the screen 22
coordinates and the use of a series of these rays to estimate the target location. An examination of the effectiveness of three methods of operator interaction is then conducted.
23
24
Chapter 3 Feature Selection
User Target Tracking
Current Video Frame Previous Video Frame
Feature Selection
Features in Previous Frame
Feature Tracking
Feature Motion Vectors
Frame Motion Estimation
Frameto-Frame Motion Intended Motion Estimation
Video Display
Intended Motion
Target Location in Frame
Synchronized Telemetry
Estimate Target Location Target Location in World
Figure 3.1: Feature selection is performed on the previous video frame and outputs a list of features to be tracked in the current frame.
Techniques exist to track the motion between frames through frame matching, but they are too computationally intensive to be performed in software at real-time rates. Feature tracking estimates the motion of the frame by selecting features from the first frame and finds those features in the second frame, so features that can be accurately tracked must be selected. As previously stated, very little has been said about the selection of features during the stabilization process in existing stabilization literature. Therefore, this chapter will discuss what defines an ideal feature when stabilizing UAV video and will evaluate methods for determining feature rating in an attempt to quantify these qualities. A discussion of methods for selecting features based on calculated feature ratings is also conducted. 25
3.1
What Makes a Good Feature? The ideal feature has three characteristics: (1) it is identifiable and unique, (2)
it exists from frame to frame, and (3) it provides new information to the stabilization process. The importance of each of these characteristics is discussed in the following sections. 3.1.1
Identifiable and Unique An identifiable feature is most easily defined as a feature with texture. Full
texture analysis techniques involve complex pattern recognition and are computationally intensive. Therefore, areas with high gradient values are defined as identifiable because of low computational cost. However, an ideal feature is also unique in the image. Lines are an example of image features that have high gradient values but are not unique. This is true, because points on the line cannot be distinguished from other points along the line using image processing techniques. Fortunately, feature selection techniques have evolved to solve these simple problems and can reject areas with a strong gradient in only a single direction, such as lines. However, a more complex form of non-unique features are very common in UAV video. Repeating patterns, such as bricks or dashes on a road, cannot be detected without complex pattern recognition techniques and pose a significant problem to feature tracking techniques. This type of non-unique feature is more easily detected during feature tracking and methods for doing so will be discussed in Section 4.1. 3.1.2
Exists from Frame to Frame A feature existing from frame to frame is not a characteristic that can be
enforced during the feature selection process. However, understanding the causes of feature disappearance between frames facilitates the detection of these invalid features during the entire stabilization process. The primary causes of a feature of this type being selected are noise in the video, and occlusion. Each of these causes presents a unique challenge to the stabilization of UAV video.
26
Noise is very common in UAV video and has very high gradient values. Therefore, noise produces a high feature rating in feature selection techniques. Noise can be removed with image clean up techniques, but they may also remove valid features or cause a loss of detail that degrades the accuracy of feature selection and feature tracking techniques. Certain clean up techniques, like median filtering, minimize the negative effects, but are computationally expensive. Clean up techniques also require significant tuning for the type of noise and scene content, so they are not suitable for general application to stabilization of UAV video. Image analysis techniques can also be used to remove noise during feature selection, but they rely on scene knowledge and are too computationally expensive to be applied to real-time software stabilization. These facts result in no attractive option for rejecting noise during the feature selection process. Fortunately, noise that was improperly selected as a trackable feature can be more easily detected during later steps of the stabilization process than during feature selection. The details of these detection methods will be discussed in Section 4.1 and Section 5.1. Occlusion also presents a challenge that cannot be detected during feature selection without computationally intensive image analysis techniques. However, if the flat world assumption holds then the effects of occlusion are minimal and can be ignored. The need for this assumption to hold can be seen in the fact that an ideal feature has a high image gradient, which is common at object edges, but occlusion also happens at these same edges. Therefore, if the flat world assumption does not hold then the feature tracking will not be able to find the feature in the next frame. Fortunately, the previously mentioned techniques for detecting noise that was improperly selected as a trackable feature will also detect the problems caused by occlusion. Also of note to the discussion of a feature existing from frame to frame is the concern of a feature leaving the image due to translational motion. Most feature tracking techniques select a list of features and track these features during the entire stabilization process. This works well with video from a hand-held camera, since the video is typically taken from a fixed location and features will not leave the video. 27
However, with UAV video continuous translational motion is very common and causes features to rapidly leave the video. The translation requires that new features are selected with each new frame in place of tracking a fixed list of features selected from the initial video frame. Selecting new features with each frame also simplifies the feature tracking process by removing the need for image boundary checks. 3.1.3
Provides New Information The feature also needs to provide new information that is useful to the stabi-
lization process. Tracking a feature directly adjacent to a previously tracked feature provides no new information that was not available from tracking the original feature. This can be avoided by distributing the features over the entire image. The methods for ensuring an even distribution of features throughout the entire image will be discussed in Section 3.3. 3.2
Feature Rating In order to quantify the previously mentioned characteristics, a feature rating
is assigned to every pixel in the image. This quantification allows for selecting the image regions that can be accurately tracked between frames. Several methods for calculating feature rating will now be discussed. 3.2.1
Gradient Difference The simplest method of determining feature rating is based on the x and y
gradient images, Ix and Iy respectively. Any derivative operator can be used, but the Sobel Kernel [25] is used in the results shown in this thesis. The feature rating is calculated from the gradient images as R(x, y) = (Ix (x, y) + Iy (x, y)) − |Ix (x, y) − Iy (x, y)|.
(3.1)
This rating results in high ratings for areas with both high x and y gradients and will reject horizontal and vertical lines. However, regardless of the derivative operator
28
used, it will not reject diagonal lines. This is a major flaw and leaves room for improvement. 3.2.2
Canny Edge Detector Feature rating based on the Canny edge detector [26] is performed by calcu-
lating the Canny edge image and summing the values over a window centered at the pixel of interest. Like the gradient magnitude method this gives a high rating to areas of the image with high texture content, but also gives a high rating to straight lines and does not address the short coming of the gradient based feature rating. 3.2.3
Forstner Interest Operator The Forstner interest operator [27] is based on the assumption that all images
are made up of points, lines, and segments. Segments are defined by regions which are divided by lines, and points are defined as the intersection of lines. Points receive high feature ratings and do not suffer from the problems of the gradient based and Canny edge detector based methods. However, it is computationally intensive. 3.2.4
Harris Corner Detector Feature ratings with the Harris corner detector are based on the methods
described in [28]. It gives high ratings to areas that have varying brightness in both the x and y directions. This solves the problems apparent in the gradient based and Canny edge detector methods and can be calculated in reasonable time. 3.2.5
Binary Corner Detector The binary corner detector [29] is most similarly related to the Forstner interest
operator in that it relies on extracting physical properties of corners from the image rather than relying solely on gradient calculations. Because of this exploitation of the physical properties of the corner it is more accurate than the Harris corner detector.
29
3.3
Feature Selection Once the feature ratings for the image have been created the features need to
be selected. A region-based and minimum separation method were tested to ensure an even distribution of features. The merits of a simple grid-based feature selection are also presented. 3.3.1
Region Based Feature Selection The region based feature selection method divides the image into regions and
selects the best feature from each region. This method guarantees that all of the features will not be selected from a single area in the image, but it may select several features in very close proximity when an area with high texture value lies close to the intersection of several regions. 3.3.2
Minimum Separation Feature Selection The minimum separation feature selection chooses the features with the high-
est rating from the image but guarantees that no two selected features are within a specified minimum distance. This guarantees that the best possible features are selected and that no clumping of selected features occurs. It requires more computational time, and Section 3.4 will examine the differences between both feature selection methods. 3.3.3
Grid Based Feature Selection Determining feature rating has a relatively high computational cost and select-
ing features based on feature rating is computationally expensive due to the sorting required to select the best features. Chang, Lai, and Lu [8] instead selected features on a fixed grid. This requires detection of invalid features during feature tracking and frame motion estimation, which Chang, Lai, and Lu addressed using iterative least squares. Although this detection process requires significant computation, it is less than the computation required to select features using a more sophisticated selection method. As previously mentioned, invalid feature detection techniques are 30
required to account for the noise common in UAV video, so this method of feature selection can be used to stabilize UAV video with no added cost. The effectiveness of this method is dependent on the invalid feature detection techniques, which will be discussed in the next section. 3.4
Results The discussed methods of determining feature rating aim to quantify the prop-
erties of an ideal feature discussed in Section 3.1. Two common problems with feature rating are incorrectly assigning high ratings to a non-unique feature, such as a line, and improperly rating noise as a valid feature. The ability of the feature rating methods to reject lines and handle noise will now be examined. 3.4.1
Feature Rating As previously mentioned, it is impossible to detect all non-unique features at
real-time rates during the feature selection process. However, lines are a very common type of non-unique feature that can be easily rejected through the use of the proper feature rating. Figure 3.2 shows the feature ratings assigned to a section of UAV video footage by each of the proposed feature rating methods with black representing areas with high feature rating and white representing areas with low feature rating. It is very apparent that the gradient difference and Canny edge detector assign high ratings along lines from Figure 3.2(b) and Figure 3.2(c). The Forstner operator incorrectly assigns high ratings to a few locations on the roof in Figure 3.2(d), but it does not suffer from the problems apparent in the gradient difference and Canny edge detector feature rating methods. The Harris corner detector yields the best results in this image and correctly selects strong features on the corners of the house and at the intersections of the sidewalk in Figure 3.2(e). The binary corner detector also performs well and only selects strong features in Figure 3.2(f), but also incorrectly rejects a few strong features. The ability to properly handle the high noise levels of UAV video is also essential to ensure appropriate feature selection. Figure 3.3 shows the effects of noise 31
(a) Original Image
(b) Gradient Difference
(c) Canny Edge Detector
(d) Forstner Operator
(e) Harris Corner Detector
(f) Binary Corner Detector
Figure 3.2: Feature rating is shown in the images as black being the highest rating and white being the lowest rating. The gradient difference (b) and Canny edge detector (c) images give high ratings to lines. The Forstner operator (d) incorrectly gives high ratings on the roof of the house. The Harris corner detector (e) and binary corner detector (f) give results that satisfy the characteristics discussed in Section 3.1, but the binary corner detector incorrectly rejects valid features on the corner of the roof and sidewalk.
32
on the various methods of determining feature rating with black representing areas with high feature rating and white representing areas with low feature rating. The gradient difference incorrectly assigns a high rating to the noise in Figure 3.3(b). Noise that is purely horizontal or vertical would be rejected by the gradient different, but most noise in UAV video has at least some diagonal component. The Canny edge detector is heavily biased by the noise in the UAV in Figure 3.3(c) and assigns higher ratings to the noise than to several valid features in the video. Because of its reliance on the properties of a point, the Forstner operator does not assign high ratings to the noise in Figure 3.3(d). However, the Harris corner detector assigns a higher rating to the noise near the sidewalk than to any of the true features in Figure 3.3(e). Like the Forstner operator, the binary corner detector is not effected by the noise because of its reliance on the geometric properties of a corner, as shown in Figure 3.3(f). These results have shown that the gradient difference and Canny edge detector feature rating methods are not suitable for use with UAV video because of their tendency to assign high values to lines and their susceptibility to noise. Despite having excellent noise rejection properties, the Forstner operator has a fairly high false positive rate and because of this it does not satisfy the criteria needed to select features during stabilization of UAV video. This leaves the Harris corner detector and binary detector as possible candidates for use with UAV video. The Harris corner detector is negatively effected by noise, whereas the binary corner detector has excellent noise rejection properties. However, the binary corner detector does not yield a rating of feature strength, and therefore does not provide a metric for selecting a single feature from a tightly bunched group. Therefore, the Harris corner detector is our choice for determining feature rating in UAV video. Because of the Harris corner detector’s tendency to select noise as features, noise detection will need to be performed during feature tracking and frame motion estimation. Methods for handling noise during these steps of the stabilization process will be addressed in Chapter 4 and Chapter 5.
33
(a) Original Image
(b) Gradient Difference
(c) Canny Edge Detector
(d) Forstner Operator
(e) Harris Corner Detector
(f) Binary Corner Detector
Figure 3.3: Feature rating is shown in the images as black being the highest rating and white being the lowest rating. The gradient difference (b), Canny edge detector (c), and Harris corner detector (e) are all negatively affected by the noise. However, the Forstner operator (d) and binary corner detector (f) reject the noise because of their reliance on the properties of a corner in determining feature rating.
34
3.4.2
Feature Selection Method Once feature ratings have been assigned, features must be selected, so that
feature tracking can be performed. Since the grid-based method always gives identical results, only the region-based and minimum separation methods will be examined. The primary concern of feature selection is ensuring that each new feature provides new information, as discussed in Section 3.1.3. Guaranteeing that each feature provides new information to the stabilization process is done by ensuring that the features are evenly distributed throughout the image. Figure 3.4 shows the distribution of features when the minimum separation and region-based feature selection methods are used in an area of the image with low noise levels. It can be seen in Figure 3.4(a) that the minimum separation method ensures that no two features are tightly grouped and selects the best features available in the image. Figure 3.4(b) shows the improper grouping that can occur when region boundaries fall on an area with high feature rating. The region-based method also requires a single feature be selected in each region, so regions with poor overall feature rating result in the selection of a sub-optimal feature and regions with high overall feature rating can reject several high quality features. Figure 3.5 shows the feature distribution in an area of the image with high noise levels. Figure 3.5(a) shows how the areas with high noise levels are incorrectly selected as features, but several valid features are still selected on the houses and cars in the image. Figure 3.5(a) shows how the constraint of a single feature per region reduces the number of features selected in the area with high noise levels. But, this same constraint results in very few valid features being selected on the houses and cars in the image. Both of these results show why the minimum separation feature selection method is our choice for selecting features in UAV video.
35
(a) Minimum Separation
(b) Region-Based
Figure 3.4: The red crosses show the selected features and the blue lines show the region boundaries in (b).
(a) Minimum Separation
(b) Region-Based
Figure 3.5: The red crosses show the selected features and the blue lines show the region boundaries in (b).
36
Chapter 4 Feature Tracking
User Target Tracking
Current Video Frame Previous Video Frame
Feature Selection
Features in Previous Frame
Feature Tracking
Feature Motion Vectors
Frame Motion Estimation
Frameto-Frame Motion Intended Motion Estimation
Video Display
Intended Motion
Target Location in Frame
Synchronized Telemetry
Estimate Target Location Target Location in World
Figure 4.1: Using the previous video frame and the list of features that is output from feature selection, feature tracking is performed on the current video frame. It outputs a list of feature motion vectors to be used to estimate frame motion.
Feature tracking uses the list of selected features from the previous frame and estimates their position in the current frame. This creates a set of feature motion vectors that will then be used to estimate the motion needed to overlay the current frame on the previous frame to minimize the visible motion. As with feature selection, the focus of this chapter is not a thorough investigation of existing feature tracking techniques, but will give a brief overview of several feature tracking techniques that were evaluated during the development process, along with an evaluation of their effectiveness with UAV video.
37
4.1
Template Matching Template matching is accomplished by using a window centered about the
feature in the previous frame that is compared with a search window in the current frame using sum of squared differences or sum of absolute differences. As previously discussed, this method assumes that no significant rotation is occurring at the feature level and that no significant lighting changes are occurring between frames. Both of these assumptions are valid in all but the most extreme UAV video. Section 3.1 discussed problems that are impossible to detect during the feature selection process without computationally intensive image analysis techniques—repeating patterns and noise that is incorrectly selected as a feature. These problems can be detected by adding constraints to the template matching. Features that are caused by noise will not be consistent from frame to frame and so a close match will not exist in the next frame, so these features can be rejected by requiring that the difference between the template and the matched feature lie below a minimum threshold. This minimum threshold was found by examining the typical error of correctly tracked features in a variety of UAV video. A threshold of 1.5% of the maximum possible error was found to reject most invalid features while rejecting less than 5% of the valid features. The second constraint is designed to handle features that occur in a problem area, such as features that are part of a repeating pattern or lie on a line. Features that occur in problem areas can be detected by requiring that there be only a single close match in the search window. These methods make use of the data available in the image without the complex image analysis techniques required to reject them during feature selection, thus providing accurate invalid feature detection without excessive increases in computational costs. The specific values of these thresholds were obtained through the analysis of a wide variety video types; including video from a 2-axis gimballed camera, a fixed forward looking camera, a fixed downward looking camera, and a fixed camera looking out the right wing. The determined thresholds were chosen to be very liberal and worked well on all of the previously mentioned video. These values represent the only set of pre-determined constants in the stabilization system and could be removed. Removal of these constraints requires all noise rejection to be 38
done during the frame motion estimation, but still yields equivalent results. However, the benefits of these constraints will be examined in Section 4.4. Pyramidal techniques are commonly used to increase the performance of image processing. Template matching can be done pyramidally by performing a course to fine template match. A small template window is used to track the feature on the top level of the pyramid. The feature is then tracked on successive levels of the pyramid with progressively larger template windows until the feature is tracked on the original frame. Since the template matches on each of the levels of the pyramid are performed using the described template matching techniques, the same techniques for detecting noise during the tracking process can be applied to each match done as the feature is tracked down the pyramid. However, the dramatic decrease in computational cost does come at a price, and the disadvantages of using pyramidal template matching will be discussed in Section 4.4.3. 4.2
Profile Matching The profile matching technique is done by creating a vertical and horizontal
profile from a window centered about the feature in the previous frame. The same profiles are generated for every location in the search window of the current frame and the closest match is found using sum of squared differences or sum of absolute differences. For a square template window of size m and a square search window of size n this operation is O(mn2 ) rather than the O(m2 n2 ) required for template matching. However, this marked decrease in computational cost does come at a price. The work done by Ratakonda [7] showed that profile matching is 10 to 15% less accurate than template matching. The accuracy problems are compounded when pyramidal techniques are used and the noise detection techniques discussed in the previous section cannot be effectively applied. These costs outweigh the benefits of profile matching when considering the high noise levels of UAV video.
39
4.3
Optical Flow Optical flow estimates the motion that occurred at the pixel of interest and
can be used as an estimate of feature motion. Two methods are most commonly used: Horn and Schunck [30] and Lucas and Kanade [31]. These methods can only handle motion of one to two pixels between frames and are not suitable for the high levels of motion experienced in UAV video. However, a pyramidal version of the Lucas & Kanade method that can handle large scale motion has been developed [32]. This pyramidal method requires slightly more computation than the pyramidal template matching technique, but does not have the same invalid feature detection properties. Like the work of Chang, Lai, and Lu [8], this method relies on the invalid feature detection performed during frame motion estimation to remove improperly tracked features. Methods for detecting improperly tracked features during frame motion estimation will be discussed in the next chapter. 4.4
Results Because of the problems with profile matching discussed in Section 4.2, only
the template matching and optical flow methods will be discussed. First the accuracy of each of the feature tracking methods in areas of the image with low noise levels will be examined, then the ability of each of the methods to reject features that exist in areas of the image with high noise levels will be discussed. In conclusion, the effects of performing a coarse to fine pyramidal template match will be shown. 4.4.1
Low Noise Levels The most important aspect of tracking features in areas of the image with
low noise level is accurately tracking these features, so that frame-to-frame motion can be accurately estimated. Figure 4.2 shows the results of the template matching and optical flow methods on an area of the image with low noise levels. Figure 4.2(c) shows the feature tracking results from the template matching method. The template matching method correctly tracks the majority of the features, but incorrectly tracks the feature on the sidewalk and the previously discussed constraints reject two features 40
at the base of the house and a feature on the car. Figure 4.2(d) shows the feature tracking results from the optical flow method. The majority of features are correctly tracked and it is able to track one of the features at the base of the house and the feature on the car that was rejected by the constraints of the template matching method. It also incorrectly tracks the same feature on the sidewalk that the template matching method incorrectly tracked, and incorrectly tracks the other feature at the base of the house that the constraints of the template matching method rejected. 4.4.2
High Noise Levels The most important factor of feature tracking in areas with high noise levels is
rejecting features that cannot be accurately tracked, so that the estimate of frame-toframe motion is not improperly biased. Figure 4.3 shows the results of the template matching and optical flow methods on an area of the image with high noise levels. Figure 4.3(c) shows the features that are correctly rejected in high noise areas by the template matching constraints. Figure 4.3(d) shows the features that are incorrectly tracked by the optical flow method. These incorrectly tracked features create the need for noise rejection during the estimation of frame-to-frame motion. These results present the strengths and weaknesses of the template matching and optical flow methods. The template matching method is capable of rejecting features in high noise areas, but occasionally rejects valid features in areas with low noise levels. The optical flow method is capable of tracking features in areas with low noise levels that cannot be tracked by the template matching method, but incorrectly tracks features in areas with high noise levels. Also, the template matching method is an order of magnitude more computationally intensive than the optical flow method. Fortunately, as mentioned in Section 4.1, template matching can be performed in a coarse to fine manner using pyramidal techniques to reduce the computational cost to less than the cost of the optical flow method. Unfortunately, this dramatic reduction in computational cost does come at a price.
41
(a) Original Image
(b) Translated Image
(c) Template Matching
(d) Optical Flow
Figure 4.2: The feature motion vectors are shown as green lines and the features that could not be correctly tracked are shown as red dots. With low noise levels, the feature tracking performed by the template matching and optical flow methods yield almost identical results with most features. However, the optical flow method is able to track a feature on the car and a feature below the house that cannot be tracked by template matching. Both methods incorrectly track the feature on the far right of the image on the sidewalk, and the optical flow method incorrectly tracks a feature at the base of the house that is rejected by the non-unique check of the template matching method.
42
(a) Original Image
(b) Translated Image
(c) Template Matching
(d) Optical Flow
Figure 4.3: The feature motion vectors are shown as green lines and the features that could not be correctly tracked are shown as red dots. The template matching method correctly rejects the features in the areas with high noise levels, but the optical flow method incorrectly tracks all of the features in the areas with high noise levels. The optical flow method is able to track a feature in the upper left quadrant of the image that the template matching method is unable to track
4.4.3
Pyramidal Template Matching The pyramidal template matching technique reduces the average cost of tem-
plate matching from 0.75 milliseconds per feature to 0.05 milliseconds per feature on a 3.2 GHz Pentium IV processor. This reduction in computational cost allows for a dramatic increase in the number of features that can be tracked in real-time. The use of the pyramidal template matching method results in a 10% decrease in the number of correctly tracked features, but due to the order of magnitude increase in the total number of features that can be tracked, the pyramidal template matching method can still be effectively applied to UAV video. Figure 4.4 shows the negative effects of the pyramidal template matching method. The pyramidal template match-
43
ing method occasionally finds an incorrect match at the lowest level of the pyramid and generates an incorrect feature motion vector similar to those seen with the optical flow method in high noise areas in Figure 4.3(d). These incorrectly tracked features are less frequent than the incorrectly tracked features generated by the optical flow method in the areas with high noise levels, because they are caused by non-unique scene content that is not detected by the constraints proposed in Section 4.1, rather than transmission noise. Despite the decrease in false negative rate and the increase in false positive rate, the pyramidal template matching method is the least computationally intensive and inherits the noise rejection properties of the standard template matching method, so it is our choice for tracking features in the stabilization of UAV video.
44
(a) Original Image
(b) Translated Image
(c) Standard Template Matching
(d) Pyramidal Template Matching
Figure 4.4: The feature motion vectors are shown as green lines and the features that could not be correctly tracked are shown as red dots. The largest problem caused by pyramidal template matching can be seen in the incorrectly tracked feature on the left side of the house. The coarsest match identifies the incorrect corner of the house and the successive refinements up the pyramid cannot correct this problem. Also, the pyramidal technique rejects several valid features that are correctly tracked by the standard template matching method.
45
46
Chapter 5 Frame Motion Estimation
User Target Tracking
Current Video Frame Previous Video Frame
Feature Selection
Features in Previous Frame
Feature Tracking
Feature Motion Vectors
Frame Motion Estimation
Frameto-Frame Motion Intended Motion Estimation
Video Display
Intended Motion
Target Location in Frame
Synchronized Telemetry
Estimate Target Location Target Location in World
Figure 5.1: Frame motion estimation is performed using the list of feature motion vectors to output the frame-to-frame video motion.
The set of feature motion vectors retrieved during feature tracking are used to estimate the motion needed to overlay the current frame on the previous frame to minimize the visible motion. In order to estimate this motion, the feature motion vectors must be fit to a frame motion model. This chapter will discuss two motion models, how motion is estimated from the feature motion vectors based on these models, and two methods of detecting improperly tracked features for both of these models.
47
5.1
Frame Motion Models Constraining the motion of the video to a model allows an estimate of frame-
to-frame motion to be retrieved from the feature motion vectors. The two motion models used are a translational model and an affine model. Both of the models constrain the frame motion to two-dimensional motion. Even though the motion in the video is three-dimensional, the motion occurring between frames can be adequately estimated using a two-dimensional model. There are two benefits that come from using a two-dimensional model. The first benefit is that the feature motion vectors are two-dimensional, causing the estimation to be less prone to error than if a threedimensional model were used. Extracting three-dimensional motion with real world, Euclidean values from a set of two-dimensional feature motion vectors is impossible without knowledge of the scene or an initial estimate of camera motion. Neither of these are available during real-time video stabilization and reconstruction of this information based solely on computer vision techniques is still an unsolved problem. The second advantage of using a two-dimensional motion model is that mosaicing the individual frames can be done very simply. This allows for reconstructing undefined video regions with minimal added cost and will be discussed in the next chapter. The remainder of this chapter will discuss these models, as well as methods for detecting incorrectly tracked features in the set of feature motion vectors. 5.2
Translational Model The translational model allows only for x and y translation. The estimate
is found by taking the average of the feature motion vectors. This method cannot account for the rotation that is very common in UAV video and can be incorrectly biased by the distribution of features during the feature selection process. Figure 5.2 shows the biasing that can happen when the translational model is used and the feature motion vectors are not evenly distributed. Two methods of detecting incorrectly tracked features will now be presented. These detection methods tend to incorrectly reject valid features when used with the
48
200
200
200
180
180
180
160
160
160
140
140
140
120
120
120
100
100
100
80
80
80
60
60
60
40
40
40
20
20
0
0
20
40
60
80
100
120
140
160
180
200
(a) Feature Motion Vectors
0
20
0
20
40
60
80
100
120
140
160
180
0
200
0
(b) Iterative Least Squares Inliers
20
40
60
80
100
120
140
160
180
200
(c) RANSAC Inliers
Figure 5.2: Due to the use of an average in determining the frame-to-frame motion estimate in the translational model, the distribution of features can incorrectly bias the estimate. (a) shows feature motion vectors with a 1 degree rotation, an x translation of 10, a y translation of 7. Motion vectors are twice as frequent in the lower right quadrant of the figure and the resulting estimate is (10.2, 7.2) compared to the exact estimate of (10, 7) when no biasing is present; (b) shows the points selected as inliers using the iterative least squares method. A definite biasing towards the lower right quadrant is apparent and the resulting estimate is (10.2, 7.2); and (c) shows the points selected as inliers using the RANSAC method. Once again, a biasing towards the lower right quadrant is apparent and the resulting estimate is (10.3, 7.4).
translational model, but an important intuition regarding the underlying properties of the detection methods are evident from analysis of the results. 5.2.1
Iterative Least Squares Iterative least squares refinement is discussed in [33] and it has been employed
during video stabilization by Chang, Lai, and Lu [8]. However, we must first show that the average used to find the translational model is a least squares method. This can be seen if we define the average in the following manner, Ax = b where
(5.1)
T
A=
1 0 1 0 ...
1 0
0 1 0 1
0 1
h x=
iT Tx Ty
49
,
,
(5.2)
(5.3)
and h b=
x1 −
x01
y1 −
y10
x2 −
x02
y2 −
y20
···
xn −
x0n
yn −
yn0
iT
.
(5.4)
(xi , yi ) is the location of feature i in the previous frame, (x0i , yi0 ) is the location of the same feature in the current frame, and the values, Tx and Ty , are the estimated frame-to-frame motion. This least squares problem can be shown to be equivalent to the average of the points (xi −x0i , yi −yi0 ) by noting that the A matrix is independent of the points (xi , yi ) and (x0i , yi0 ) and that for an A matrix of size 2n x 2 that (AT A)−1 AT will be the identity matrix scaled by n1 . Therefore, the solution, x, will be the average of the feature motion vectors. Iterative least squares refinement is done by determining the least squares solution, calculating the error statistics of the data set compared to the calculated motion and then removing any data points that have an error greater than a given threshold, typically one standard deviation. With the translational model this is done by calculating the mean and standard deviation of the feature motion vectors and then removing any that are more than one standard deviation from the mean. When the dominant motion in the video is purely translational, this works very well. Unfortunately, the motion in UAV video is rarely confined to translational motion and this method will either reject several valid feature motion vectors or accept all feature motion vectors. Figure 5.3(b) shows an example of the improper rejection of valid features that occurs when the frame motion is not purely translational. Also, if the features are not evenly distributed, then this method will exaggerate the biasing caused by the grouping of features that was previously discussed in regards to Figure 5.2(b). An analysis of these effects will be presented in Section 5.5. 5.2.2
RANSAC RANSAC [34] is another method for rejecting outliers during estimation.
RANSAC requires the use of a model that can be estimated using at least n points. It is performed by selecting n random points from the data set and estimating the
50
200
200
200
180
180
180
160
160
160
140
140
140
120
120
120
100
100
100
80
80
80
60
60
60
40
40
40
20
20
0
0
20
40
60
80
100
120
140
160
180
200
(a) Feature Motion Vectors
0
20
0
20
40
60
80
100
120
140
160
180
200
(b) Iterative Least Squares Inliers
0
0
20
40
60
80
100
120
140
160
180
200
(c) RANSAC Inliers
Figure 5.3: The iterative least squares and RANSAC methods improperly rejects rotation as noise when used with the translational model. (a) shows feature motion vectors with a 1 degree rotation, an x translation of 10, and a y translation of 7; (b) shows the points selected as inliers using the iterative least squares method; and (c) shows the points selected as inliers using the RANSAC method.
model. All other points in the data set are compared to this model and all points that lie within a specified threshold of the model are defined as inliers. This process is repeated several times and the largest set of inliers is used as the set of inliers for determining the final estimate. Applying RANSAC to the feature motion vector data set with the translational model is done by using a single feature motion vector as the estimate and then finding the set of inliers by selecting the feature motion vectors that lie within a threshold of that estimate. This is repeated a fixed number of times and then the largest set of inliers is used to calculate the final estimate. Rather than selecting the largest set of inliers as the final estimate, the final set of inliers can be determined by calculating the estimate from each set of inliers and selecting the set with the smallest standard deviation. This modification to the RANSAC method increases its similarities with the iterative least squares method, but a discussion of the fundamental differences will be done in the next section. When the motion is not purely translational, the RANSAC used with the translational model will reject several valid features as can be seen in Figure 5.3(c). Also, the estimate can be biased by the grouping of features and worsens the previously mentioned biasing that is shown in Figure 5.2(c). Like iterative least squares, RANSAC rejects several valid features and yields worse results than no outlier rejection. An analysis of these effects will be done in Section 5.5. 51
5.3
Properties of Iterative Least Squares and RANSAC It has been shown that the iterative least squares and RANSAC rejection
methods are detrimental when used with the translational model, but an important intuition of the properties of both rejection methods can be gathered from the results shown in Figure 5.3. This intuition comes from viewing the translation as the signal and the rotation as the noise. The iterative least squares method is based on the assumption that the noise is zero mean and outliers will fall outside a threshold defined by the standard deviation, so the selected points in Figure 5.3(b) lie in a band in the middle of the data set. RANSAC assumes that the noise is uncorrelated and that a subset of data that is correlated with respect to the model exists, so the selected points in Figure 5.3(c) are in a group in the data set. The accuracy of each method is therefore dependent on the type of noise present in the data set. Figure 5.4 shows the performance of the iterative least squares and RANSAC methods on a data set with zero mean noise. Due to the high noise levels, a incorrect subset of correlated feature motion vectors is found by the RANSAC method and an inaccurate estimate is generated. The iterative least squares method performs well due to the canceling of the zero mean noise by the averaging. Figure 5.5 shows the effectiveness of the RANSAC method on non-zero mean noise methods where a correlated subset can be found. The iterative least squares estimate is biased incorrectly by the non-zero mean noise and produces an inaccurate estimate. Sensor noise is typically zero mean and lends itself well to the iterative least squares method. However, noise introduced by incorrectly tracked features is non-zero mean; making RANSAC the superior choice for noise detection during frame motion estimation. However, this distinction between iterative least squares and RANSAC diminishes as noise levels decrease and the size of the data sets increases. The translational model has been shown to lack the ability to accurately classify the motion that occurs in UAV video and the outlier rejection techniques are unreliable at best, so a more advanced model must be used.
52
200
200
200
180
180
180
160
160
160
140
140
140
120
120
120
100
100
100
80
80
80
60
60
60
40
40
40
20
20
0
0
20
40
60
80
100
120
140
160
180
200
(a) Feature Motion Vectors
0
20
0
20
40
60
80
100
120
140
160
180
200
0
0
(b) Iterative Least Squares Inliers
20
40
60
80
100
120
140
160
180
200
(c) RANSAC Inliers
Figure 5.4: The iterative least squares method easily reject zero mean noise, but the RANSAC method is unable to locate a valid set of correlated data in the set of feature motion vectors. (a) shows feature motion vectors from a translation of (10, 7) with uniformly distributed zero mean noise in the range [-5, 5]; (b) shows the points selected as inliers using the iterative least squares method and the resulting estimate being (9.9, 7.6); and (c) shows the points selected as inliers using the RANSAC method and the resulting estimate being (7.9, 9.1).
200
200
200
180
180
180
160
160
160
140
140
140
120
120
120
100
100
100
80
80
80
60
60
60
40
40
40
20
20
0
0
20
40
60
80
100
120
140
160
180
200
(a) Feature Motion Vectors
0
20
0
20
40
60
80
100
120
140
160
180
200
(b) Iterative Least Squares Inliers
0
0
20
40
60
80
100
120
140
160
180
200
(c) RANSAC Inliers
Figure 5.5: The iterative least squares method is incorrectly biased by the non-zero mean noise, but the RANSAC method is able to locate a valid set of correlated data and results in an accurate estimate of frame-to-frame motion. (a) shows feature motion vectors from a translation of (10, 7) with three quarters of the data points having uniformly distributed non-zero mean noise in the range [0, 1] and the other quarter having uniformly distributed non-zero mean noise in the range [0, 5]; (b) shows the points selected as inliers using the iterative least squares method and the resulting estimate being (12.3, 8.8); and (c) shows the points selected as inliers using the RANSAC method and the resulting estimate being (10.7, 7.5).
53
5.4
Affine Model The Affine Model is defined as
x0 y
0
= s
cos(θ) − sin(θ) sin(θ)
x y
cos(θ)
Tx
+
Ty
.
(5.5)
This model allows for rotation, uniform x and y scaling, and x and y translation. The parameter θ is the rotation, s is uniform x and y scaling factor, and Tx and Ty are the respective translations. As previously stated, this model lacks the ability to represent the true three-dimensional motion occurring in the video, but can be used to adequately estimate the motion between frames and has the advantages noted in Section 5.1. The parameters of the affine model can be estimated using least squares. 5.4.1
Least Squares The least squares method of estimating the parameters of the affine model
from the feature motion vectors is defined as Ax = b where
(5.6)
A=
x01
−y10
1 0
y10
x01
0 1
x02 −y20 1 0 y20
x02 .. .
0 1
x0n −yn0 1 0 yn0
x0n
and
(5.7)
,
(5.8)
0 1
h x=
,
iT a b c d
h b=
iT x1 y1 x2 y2 · · · 54
xn y n
.
(5.9)
The location of the features are defined as follows; (xi , yi ) is the location of feature i in the previous frame and (x0i , yi0 ) is the location of the same feature in the current frame. Solving this will yield the values a, b, c, and d where a and b are the combined rotation and scaling, and c and d are the translation. It should be noted that this method does not inherently constrain the values of a and b to satisfy the relationship a = s cos(θ)
(5.10)
b = s sin(θ),
(5.11)
and
but accurate estimates of θ and s can be extracted by the definitions θ = tan
−1
µ ¶ b a
(5.12)
and s= 5.4.2
a . cos θ
(5.13)
Iterative Least Squares Iterative least squares is performed with the affine model by calculating the
frame motion estimate using the least squares solution discussed in the previous section, and by then applying the methods discussed in Section 5.2.1. An analysis of the effectiveness of iterative least squares when used with the affine model will be conducted in Section 5.5. 5.4.3
RANSAC RANSAC is performed with the affine model by randomly selecting two feature
motion vectors and solving for the parameters of the affine model as a=
(x0a − x0b )xa + (ya0 − yb0 )ya + (x0b − x0a )xb + (yb0 − ya0 )yb , det(A)
55
(5.14)
b=
(yb0 − ya0 )xa + (x0a − x0b )ya + (ya0 − yb0 )xb + (x0b − x0a )yb , det(A)
(5.15)
c=
αxa + βya + γxb + κyb , det(A)
(5.16)
d=
βxa + αya + κxb + γyb det(A)
(5.17)
and
where 0 0 0 0 02 02 02 det(A) = x02 a + ya + xb + yb − 2xa xb − 2ya yb ,
(5.18)
02 α = −ya0 yb0 − x0a x0b + x02 b + yb ,
(5.19)
β = −ya0 x0b + yb0 x0a ,
(5.20)
0 0 02 0 0 γ = x02 a − xa xb + ya − ya yb ,
(5.21)
κ = ya0 x0b − yb0 x0a ,
(5.22)
and
and the feature motion vectors are defined as follows: (xa , ya ) is the point of the first feature motion vector in the previous frame, (x0a , ya0 ) is the point of the first feature motion vector in the current frame, (xb , yb ) is the point of the second feature motion vector in the previous frame, and (x0b , yb0 ) is the point of the second feature motion vector in the current frame. The points in the data set are compared to this model and every point that lies within a specified threshold of the model is selected as an inlier. As previously mentioned, the largest set of inliers is used to determine the final estimate. The advantages of using RANSAC during frame motion estimation with the affine model will be discussed in the next section. 5.5
Results The results of the translational model have been previously discussed in Sec-
tion 5.2 and Section 5.3, and the effectiveness and properties of the iterative least squares and RANSAC methods when used with the translational model have been examined in Section 5.3. The effectiveness of the proposed techniques for estimating 56
frame-to-frame motion in UAV video will not be examined in this chapter, but will be thoroughly discussed with respect to the display process in Section 6.3. The ability of the affine model to classify three-dimensional motion and the effectiveness of the iterative least squares and RANSAC rejection methods in regards to the three-dimensional motion will now be discussed. 5.5.1
Affine Model with Three-Dimensional Motion The ability of the affine model to represent three-dimensional motion is most
easily examined through the analysis of the motion experienced from a UAV with a downward looking fixed-camera. Examining the ability of the affine model to accurately estimate the effects of changes in each of the parameters of the standard UAV six degree-of-freedom model gives valuable insight into the ability of the affine model to stabilize UAV video. Figure 5.6 shows the three-dimensional motion that can be accurately described using the affine model and Figure 5.7 shows the three-dimensional motion that cannot be accurately described using the affine model. Figure 5.6(b) shows that any x and y translation of the UAV can be perfectly estimated using the x and y translation of the affine model. Figure 5.6(d) shows that any z translation of the UAV can be sufficiently estimated using the scaling of the affine model. Figure 5.6(f) shows that any ψ rotation of the UAV can be perfectly estimated using the rotation of the affine model. Figure 5.7(d) shows that large φ rotation of the UAV cannot be accurately estimated using the affine model and Figure 5.7(b) shows that large θ rotation of the UAV cannot be accurately estimated using the affine model. These results have shown that the changes in the majority of parameters of the standard UAV six degree-of-freedom model can be accurately described with the affine model. The least squares estimation technique will estimate the parameters of the affine model that result in the best estimate of the three-dimensional motion that is possible with the affine model. Fortunately, when frame motion is estimated in realtime the the rotations experienced during flight are typically small enough that they can be adequately represented using the affine model, but these results have shown that the affine model cannot correctly estimate all motion experienced by the UAV. 57
The resulting estimation error will result in inaccurate motion estimation when there is significant rotation in either φ or θ. 5.5.2
Iterative Least Squares and RANSAC Since x, y, and z translations and the ψ rotation can be accurately estimated
by the affine model, the iterative least squares and RANSAC methods will properly detect incorrectly tracked features when the dominant motion is confined to these values. However, the inability of the affine model to account for large φ and θ rotation of the UAV poses significant problems for the iterative least squares and RANSAC rejection methods. As with the rotational motion and translation model discussed in Section 5.2.1 and Section 5.2.2, the iterative least squares method and RANSAC method will result in the rejection of several valid feature motion vectors. Figure 5.8 shows the improper rejection that occurs when the iterative least squares and RANSAC methods applied to feature motion vectors containing large φ rotation of the UAV. Figure 5.8(b) shows that the iterative least squares method accepts all of the feature motion vectors, and Figure 5.8(c) shows the set of feature motion vectors selected by the RANSAC method that are grouped together in the bottom half of the image where the highest correlation of feature motion vectors exists. Figure 5.9 shows the improper rejection that occurs when the iterative least squares and RANSAC methods applied to feature motion vectors containing large θ rotation of the UAV. Figure 5.9(b) shows that the iterative least squares accepts features near the center of motion that was seen in Figure 5.7(b), and Figure 5.9(c) shows the set of feature motion vectors selected by the RANSAC method that are near the center of the image where the highest correlation of feature motion vectors exists.
58
1
1
0.8
0.8
0.6
0.6
0.4
0.4
0.2
0.2
0
0
−0.2
−0.2
−0.4
−0.4
−0.6
−0.6
−0.8
−0.8
−1 −1
−0.8
−0.6
−0.4
−0.2
0
0.2
0.4
0.6
0.8
−1 −1
1
(a) True X and Y Translation 1
1
0.8
0.6
0.6
0.4
0.4
0.2
0.2
0
0
−0.2
−0.2
−0.4
−0.4
−0.6
−0.6
−0.8
−0.4
−0.2
0
0.2
0.4
0.6
0.8
1
−0.8
−0.8
−0.6
−0.4
−0.2
0
0.2
0.4
0.6
0.8
−1 −1
1
(c) True Z Translation 1
1
0.8
0.6
0.6
0.4
0.4
0.2
0.2
0
0
−0.2
−0.2
−0.4
−0.4
−0.6
−0.6
−0.8
−0.8
−0.8
−0.6
−0.4
−0.2
0
0.2
0.4
0.6
−0.8
−0.6
−0.4
−0.2
0
0.2
0.4
0.6
0.8
1
(d) Estimated Z Translation
0.8
−1 −1
−0.6
(b) Estimated X and Y Translation
0.8
−1 −1
−0.8
0.8
−1 −1
1
(e) True ψ Rotation
−0.8
−0.6
−0.4
−0.2
0
0.2
0.4
0.6
0.8
1
(f) Estimated ψ Rotation
Figure 5.6: The feature motion vectors shown in the left hand column are the true feature motion vectors after the specified three-dimensional transformation is performed and they have been converted to two-dimensional feature motion vectors. The feature motion vectors in the right hand column are the plotted two-dimensional feature motion vectors from estimating the movement in the image in the left hand column using the affine model. All of the estimated feature motion vectors match the true feature motion vectors exactly to working numerical precision. (a) shows the feature motion vectors from an x translation of 5 m and a y translation of 4 m at an altitude of 50 m; (b) shows the correct estimate of translation as (0.1, 0.08); (c) shows the feature motion vectors from a z translation of 5 at an altitude of 50 m; (d) shows the correct estimate of a scalar factor of 0.91; (e) shows the feature motion vectors from a ψ rotation of 5o at an altitude of 50 m; and (f) shows the correct estimation of a rotation of 5o .
59
1
1
0.8
0.8
0.6
0.6
0.4
0.4
0.2
0.2
0
0
−0.2
−0.2
−0.4
−0.4
−0.6
−0.6
−0.8
−0.8
−1 −1
−0.8
−0.6
−0.4
−0.2
0
0.2
0.4
0.6
0.8
−1 −1
1
−0.8
(a) True θ Rotation 1
1
0.8
0.6
0.6
0.4
0.4
0.2
0.2
0
0
−0.2
−0.2
−0.4
−0.4
−0.6
−0.6
−0.8
−0.8
−0.8
−0.6
−0.4
−0.2
0
0.2
0.4
−0.4
−0.2
0
0.2
0.4
0.6
0.8
1
0.8
1
(b) Estimated θ Rotation
0.8
−1 −1
−0.6
0.6
0.8
−1 −1
1
(c) True φ Rotation
−0.8
−0.6
−0.4
−0.2
0
0.2
0.4
0.6
(d) Estimated φ Rotation
Figure 5.7: The feature motion vectors shown in the left hand column are the true feature motion vectors after the specified three-dimensional transformation is performed and they have been converted to two-dimensional feature motion vectors. The feature motion vectors in the right hand column are the plotted two-dimensional feature motion vectors from estimating the movement in the image in the left hand column using the affine model. (a) shows the feature motion vectors from a θ rotation of 5o at an altitude of 50 m; (b) shows the incorrect estimate of a scaling of 0.92 and a translation of (0, -0.08); (c) shows the feature motion vectors from a φ rotation of 5o at an altitude of 50 m; and (d) shows the incorrect estimation of a scaling of 1.2, a rotation of 4.98o , and a translation of (0.1, -0.2).
60
1
0.8
0.6
0.4
0.2
0
−0.2
−0.4
−0.6
−0.8
−1 −1
−0.8
−0.6
−0.4
−0.2
0
0.2
0.4
0.6
0.8
1
0.8
1
0.8
1
(a) Feature Motion Vectors 1
0.8
0.6
0.4
0.2
0
−0.2
−0.4
−0.6
−0.8
−1 −1
−0.8
−0.6
−0.4
−0.2
0
0.2
0.4
0.6
(b) Iterative Least Squares 1
0.8
0.6
0.4
0.2
0
−0.2
−0.4
−0.6
−0.8
−1 −1
−0.8
−0.6
−0.4
−0.2
0
0.2
0.4
0.6
(c) RANSAC
Figure 5.8: The incorrect rejection that occurs with large φ rotations of the UAV. (a) shows the feature motion vectors from a φ rotation of 5o at an altitude of 50 m; (b) shows that all feature motion vectors are selected by the iterative least squares method; and (c) shows the incorrectly selected group of features selected at the bottom of the image where the correlation is the strongest.
61
1
0.8
0.6
0.4
0.2
0
−0.2
−0.4
−0.6
−0.8
−1 −1
−0.8
−0.6
−0.4
−0.2
0
0.2
0.4
0.6
0.8
1
0.8
1
0.8
1
(a) Feature Motion Vectors 1
0.8
0.6
0.4
0.2
0
−0.2
−0.4
−0.6
−0.8
−1 −1
−0.8
−0.6
−0.4
−0.2
0
0.2
0.4
0.6
(b) Iterative Least Squares 1
0.8
0.6
0.4
0.2
0
−0.2
−0.4
−0.6
−0.8
−1 −1
−0.8
−0.6
−0.4
−0.2
0
0.2
0.4
0.6
(c) RANSAC
Figure 5.9: The incorrect rejection that occurs with large θ rotations of the UAV. (a) shows the feature motion vectors from a θ rotation of 5o at an altitude of 50 m; (b) shows the group of features that are incorrectly selected by the iterative least squares method in the upper left quadrant of the image near the center of the rotation seen in Figure 5.7(b); and (c) shows the group of features selected by the RANSAC method, which performs better than the iterative least squares method, but still incorrectly rejects several features in the lower left hand corner.
62
Chapter 6 Video Display
User Target Tracking
Current Video Frame Previous Video Frame
Feature Selection
Features in Previous Frame
Feature Tracking
Feature Motion Vectors
Frame Motion Estimation
Frameto-Frame Motion Intended Motion Estimation
Video Display
Intended Motion
Target Location in Frame
Synchronized Telemetry
Estimate Target Location Target Location in World
Figure 6.1: Video display first estimates the intended video motion and then renders the stabilized video using the frame-to-frame motion and intended motion. The stabilized video display then allows the operator to identify a target to be localized by the localization process.
Displaying the video frames based on the estimated frame-to-frame motion is the final step of the stabilization process. The frame-to-frame motion consists of two components: intended video motion and unwanted jitter, which can be viewed as the low-frequency intended video motion and the high-frequency deviation from the intended motion. Ideally, only the high-frequency deviation from intended motion is used to display the stabilized video, so the intended video motion must be isolated and removed from the frame-to-frame motion. The motion used to display the video will create undefined regions in the display and the presence of undefined regions is worsened by error and lag in the estimation of intended video motion. The cost 63
functions presented by Chang, Lai, and Lu [8] solved the problems of error and lag associated with estimating intended video motion in an intuitive manner but require knowledge of the frame-to-frame motion of the entire video. However, during realtime stabilization, the frame-to-frame motion of the entire video is not available, so an online method of accurately estimating intended video motion with minimal lag is necessary. Beuhler, Bosse, and McMillian [12] demonstrated that intended video motion can be determined by estimating camera motion, but were only able to estimate the camera motion in the camera frame and were unable to handle complex or fast motion that is present in UAV video. Complex and fast motion could be handled by estimating camera motion in the world frame, but this requires knowledge of the scene and the current UAV state, which is unavailable during the stabilization process without excessive delays and would require complex, inaccurate filtering techniques in order to be properly used during stabilization. This thesis presents two novel solutions for the online estimation of intended video motion: (1) the PID camera and (2) the parabolic fit camera. Each of the four video motion parameters—scale, rotation, and x and y translation—are treated as an independent state, and the intended motion of each of these states is estimated and removed from the frame-to-frame motion to render a stabilized video with minimal undefined regions. 6.1
PID Camera The PID camera estimates intended video motion by treating the estimation
process as a control problem and applying the concepts of PID control. It treats the path of the video as the desired path and adjusts the intended camera motion based on the calculated effort from the PID controller. A momentum term is also applied to the effort to remove high-frequency motion. This method yields promising results, but the gains must be tuned to match the specific type of video being stabilized. A simple proportional controller could be used to avoid the overshoot and instability problems that are common with mistuned PID controllers, but this is simply a low-pass filter and results in large undefined regions. To solve this problem a set of gains could be gathered for each type of video experienced during standard UAV flight and then gain 64
scheduling could be performed using telemetry data or operator input. However, the PID camera depends on the quality of the gain tuning and gain scheduling and has the potential to make the video less watchable in non-ideal scenarios. Fortunately, all of these problems can be adequately addressed with the parabolic fit camera. 6.2
Parabolic Fit Camera The parabolic fit camera estimates intended video motion by adding a delay
to the display of received video frames. The added delay allows for the use of estimates of frame-to-frame motion that occur in the future—relative to the currently displayed frame—in conjunction with past estimates of frame-to-frame motion, when performing the parabolic fit. The value of the parabola at the point of the current frame is then used as the intended camera motion when displaying the video. This creates a filter that rejects the high-frequency content of the video movement, minimizes undefined regions, and runs in real-time. Figure 6.2 shows an example of a parabolic fit of data taken from stabilizing UAV video. The properties of the filter can be controlled by the size of the window and the position of the current frame in the window. The tuning of these parameters and their effects will be discussed later in this section, but at the cost of a slight increase in video display latency, the parabolic fit camera solves the problems apparent in the PID camera and is able to be performed online, unlike previous solutions. The parabolic fit is accomplished using the standard least squares method initialized in the follow manner,
x21
x1 1 2 x2 x2 1 , A= .. . 2 xn xn 1 h x=
iT a b c
65
,
(6.1)
(6.2)
−5
−10
Pixels
−15
−20
−25
−30
−35
110
120
130
140 Frame
150
160
Figure 6.2: The solid, green line shows the x position of the video motion. The dashed, blue line shows the parabolic fit of the data for frame 147. The red asterisk shows the estimate of the x position of the intended camera motion for frame 147.
and
h b=
iT y1 y2 · · ·
yn
,
(6.3)
where xi is the frame number and yi is the value of the state being estimated–scale, rotation, x translation, or y translation. This will result in a, b and c being the coefficients of the parabola, y = ax2 + bx + c,
(6.4)
that fits the motion of the video over a window of size N . Since this is an overdetermined system we can solve for x using the least squares solution, x = (AT A)−1 AT b.
66
(6.5)
For the parabolic case, we can solve for x analytically:
s s s 4 3 2 A A = s3 s2 s1 s2 s1 n T
(6.6)
where s4 = s3 = s2 =
N X
x4i ,
(6.7)
x3i ,
(6.8)
x2i ,
(6.9)
xi ,
(6.10)
1 = N.
(6.11)
i=1 N X i=1 N X i=1
s1 =
N X i=1
and n=
N X i=1
Inverting AT A yields (AT A)−1 = adj(AT A)/det(AT A) where
(6.12)
s2 n − s21
−s3 n + s2 s1
s3 s1 − s22
adj(A A) = −s3 n + s2 s1 s4 n − s22 −s4 s1 + s3 s2 s3 s1 − s22 −s4 s1 + s3 s2 s4 s2 − s23 T
(6.13)
and det(AT A) = s4 s2 n − s4 s21 − s23 n + 2s3 s2 s1 − s32 .
(6.14)
Before continuing with the remainder of the analytic derivation, an assumption can be made that simplifies the required calculations. The points xi are centered
67
about the current point of interest, xc , yielding x0i = xi − xc .
(6.15)
So we are actually solving the equation y(x) = a(x − xc )2 + b(x − xc ) + c,
(6.16)
which implies that the filtered camera position is simply the value c. This means that the filtered position can be retrieved from the inner product of the last row of (AT A)−1 AT and b. Also it is important to note that A is no longer dependent on the position of the window in the data set xi , and the estimation process can be viewed as the weighted sum of the data vector b or as a finite impulse response (FIR) filter. As previously stated the weights are the last row of the pseudo-inverse of A and are defined as h
i αx02 1
+
βx01
+γ
αx02 2
+
βx02
+ γ ···
αx02 n
+
βx0n
+γ
(6.17)
where s3 s1 − s22 , det(AT A)
(6.18)
−s4 s1 + s3 s2 det(AT A),
(6.19)
s4 s2 − s23 . det(AT A)
(6.20)
α= β= and γ=
However, a more intuitive definition is possible. If we instead define the window as a given number of points before the current point of interest, Nbefore , and a given number of points after the current point of interest, Nafter where Nbefore + Nafter + 1 = N , then the values of x0i will be defined by the set [Nbefore , Nafter ] for the estimate xc .
68
This means that s4 , s3 , s2 and s1 can be determined by q4 (n) = q3 (n) =
n X i=1 n X
x4i =
n(2n + 1)(n + 1)(3n2 + 3n − 1) , 30
(6.21)
x3i =
n2 (n + 1)2 , 4
(6.22)
x2i =
n(n + 1)(2n + 1) , 6
(6.23)
xi =
n(n + 1) , 2
(6.24)
i=1
q2 (n) = q1 (n) =
n X i=1 n X i=1
s4 = q4 (Nbefore ) + q4 (Nafter ),
(6.25)
s3 = q3 (Nbefore ) − q3 (Nafter ),
(6.26)
s2 = q2 (Nbefore ) + q2 (Nafter ),
(6.27)
s1 = q1 (Nbefore ) − q1 (Nafter ),
(6.28)
and the determinant of AT A can be redefined as (N + 2)(N − 2)(N + 1)2 (N − 1)2 (N )3 det(A A) = 2160 T
(6.29)
where N assumes the previously stated definition of N = Nbefore + Nafter + 1.
(6.30)
. These new definitions can be used to calculate the values of α, β, and γ from Equations 6.18, 6.19, and 6.20 and can then be used to derive a new set of weights
69
that depend only on Nbefore and Nafter , α(−Nbefore )2 + β(−Nbefore ) + γ
α(−Nbefore + 1)2 + β(−Nbefore + 1) + γ .. . α(Nafter − 1)2 + β(Nafter − 1) + γ α(Nafter )2 + β(Nafter ) + γ
T .
(6.31)
This creates a filter whose output does not lag the input, and that can be tuned in an intuitive manner using the parameters Nbefore and Nafter . The effects of the parameters Nbefore and Nafter on video display will be discussed in the next section. 6.3
Results The video display is the final step of the stabilization process, so the results
of the effectiveness of the PID camera and parabolic fit camera and the ability of techniques discussed in this and the previous three chapters to remove the unwanted jitter from UAV video will be examined. 6.3.1
Intended Video Motion As discussed earlier in this chapter, intended video motion must be estimated
and then removed from the frame-to-frame motion so that only unwanted jitter is removed during the stabilization process. Figure 6.3 shows how the methods of estimating intended video motion presented in this thesis perform on a segment of UAV video. The PID camera with only proportional control has acceptable high-frequency noise rejection properties shown in Figure 6.4, but also has a significant phase delay that results in the lag seen in Figure 6.3. The full PID camera does not suffer from the same problems with lag seen with the proportional only PID camera, but has a significant phase delay in the low-frequency range, shown in Figure 6.5, which results in large fluctuations in Figure 6.3. The parabolic fit camera has noise rejection properties similar to the proportional-only PID camera, but does not have the lag problems seen in the proportional controller because of the ideal high-frequency 70
rejection and phase delay properties shown in Figure 6.6. This makes the parabolic fit camera our choice for estimating intended video motion.
−500
−510
−520
y translation in Pixels
−530
−540
−550
−560
−570
−580
−590
−600 480
500
520
540 Frames
560
580
600
Figure 6.3: The solid red line shows the y translation of a segment of UAV video, the dash-dotted blue line shows the estimated intended video motion from the proportional only PID camera, the dotted black line shows the estimated intended video motion from the full PID camera, and the dashed green line shows the estimate intended video motion from the parabolic fit camera.
The parabolic fit camera solves the problems with lag and high-frequency noise rejection seen in the PID camera without requiring specific tuning for the type of video being stabilized, but it does require tuning of the Nbefore and Nafter parameters described in Section 6.2 to achieve optimal results. As was previously shown through the derivation of Equation 6.17, the parabolic fit camera can be viewed as an FIR filter
71
Bode Diagram of Low Pass Filter Camera
0
Magnitude (abs)
10
−1
10
−2
10
−4
10
−3
10
−2
10
−1
10
0
10
1
10
2
10
150
Phase (deg)
100 50 0 −50 −100 −150 −4
10
−3
10
−2
−1
10 10 Frequency (rad/sec)
0
10
1
10
2
10
Figure 6.4: Bode plot of the proportional only PID camera, which shows the pass band ending at 0.82 rad/sec and the stop band beginning 18.0 rad/sec, and phase delay of at least 15o occurring between 0.46 and 82.0 rad/sec.
and existing filter analysis techniques can be applied. The bode plot of the resulting filter can be used to analyze the frequency rejection properties of the parabolic fit camera and the phase delay is 0 in all cases. Figure 6.7 shows the average energy between 1 and 100 rad/sec of the parabolic fit camera with the given values of Nbefore and Nafter . The goal is to find the set of Nbefore and Nafter to minimize the energy in the specified frequency range to receive the best high-frequency noise rejection properties. Analysis of the data in Figure 6.7 shows that for a specified Nbefore there is a Nafter that minimizes the energy in the specified frequency range. Therefore, the parameters Nbefore and Nafter can be selected by determining the number of frames to be used in the parabolic fit before the currently displayed frame, Nbefore , which is 72
Bode Diagram of PID Camera
0
Magnitude (abs)
10
−1
10
−2
10
−4
10
−3
−2
10
10
−1
10
0
10
1
10
2
10
150
Phase (deg)
100 50 0 −50 −100 −150 −4
10
−3
10
−2
−1
10 10 Frequency (rad/sec)
0
10
1
10
2
10
Figure 6.5: Bode plot of the full PID camera, which shows the pass band ending at 0.00047 rad/sec and the stop band beginning 0.024 rad/sec, and phase delay of at least 15o occurring between 0.0003 and 0.039 rad/sec.
the resulting delay in displaying the video, and then selecting the appropriate value of Nafter . 6.3.2
Unwanted Jitter Removal The removal of unwanted jitter is the final goal of the stabilization process,
but due to the lack of truth data to verify the accuracy of the various methods, a metric must be created. The metric most closely related to the visual appearance of the stabilized video is the mean movement per feature per frame (MMPFPF) of features that are tracked in successive frames. This metric quantifies the movement of features that are continuously visible to the user and accurately represents the 73
Bode Diagram of Parabolic Fit Camera
0
Magnitude (abs)
10
−1
10
−2
10
−4
10
−3
10
−2
10
−1
10
0
10
1
10
2
10
150
Phase (deg)
100 50 0 −50 −100 −150 −4
10
−3
10
−2
−1
10 10 Frequency (rad/sec)
0
10
1
10
2
10
Figure 6.6: Bode plot of the parabolic fit camera, which shows the pass band ending at 2.25 rad/sec and the stop band beginning 19.3 rad/sec, and phase delay of at least 15o occurring at 0.21 rad/sec and beyond.
motion seen by the user. Both the translational and affine models, along with the effects of applying iterative least squares and RANSAC noise rejection methods, will now be examined. Figure 6.8 shows the MMPFPF and Table 6.1 shows the statistics of the MMPFPF before stabilization and after stabilization when the translational model discussed in Section 5.2 and associated noise rejection methods discussed in Section 5.2.1 and Section 5.2.2 are used to estimate frame-to-frame motion. Figure 6.8(a) shows a marked reduction in the visible motion of the video, but, as described in Section 5.2, the translational model is not fully capable of representing the motion seen in UAV video. As seen in Figure 5.3, the iterative least squares method with the trans74
1
Average energy between 1 and 100 rad/sec
0.9
0.8
0.7
0.6
0.5
0.4
0.3
0.2 0
10
20
30
40
50
60
10
8
4
6
2
0
Nbefore
Nafter
Figure 6.7: The average energy between 1 and 100 rad/sec of the parabolic fit camera with the given values of Nbefore and Nafter .
lational model selects the middle of the region and has no significant effect on the estimated frame-to-frame motion. Figure 6.8(e) shows the MMPFPF when RANSAC is used with the translational model. As shown in Figure 5.4, the RANSAC method improperly selects a group of feature motion vectors with high correlation and negatively effects the frame-to-frame-motion estimate and results in less jitter removal than when the standard translational model is used with no noise rejection. The standard affine model is capable of representing motion in UAV video that is not possible with the translational model. Figure 6.8(b) shows the MMPFPF for a sequence of UAV video and Table 6.2 shows the statistics of the MMPFPF when the affine model discussed in Section 5.4 is used with the noise rejection methods discussed in Section 5.4.2 and Section 5.4.3 are used. Figure 6.8(b) shows better jit75
10
10
Pixels
15
Pixels
15
5
0 400
5
410
420
430
440
450 Frames
460
470
480
490
0 400
500
410
420
(a) Translational Model
430
440
450 Frames
460
470
480
490
500
480
490
500
(b) Affine Model
10
10
Pixels
15
Pixels
15
5
0 400
5
410
420
430
440
450 Frames
460
470
480
490
0 400
500
(c) Translational Model with Iterative Least Squares
410
420
430
440
450 Frames
460
470
(d) Affine Model with Iterative Least Squares
10
10
Pixels
15
Pixels
15
5
0 400
5
410
420
430
440
450 Frames
460
470
480
490
0 400
500
(e) Translational Model with RANSAC
410
420
430
440
450 Frames
460
470
480
490
500
(f) Affine Model with RANSAC
Figure 6.8: The dashed red line is the mean movement per feature per frame before stabilization and the solid blue line is the mean movement per features per frame after stabilization using the specified motion model. All frame-to-frame motion estimates are calculated using the same feature motion vectors and therefore share the same mean movement per feature per frame before stabilization.
76
Table 6.1: The mean and standard deviation of the mean movement per feature per frame (MMPFPF) of the results shown in Figure 6.8 when the translational model is used.
Method No Stabilization Translational Model Translational Model with ILS Translational Model with RANSAC
µ of MMPFPF 6.66 2.56 2.51 2.62
σ of MMPFPF 2.49 0.58 0.57 0.91
ter removal than all of the methods based on the translational mode. Figure 6.8(d) shows the MMPFPF when iterative least squares is applied to the affine model and further improves the jitter removal properties. The use of iterative least squares results in an almost 10% improvement over the jitter removal when the standard affine model is used and does not result the improper biasing that can occur when a noise rejection technique is used with the translational model. Figure 6.8(f) shows the results achieved when the RANSAC method is applied with the affine model, which also improves on the standard affine model. From the properties of iterative least squares and RANSAC discussed in Section 5.3, it would seem that RANSAC should significantly outperform iterative least squares during the frame motion estimation process, but the large number of tracked features and relatively low percentage of outliers results in equivalent results from the RANSAC and iterative least squares methods with the affine model. These results combined with the lower lower computational cost of less than 1 millisecond for the affine model with iterative least squares noise rejection, compared to 4 milliseconds for the affine model with RANSAC noise rejection, make the affine model with iterative least squares our choice for use in stabilization of UAV video. However, it should be noted that in cases where the optical flow feature tracking method is used, the benefits of the correlation based noise rejection of the RANSAC method would outweigh the added computational cost, because of the tendency of the optical flow feature tracking method to generate invalid feature motion vectors in areas of the image with high noise levels.
77
Table 6.2: The mean and standard deviation of the mean movement per feature per frame (MMPFPF) of the results shown in Figure 6.8 when the affine model is used.
Method No Stabilization Affine Model Affine Model with Iterative Least Squares Affine Model with RANSAC
78
µ of MMPFPF 6.66 1.97 1.81 1.82
σ of MMPFPF 2.49 0.5 0.42 0.41
Chapter 7 Target Localization
User Target Tracking
Current Video Frame Previous Video Frame
Feature Selection
Features in Previous Frame
Feature Tracking
Feature Motion Vectors
Frame Motion Estimation
Frameto-Frame Motion Intended Motion Estimation
Video Display
Intended Motion
Target Location in Frame
Synchronized Telemetry
Estimate Target Location Target Location in World
Figure 7.1: Localization is performed using the input received from operator interaction with the stabilized video, which must be transformed from screen coordinates to image coordinates. Each image coordinate is then transformed into a ray in world coordinates on which the identified target lies. A series of these rays is then used to estimate the location of the target in world coordinates.
The work of Ratches, Walters, Buser, and Guenther [23] has shown that completely autonomous target recognition is not possible in the foreseeable future. However, stabilized video allows the operator to more easily identify objects. Using the operator input and telemetry data, the ground station software performs the necessary transformations to generate a ray on which the target lies and estimates the world location of the target using a series of these rays. This chapter presents three methods of operator interaction and discusses the necessary transformations to convert from screen coordinates to an estimate of GPS location. 79
7.1
Operator Input Three methods of operator input are explored in this section: (1) hold and
follow, (2) selection area, and (3) click-to-follow. 7.1.1
Hold and Follow The hold and follow method involves the operator continually identifying the
target by holding the mouse button down while following the target in the video. The operator is continuously making adjustments to compensate for the movement of the object that does not match the movement of the frame. Due to the continuous use of the human visual system, this method is the most accurate, but requires the most operator involvement and demands all of the operator’s attention. 7.1.2
Selection Area The selection area method involves the operator selecting a box that encloses
the target. This method allows for the use of the feature motion vectors in the selected area in order to achieve an accurate estimate of target motion. Unfortunately, this method requires the operator to perform a target identification process that is typically both difficult and frustrating. Also, methods for the user to account for error in the tracking or change in size and orientation of the target are complicated and un-intuitive at best. This method does allow for the use of iterative least squares or RANSAC to achieve a more accurate estimate of the target’s motion, but the challenges associated with operator interaction outweigh the added benefits. 7.1.3
Click-to-Follow The click-to-follow method requires the operator to click on the target and
then the estimated video motion is used to follow the target on the screen. The standard version of the click-to-follow method assumes that the motion of the object will match that of the frame. Unfortunately, this assumption is not always true. To account for drift in the tracking, the operator can re-click on the target to adjust the estimate. This method can be enhanced through the use of feature motion vectors 80
near the identified target by assuming that the feature motion vectors in the area close to the target will be predominantly translational motion. This assumption holds true more often than the assumption of the first case and the estimate can be further enhanced using the RANSAC rejection method previously discussed in Section 5.2.2. The resulting motion estimate is not as accurate as the motion estimate that could be possible with a functional version of the selection area method, but the simpler identification process and decrease in demand on the user’s attention outweighs the small decrease in tracking accuracy. The effectiveness of all three methods of operator interaction will be examined in Section 7.5. 7.2
Screen to Image Transformation In order to estimate the GPS location of the identified target, the received
operator input must be converted from screen coordinates to image coordinates. The initial transformation from screen coordinates to image coordinates is done by the video handling pipeline and is defined by TsI as
s 0 0 s 0 tx s 0 sR tx R I I I Ts = 0 sR 0 0 sI ty = 0 sI sR ty , 0 0 1 0 0 1 0 0 1
(7.1)
where sR is the scale factor between the screen size in pixels and the size of the rendering context, sI is the scale factor between the rendering context and the rendered image size and tx and ty are the position of the image in the rendering context. The screen, rendering context, and image are all referenced from the upper left-hand corner and so no transformation of the axes is necessary. The resulting coordinates must be transformed to compensate for the stabilization. This is done by finding the transformation between intended video motion and the frame-to-frame motion. As discussed in Chapter 5, both of these motions are two-dimensional transformations involving scaling, rotation, and x and y translation. The transformation between the
81
intended video motion, TI , and the measured video motion, TM , can be found by TIM = TM TI −1 .
(7.2)
This can be shown by assuming that xI = T I x
(7.3)
xM = TM x.
(7.4)
and
The necessary operations are then performed on Equation 7.3 x = TI −1 xI ,
(7.5)
to substitute x into Equation 7.4 so that xM can be defined as xM = TM TI −1 xI .
(7.6)
Therefore, TM TI −1 transforms points from TI to TM and since TI is removed from TM during the display process, TI can be treated as the origin and TIM is the transformation used to map the received operator input from the image coordinate frame to the stabilized coordinate frame. After this transformation the operator input can be used to find the ray in world coordinates on which the target lies. 7.3
Image to World Ray Transformation The transformations used to generate a world ray from the operator input
image coordinates are based on the transformations derived in [24]. The ray consists of two components: (1) the origin of the ray and (2) the vector defining the direction of the ray. The origin is the current location of the camera in the world, which is found using four transformations: (1) inertial frame to vehicle frame, TIv , (2) vehicle
82
frame to body frame, Tvb , (3) body frame to gimbal frame, Tbg , and (4) gimbal frame to camera frame Tgc . The definitions of these rotations will now be given. The first rotation is from inertial to vehicle frame and is defined as
1 0 0 1 TIv = 0 0 0 0
0
xUAV
yUAV , 1 −zUAV 0 1 0
(7.7)
where xU AV is the north component of UAV GPS location, yU AV is the east component of UAV GPS location, and zU AV is the altitude component of the UAV GPS location. The rotations between vehicle and body frame must then be performed and are defined as Tvb = Rφ Rθ Rψ , where
(7.8)
1
0
0
0
0 cos φ sin φ 0 Rφ = 0 − sin φ cos φ 0 0 0 0 1
,
(7.9)
cos θ 0 − sin θ 0
0 1 Rθ sin θ 0 0 0
0 cos θ 0
0 , 0 1
(7.10)
cos ψ sin ψ 0 0 − sin ψ cos ψ 0 0 Rψ = 0 0 1 0 0 0 0 1
83
,
(7.11)
and φ, θ, and ψ are the roll, pitch and yaw of the UAV. The transformation from body to gimbal frame must then be performed and is defined as Tbg = Rθ,gim Rψ,gim T rgb , where
(7.12)
cos θgim 0 Rθ,gim sin θgim 0
0 − sin θgim 0 1
0
0
cos θgim
0
0
0 , 0 1
cos ψgim
Rψ,gim
(7.13)
sin ψgim 0 0
− sin ψgim cos ψgim 0 0 , = 0 0 1 0 0 0 0 1
(7.14)
1 0 0 xgim
0 1 0 ygim g T rb = 0 0 1 zgim 0 0 0 1
,
(7.15)
and θgim is the pitch of the gimbal relative to the body frame, ψgim is the yaw of the gimbal relative to the camera frame, and xgim , ygim , and zgim are the offset of the gimbal from the center of mass of the UAV. The offset of the camera in the gimbal must also be accounted for and is defined as
0 0 −1 xcam 0 1 0 ycam Tgc = 1 0 0 zcam 0 0 0 1
,
(7.16)
where xcam , ycam , and zcam are the offset of the camera from the center of mass of the gimbal. Tgc also flips the x and z axis to allow for the more intuitive definition 84
of x and y being the coordinates of the image and z being the depth into the image. The translational component of the resulting transformation matrix is the current location of the camera in the world and can be easily extracted for use as the origin of the ray during localization. Obtaining the direction of the ray requires knowledge of the camera being used to capture the video. The Camera Calibration Toolbox [35] allows for obtaining the values needed to estimate the ray direction. The camera calibration matrix is defined as
0
−fy C= 0 0
fx ox 0 0
oy
0
1
0
0
0 , 0 1
(7.17)
where fx and fy are the focal length of the camera and ox and oy are the optical center of the camera in pixels. More complicated camera calibration matrices can be used to account for skewing and tangential distortions, but these effects are negligible and can be ignored if a narrow angle lens is used. The direction of the ray can now be defined as Vray = Tcv Cu
(7.18)
Tcv = (Tvb Tbg Tgc )−1 ,
(7.19)
where h u=
iT ux u y 1 1
,
(7.20)
and ux and uy are the image coordinates of the operator input. This results in a ray in world coordinates on which the target lies. A series of these rays can now be used to estimate the GPS location of the target. 7.4
World Position from World Rays Estimating three-dimensional locations from a single two-dimensional image
is impossible without previous knowledge of the scene. However, a series of the rays extracted during the previous step can be used to estimate the three-dimensional 85
position of the target. A least squares solution could be used to estimate the threedimensional location from the rays, but the significant error in the altitude estimate of current state estimation techniques employed on the UAV makes this solution impractical. Instead the individual rays are intersected with terrain data of the area, or with the altitude of the ground station if no terrain data is available, and the individual estimates are averaged to determine the GPS location of the target. This method has been shown to yield accurate results [24] and future improvements to altitude estimation could further improve these results by allowing for the use of more sophisticated filtering techniques. 7.5
Results The benefits of synchronization were shown in Section 2.4 and the effectiveness
of the presented localization techniques have been thoroughly covered in [24], so this section will discuss the effectiveness of the hold and follow and click-to-follow target identification and tracking methods. For the analysis, truth data is generated by manual identification of a target in a UAV video and then the estimated position of the target using each of the presented techniques is shown. 7.5.1
Hold and Follow The hold and follow tracking method has the advantage of the feedback of the
human visual system, but this advantage places an added burden on the operator. This tracking method requires the operator’s full attention throughout the entire localization process, as can be seen in Figure 7.2. Tracking small objects, like the one used in Figure 7.2, can be very difficult to correctly follow through the video and this results in the largest mean error of the three tracking methods. This method is best suited for tracking large targets, and is the ideal technique for use during target prosecution missions when few features are available near the center of the feature or when the motion of the target does not match the motion of the video.
86
600
500
Pixels
400
300
200
100
0
50
100
150
200 Frames
250
300
350
300
350
(a) x Component of Target Location
450
400
350
Pixels
300
250
200
150
100
50
0
50
100
150
200 Frames
250
(b) y Component of Target Location
Figure 7.2: The solid red line is the manual identified location of the target in the UAV video and the dashed blue line is the location of the target identified by the operator in real-time. The green bar at the base of the figure shows when there was user interaction. The mean error of the hold and follow target identification method with this video is (7.78, 10.3).
87
7.5.2
Click-to-Follow The first version of the click-to-follow tracking method relies on the initial
identification of the object by the operator which is then updated using the estimate of the frame-to-frame motion. The user can then account for drift in the tracking by re-clicking on the target in the image. Figure 7.3 shows the tracking achieved by the click-to-follow tracking method, and shows a marked improvement in mean error and dramatic reduction in required operator interaction compared to the hold and follow tracking method. The click-to-follow tracking method works well for stopped and slow moving targets, but fails to properly handle moving targets that are traveling at a high velocity. 7.5.3
Click-to-Follow with Feature Movement The second version of the click-to-follow method is designed to allow for track-
ing of moving targets that are traveling at a high velocity and reduce the tracking errors caused by drift. Rather than rely on the frame-to-frame motion, the second version of the click-to-follow method uses the feature motion vectors near the identified target to update the location of the target in the image. This reduces the drift caused by the errors introduced from estimating the video motion using an affine model. Since the exact size and shape of the target is not known, an arbitrary rectangle is used to select the features used in the estimate. This means that a valid motion cannot be determined from the feature motion vectors and the frame-to-frame motion must be used. Figure 7.4 shows the improved tracking achieved by the click-to-follow with feature movement tracking method. It should be noted that the increase in tracking comes at the cost of a slight increase in required operator interaction and in many cases yields identical results to the standard click-to-follow tracking method.
88
600
500
Pixels
400
300
200
100
0
50
100
150
200 Frames
250
300
350
300
350
(a) x Component of Target Location
450
400
350
Pixels
300
250
200
150
100
50
0
50
100
150
200 Frames
250
(b) y Component of Target Location
Figure 7.3: The solid red line is the manual identified location of the target in the UAV video and the dashed blue line is the location of the target identified by the operator in real-time using the click-to-follow target identification method. The green bar at the base of the figure shows when there was user interaction. The mean error of the click-to-follow target identification method with this video is (5.66, 3.97).
89
600
500
Pixels
400
300
200
100
0
50
100
150
200 Frames
250
300
350
300
350
(a) x Component of Target Location
450
400
350
Pixels
300
250
200
150
100
50
0
50
100
150
200 Frames
250
(b) y Component of Target Location
Figure 7.4: The solid red line is the manual identified location of the target in the UAV video and the dashed blue line is the location of the target identified by the operator in real-time using the click-to-follow with feature movement target identification method. The green bar at the base of the figure shows when there was user interaction. The mean error of the click-to-follow with feature movement target identification method with this video is (4.22, 4.47).
90
Chapter 8 Conclusions and Future Work 8.1
Conclusions The first contribution of this thesis is a development platform that is well suited
to expanding the uses of UAV technology while making use of multi-core and simultaneous multi-threading architectures to enable real-time processing of UAV video. This thesis also outlines two new methods for estimating intended video motion in real-time and demonstrates their effectiveness in stabilizing UAV video. Enhancements to existing feature tracking techniques were developed to allow for the use of these techniques during the stabilization of UAV video. Additional methods for handling noise throughout the stabilization process were also introduced. All of these enhancements have been shown to enable the stabilization of UAV video in real-time on a mobile ground station. The resulting stabilization enables the extension of previous localization work [24] and allows the user to identify targets in the video until automatic target recognition techniques become more mature. In addition, the novel Hold-and-Follow object tracking method allows for high-level control of the UAV based on the feedback of the human visual system. However, the most important contribution of this thesis is the demonstration that small UAVs are capable of handling complex, real-time computer vision tasks and that the small UAV platform can meet the needs of surveillance and reconnaissance teams in both capability and mobility. 8.2
Future Work The development platform presented in this thesis enables the development
and application of a wide array of computer vision techniques with a small UAV 91
platform. These applications include vision based attitude estimation and vision based obstacle avoidance, to name only two of the many possibilities. Also, the feature tracking presented in this thesis could be used as an advanced optical flow sensor to enhance existing attitude estimation techniques and could be used to estimate the world position of obstacles in the video through the integrated use of feature tracking and telemetry data. As with the work of Cardoze, Collins, and Arkin [11] and Matsushita, Ofek, Tang, and Shum [16], the stabilization could be used to detect moving targets in the video. The application of RANSAC rejection techniques presented in this thesis could be further extended to extract the feature motion vectors associated with the moving objects in the video in order to perform video stabilization and object tracking, further reducing the reliance on human input. Active contours [36] and CONDENSATION [37] present the possibility of improving the target tracking performed in this thesis, but requires an initially identified model that is difficult for the operator to create using a real-time video stream. The use of a full three-dimensional motion model could more accurately describe the motion seen in UAV video, but requires a paradigm in the display of UAV video that does not rely on the two-dimensional mosaicing that has been used by this thesis and all previous work. Estimating video motion using a full three-dimensional model is inhibited by the estimation lag in existing intended motion estimation techniques. The properties of the presented parabolic fit camera present the possibility of greatly simplifying the display of video using a three-dimensional model and removes the problems associated with the lag introduced by other estimation techniques. Integration of telemetry data into the process of estimating intended video motion would improve the accuracy of the estimation of intended video motion and would also allow for reliable estimation of three-dimensional intended video motion with Euclidean distance, but would require a filtering technique to account for the transmission delay and to estimate the UAV’s position between received telemetry samples. Kalman filtering techniques are capable of solving the delay and interpolation problems asso-
92
ciated with telemetry data, and present the possibility of significant enhancement to the estimation of intended video motion.
93
94
Bibliography [1] D. M. Gaskill, “Techniques for synchronizing thermal array chart recorders to video,” in International Telemetering Conference, vol. 28, Astro-Med, Inc. San Diego, CA: International Foundation for Telemetering, October 1992, pp. 61–64. 4 [2] S. Zeng, J. R. Powers, and H. Hsiao, “A new video-synchronized multichannel biomedical data acquisition system,” in IEEE Transactions on Biomedical Engineering, vol. 47, no. 3, Gainesville, FL, March 2000, pp. 412–419. 4 [3] D. P. Anderson and B. W. Stump, “Synchronization of video with seismic and acoustic data using gps time signals,” Internet, 2003. [Online]. Available: http://www.geology.smu.edu/∼dpa-www/gps video/index.html 4, 5 [4] J. L. Rieger, “Encoding of telemetry data in a standard video channel,” in International Telemetering Conference, Instrument Society of America. Los Angeles, CA: International Foundation for Telemetering, October 1977, pp. 151–155. 5 [5] J.-G. Zhang, “Using advanced optical multiple-access techniques in high-speed avionic local area networks for future aircraft applications. Part II: Optical timedivision multiple-access networks,” in Instrument Society of America Transactions, vol. 36, no. 4, Asian Institute of Technology. Instrument Society of America, 1997, pp. 321–338. 5 [6] J. Walrod, “Using the asynchronous transfer mode in Navy communications,” in Sea Technology, vol. 38, no. 5. Compass Publications Inc, May 1997, p. 6. 5 [7] K. Ratakonda, “Real-time digital video stabilization for multi-media applications,” in ISCAS ’98: Proceedings of the 1998 IEEE International Symposium on Circuits and Systems, vol. 4, IEEE. Monterey, CA, USA: IEEE, May 1998, pp. 69–72. 7, 39 [8] H.-C. Chang, S.-H. Lai, and K.-R. Lu, “A robust and efficient video stabilziation algorithm,” in ICME ’04: International Conference on Multitmedia and Expo, 2004, vol. 1, IEEE. IEEE, June 2004, pp. 29–32. 7, 30, 40, 49, 64 [9] G. V. der Wal, M. Hansen, and M. Piacentino, “The arcadia vision processor,” in CAMP ’00: Proceedings of the Fifth IEEE International Workshop on Computer Architectures for Machine Perception. Washington, DC, USA: IEEE Computer Society, 2000. 7
95
[10] S. Darmanjian, A. A. Arroyo, and E. M. Schwartz, “An alternative real-time image processing tool,” in Florida Conference on Recent Advances in Robotics, 2003. 8 [11] D. E. Cardoze, T. R. Collins, and R. C. Arkin, “Visual tracking technologies for an autonomous rotorcraft,” Image and Vision Computing Journal, 2005. 8, 10, 92 [12] C. Buehler, M. Bosse, and L. McMillian, “Non-metric image-based rendering for video stabilization,” in CVPR 2001: Computer Vision and Pattern Recognition, 2001, vol. 2, 2001, pp. 609–614. 8, 64 [13] J. S. Jin, Z. Zhu, and G. Xu, “Digital video sequence stabilization based on 2.5D motion estimation and inertial motion filtering,” Real-Time Imaging, vol. 7, no. 4, pp. 357–365, August 2001. 8 [14] Z. Duric and A. Rosenfeld, “Shooting a smooth video with a shaky camera,” Machine Vision and Applications, vol. 13, no. 5-6, pp. 303–313, 2002. 9 [15] A. Litvin, J. Konrad, and W. C. Karl, “Probabilistic video stabilization using Kalman filtering and mosaicking,” in IS&T/SPIE Symposium on Electronic Imaging, Image and Video Communications and Proc., IS&T/SPIE. Santa Clara, CA, USA: IS&T/SPIE, January 2003. 9 [16] Y. Matsushita, E. Ofek, X. Tang, and H.-Y. Shum, “Full-frame video stabilization,” in CVPR ’05: Proceedings of the 2005 IEEE Computer Society Conference on Computer Vision and Pattern Recognition (CVPR’05) - Volume 1. Washington, DC, USA: IEEE Computer Society, 2005, pp. 50–57. 9, 92 [17] A. Mahalanobis, B. V. K. V. Kumar, and S. R. F. Sims, “Distance-classifier correlation filters for multiclass target recognition,” in Optical Society of America, vol. 35, no. 17, June 1996, pp. 3127–3133. 10 [18] J. Villasenor, B. Schoner, K.-N. Chia, C. Zapata, H. J. Kim, C. Jones, S. Lansing, and B. Mangione-Smith, “Configurable computing solutions for automatic target recognition,” in Proceedings of the IEEE Symposium of FPGAs for Custom Computing Machines. Napa, CA, USA: Electrical Engineering Department, University of California, Los Angeles, April 1996, pp. 70–79. 10 [19] C. F. Olson and D. P. Huttenlocher, “Automatic target recognition by matching oriented edge pixels,” in IEEE Transactions on Image Processing, vol. 6, no. 1. Department of Computer Science, Cornell University, Ithaca, NY, January 1997, pp. 103–113. 10 [20] A. J. Lipton, H. Fujiyoshi, and R. S. Patil, “Moving target classification and tracking from real-time video,” in WACV ’98: Workshop on Applications of Computer Vision, 1998. Washington, DC, USA: IEEE Computer Society, October 1998, pp. 8–14. 10 96
[21] Y. Won, P. D. Gader, and P. C. Coffield, “Morphological shared-weight networks with applications to automatic target recognition,” in IEEE Transactions of Neural Networks, vol. 8, no. 5. Department of Computer Engineering & Computer Science, Missouri University, Columbia, MO, September 1997, pp. 1195–1203. 10 [22] M. W. Roth, “Survey of neural network technology for automatic target recognition,” in IEEE Transactions on Neural Networks, vol. 1, no. 1, Applied Physics Lab of Johns Hopkins University. IEEE Computational Intelligence Society, March 1990, pp. 28–43. 10 [23] J. A. Ratches, C. P. Walters, R. G. Buser, and B. D. Guenther, “Aided and automatic target recognition based upon sensory inputs from image forming systems,” IEEE Transactions on Pattern Analysis and Machine Intelligence, vol. 19, no. 9, pp. 1004–1019, September 1997. 10, 79 [24] J. Redding, “Vision-based target localization from a small fixed-wing unmanned air vehicle,” Master’s thesis, Brigham Young University, August 2005. 10, 19, 22, 82, 86, 91 [25] K. R. Castleman, Digital Image Processing. Prentice Hall Press, 1996. 28
Upper Saddle River, NJ, USA:
[26] J. Canny, “A computational approach to edge detection,” IEEE Transactions on Pattern Analysis and Machine Intelligence, vol. 8, no. 6, pp. 679–698, November 1986. 29 [27] W. F¨orstner, “A framework for low level feature extraction,” in ECCV ’94: Proceedings of the third European conference on Computer Vision (Vol. II). Secaucus, NJ, USA: Springer-Verlag New York, Inc., 1994, pp. 383–394. 29 [28] C. G. Harris and M. Stephens, “A combined corner and edge detector,” in 4th Alvey Vision Conference, 1988, pp. 147–151. 29 [29] P. Saeedi, P. D. Lawrence, and D. G. Lowe, “Vision-based 3D trajectory tracking for unknown environments,” in IEEE Transactions on Robotics and Automation, February 2006, vol. 22, no. 1. IEEE, February 2006, pp. 119–136. 29 [30] B. K. P. Horn and B. G. Schunck, “Determining optical flow,” Massachusetts Institute of Technology, Cambridge, MA, USA, Tech. Rep., 1980. 40 [31] B. D. Lucas and T. Kanade, “An iterative image registration technique with an application to stereo vision,” in Proceedings of the 1981 DARPA Image Understanding Workshop, April 1981, pp. 121–130. 40 [32] J.-Y. Bouguet, “Pyramidal implementation of the Lucas Kanade feature tracker,” 2000. 40
97
[33] ˚ A. Bj¨orck, Numerical Methods for Least Squares Problems. SIAM, 1996. 49
Philadelphia, PA:
[34] M. A. Fischler and R. C. Bolles, “Random sample consensus: A paradigm for model fitting with applications to image analysis and automated cartography,” Communications of the ACM, vol. 24, no. 6, pp. 381–395, June 1981. 50 [35] J.-Y. Bouguet, “Camera Calibration Toolbox for MATLAB,” 2004. 85 [36] M. Kass, A. Witkin, and D. Terzopoulos, “Snakes: Active countor models,” International Journal of Computer Vision, vol. 1, no. 4, pp. 321–331, January 1988. 92 [37] M. Isard and A. Blake, “Condensation-conditional density propagation for visual tracking,” International Journal of Computer Vision, vol. 29, no. 1, pp. 5–28, August 1998. 92
98