Video Summarization using a Neurodynamical Model of Visual Attention Silvia Corchs, Gianluigi Ciocca, Raimondo Schettini Dipartimento di Informatica, Sistemistica e Comunicazione Universit´a degli studi di Milano-Bicocca, 20126 Milano, Italy Email: [corchs,ciocca,schettini]@disco.unimib.it and
Gustavo Deco
Department of Technology Universitat Pompeu Fabra, 08003 Barcelona, Spain Email:
[email protected]
Abstract— We propose a new approach to select the representative frames for video summarization. The representative frames are selected based on the results of the analysis of the events depicted in the shot in terms of Regions of Interest (ROIs). These ROIs are obtained from a biologically based computational model of visual attention. To select the video frames, that will be part of the final visual summary, we exploit an adaptive temporal sampling method that analyzes the visual feature distribution of the ROIs. Preliminary results are presented and discussed.
I. I NTRODUCTION
A
UTOMATIC video data analysis and indexing is a complex process that involves different tasks and can be outlined as follows [1]: defining a representation for the visual content of the video; segmentation of the video in elementary units (shots); summarization of the video (creation of visual summaries); identification of the overall video structure; definition of an indexing scheme to allow efficient access and retrieval. We will focus our attention to the visual summary creation task using still images. If we can summarize (abstracting) the visual content of the video sequences with still images that are representative of the video contents we can apply the same retrieval strategies developed for image retrieval to retrieve video sequences. The still images representing the contents of the video are called key-frames. The frames that compose a shot are highly correlated since they are taken over a short period of time, so that we need to extract only the frames that can summarize the overall shot visual contents and discard at the same time the redundant information. Different methods can be used for selecting the representative frames: one possible approach is to time sampling the shots using a suitable interval of time; another possible approach is to compact the entire shot into a small number of frames averaging group of consecutive frames or choosing frames at a predefined position within the shot [2], [3]. All these approaches have the drawbacks that the number of representative frames is somehow predefined a priori over the length of the video shots and it is not guarantee that the frames selected are not highly correlated. It is also difficult
to choose a suitable interval of time or frames to use: large intervals lead to a large amount of frames chosen; instead small intervals may not capture enough representative frames (or not in the right places) to describe completely the contents of the shot. Other approaches try to overcome these problems by dynamically select the representative frames by analyzing the evolving differences between consecutive frames in a shot in terms of color histogram or other visual descriptions. In [4] the authors propose an adaptive temporal sampling method to select the key frames based on the accumulated frame differences curve. In [5] a similar method based on the accumulated frame differences values is presented: the accumulated curve is approximated with a number of flexible rectangles and each one of them is used to select a key frame within the frame sequence. Both these approaches dynamically choose the position of the key frames to be extracted from the video, they use color histograms as frame representation and require that the number of key frames should be provided in advance. We propose here an alternative approach to select the representative frames for video summarization. The representative frames are dynamically selected using the algorithm in [4] but, instead of using only the color histograms to construct the accumulated curve, we computed several visual features and their corresponding differences on the frame’s Regions-of-Interest (ROIs). These ROIs are obtained from a biologically based computational model of visual attention and should provide a more insightful information on the frame content. Once the ROIs are determined from each frame belonging to the video shot, we apply the adaptive temporal sampling algorithm to select the frames that will be part of the final visual summary. For evaluation purpose we compare the results of the algorithm that utilizes the ROIs with the results of the same algorithm that does not use the ROIs. II. T HEORETICAL M ODELS OF V ISUAL ATTENTION In the last decades, several computational attentional methodologies have been studied and they have become a powerful tool in vision systems. Computational neuroscience provides a mathematical framework for studying the mechanisms
involved in brain function, like visual attentional mechanisms, that is our present interest and matter of active research. It is well known that only part of the visual information of a given scene is processed in full detail while the remainder is left relatively unprocessed. Therefore, visual attention facilitates the processing of that limited portion of the input associated with the relevant information and it suppress the remaining information. Eye movements are an essential part of human vision because they must carry the fovea and, consequently, the visual attention to each part of an image to be fixated upon and processed with high resolution. Only a small set of eye fixations, ROI, are usually required by the brain to recognize a complex visual input. In the literature there exist different image processing algorithms intended to detect and localize specific features in a digital image. Itti and Koch [6] use a visual attention system based on saliency maps to predict visually salient features of a scene. In their model, the input image is progressively low-pass filtered and subsampled to different spatial scales. The multiscale image representation is then decomposed into a set of topographic feature maps. All feature maps feed in a bottom-up manner into a single topographical saliency map. The saliency maps of [6] have been used in [7], where the authors defined a novel approach to partitioning of a video into shots based on a foveated representation of the video. Privitera and Stark [8] also investigated and developed a methodology that serves to identify the ROI using different image processing algorithms and clustering procedures. Corchs and Deco [9] implemented a neurodynamical model for visual attention, based on evidence from functional, neurophysiological and psychological findings (see also [10] and references therein). Their visual model consists of interconnected modules that can be related to certain components of the human visual cortex. We are interested in a reduced version of the model, that is, only the bottom-up component given by the module V1 that represents the primary visual cortex. Given an input image, this information enters the visual cortex through area V1. From this theoretical model we can calculate the neural activities of the V1 neurons, that correspond to the internal representation of the image, that we will name map of activities of the given input image. From these maps of activities we will determine the ROIs of the image. A. Our Neurodynamical Model Our model of the primary visual cortex V1 consists of pools of neurons with Gabor receptive fields tuned at different positions in the visual field, orientations and spatial frequency resolutions. There is also an inhibitory pool interacting with the complex cells of all orientations at each scale. Each pool of neurons is described within the mean field approximation [11] which consists of replacing the temporal averaged discharge rate of a cell with an equivalent activity of a neural population (ensemble average). In this way, a system of differential equations is obtained that represents the temporal evolution
of the neural activity of V1. After solving the system of differential equations and averaging over time, orientation and spatial frequency, the neural activity of V1 is obtained as a function of the spatial position. Highly activated spatial locations will correspond to regions attracting fixation. B. Mathematical Formulation Within this framework, V1 consists of a module that contains P x P hypercolumns that cover a N x N pixel scene. Each hypercolumn contains L orientation columns of complex cells with K octave levels corresponding to different spatial frequencies. The complex cells are modeled by the power modulus of Gabor wavelets [12]. We consider a pixelized gray-scaled image given by a N x N matrix Γij . The subindex ij denotes the spatial position of the pixel. Each pixel value is given a gray value coded between 0 and 255. The extraction of simple features from an image is performed in V1. The neurons in the pools of our V1 module have receptive fields performing a Gabor wavelet transform. Let us denote by Ikpql the sensorial input activity to a pool in V1 which is sensitive to a determined spatial frequency given at octave k, to a preferred orientation defined by the rotation index l and to stimuli at the center location specified by the indices pq. The Gabor receptive fields Gkpql (i, j) are given by the product of an elliptical Gaussian and a complex plane wave. The sensorial input activity to a pool in V1 is therefore defined by the module of the convolution between the corresponding receptive fields and the image Γ
Ikpql =
q
v° °2 u° ° u° X N N X ° u 2 ° Gkpql (i, j)Γij ° khGkpql , Γik = t° ° (1) ° ° i=1 j=1
The synaptic activity Akpql of the primary visual cortex area will be described within a mean field approximation [11]. For a given pool of neurons, the dynamics of the activity Akpql (t) is mathematically expressed by: τ
∂ Akpql (t) ∂t
=
−Akpql (t) + aF (Akpql (t))
−
bF (AIk (t)) + Ikpql (t) + I0 + ν
(2)
where F () is the response function (transforming current into discharge rate), I0 is a diffuse spontaneous background input, ν is Gaussian noise, a and b are constant parameters and AIk (t) represents the activity of the common inhibitory pool. Excitatory cell pools in each module are engaged in competition, mediated by this inhibitory pool which receives excitatory input from all the excitatory pools and provides uniform inhibitory feedback to each of the excitatory pools. There is one inhibitory pool interacting with complex cells of all orientations at each scale.
The dynamic evolution of activity at the cortical area level can be simulated in the framework of the present model by integrating the pool activity over space and time. A detailed explanation of the model can be found in [10]. In the present paper we are interested in evaluating the neural activity for a given position pq, which is obtained Rsumming P on k and l and integrating on time, i.e. Apq = dt k,l Akpql (t). For the present work, the following parameters have been used in the calculations: K = 3, L = 4, a = b = 0.95, I0 = 0.025, τ = 16 and the standard deviation noise ν, σν = 0.01 (the choices are based on biological parameters).
b
c
a
d
e
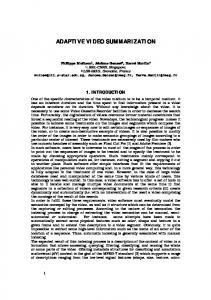
Fig. 1. Steps followed to obtain the ROIs of a given image: a) original frame image; b) activity map; c) thresholded activities; d) filtered activities; e) ROIs identified by superimposing the filtered image on the original frame.
III. R ESULTS AND D ISCUSSIONS
a
A. ROIs Extraction In Fig. 1 we show the processing steps followed to obtain the ROIs of a given image. The first step is to convert the original figure to a gray scale image. The second step consists in the evaluation of the activity map. This activity map, shown in Fig. 1b, indicates the neural activity of the V1 neurons according to the neurodynamical model described in section II. High intensity values in Fig. 1b indicate areas with high neural activity i.e. areas where we expect the visual attention to be focused. The idea is to associate these regions of high activities with the ROIs of the original image. The third step is to remove the noise and select only those regions with activities higher than a certain threshold. After several tests with different threshold statistics (mean, median, Gaussian intervals) we choose to use as threshold the average of the activity values (this means that we will use a different threshold for each of the images to be processed). Therefore, we retain only those pixels for which the corresponding activity is greater than the average. The results can be seen in Fig. 1c. The fourth step is to apply two morphological filters in order to smooth the borders and to fill small holes in those regions that formed during the threshold step (Fig. 1d). This filtered image is considered as the ’image mask’ and is finally superimposed to the original frame revealing the ROIs (Fig. 1e). As it can be seen from Fig. 1e, the regions resulting after these elaboration steps can be considered as the most interesting or salient regions (in terms of visual contents). Regions with less informative contents (in the example, the blue background and the uniform regions of the anchor’s jacket) are removed from the ROIs. In Fig. 2 we show other three frame examples with their corresponding ROIs.
b
Fig. 2. Examples of ROIs identified on three frames belonging to different videos: a) original frames; b) ROIs.
difference between itself and the successive frame in the sequence. Once the differences have been computed, the accumulated value curve is created. This curve is then sampled at constant interval along the y-axis. The points on the curve identified by the sampling are projected onto the x-axis and in this way the key frames are obtained. These key frames result to be non-uniformly sampled along the sequence. The rationale at the base of this approach is that the accumulate value curve captures the changes in the visual contents that happen along the video sequence: a big change between frames corresponds to a region of high slope in the curve. The sampling along these steeper slopes tends to retrieve more key-frames than in the other regions (see Fig. 3). In [4] the authors used a single measure to evaluate the frame differences. In the present work, instead of using only the color histogram, we combine the differences computed on three visual features: color histogram, edge’s directions histogram and wavelet statistics. The color histogram used is composed of 64 bins determined by the sampling of the
B. Key-frames Selection As stated in the introduction, we use the method described in [4] to select the key-frames in the video sequence. The method consists on computing the differences between consecutive pairs of frames based on some visual features that describe the frame contents, like color histogram or other similar visual descriptors. We associate to each frame the
Fig. 3.
Adaptive temporal sampling
HSV color space into group of meaningful colors. To evaluate the difference between two color histograms (dH ) we use the intersection measure. The edge’s directions histogram is composed by 72 bins and is evaluated by considering the gradient angle computed by the canny edge detectors. The difference between two edges directions histograms (dD ) is calculated using the Euclidean distance. The wavelets statistics consist in the means and standard deviations of the values in the 10 energy sub-bands resulting from the application for three iterations of the wavelet transform. The difference between two wavelets statistics (dW ) has been computed using the Euclidean distance [13]. The final frames difference measure (dHW D ) has been computed combining the three feature differences as follow: dHW D = (dH .dW ) + (dW .dD ) + (dD .dH )
(3)
This measure is able to detect significative changes, ignoring the small ones due to the camera moving or to acquisition and noise compression. Higher differences are obtained only if two or more of the feature differences agree (i.e. exhibit the same behavior).
C. Experiments and Evaluation of the Results The adaptive temporal sampling method requires that the number of key-frames (to be selected in the video sequence) has to be given in advance to the algorithm. Therefore, we asked to an ensemble of people to browse thorough the frames of each of the videos to be tested and to suggest how many key-frames should be used to summarize it. We then averaged the answers and we used the resulting score as input to the key-frame selection algorithm. For each video we obtain two summaries, the first one resulting from the application of the adaptive temporal sampling algorithm on the original video (summary one) and the second one resulting from the application of the algorithm on the ROIs determined with our method described in section III.A (summary two). Let us note that one of the biggest issues in the field of video summarization is the evaluation of results [14]. In order to assess the capability of our method to select the keyframes at meaningful points in a video sequence, we asked several people (different to the ones that choose the number of key-frames) to watch a set of videos (multiple times if necessary) and after each watching session, they had to answer the following question: how well do you think the summary represents the topic of the video? We have tested three different videos with seven subjects. Five persons out of seven have decided that the summary two gives a better description of the video content than the summary one.
IV. C ONCLUSIONS We have presented here an alternative approach to the problem of key frames selection for video summarization. We computed several visual features on the frame’s Regions-ofInterest. These ROIs have been obtained from a biologically based computational model of visual attention. Our preliminary results indicate the effectiveness of taking into account a biological model of our visual system in video summarization. We consider that more experiments should be done in order to confirm this first conclusion. Therefore, we are planning to generate new experiments with other video sequences, to extend our model to deal with color information, to test a different algorithm for the key-frame extraction and also to consider other methods for the evaluation of the results. ACKNOWLEDGMENTS The present work has been developed within the Italian MURST FIRB Project MAIS (Multi-channel Adaptive Information Systems) [15]. R EFERENCES [1] N. Dimitrova, H. Zhang, B. Shahraray, M. Sezan, T. Huang and A. Zakhor, ”Applications of video-content analysis and retrieval”, IEEE MultiMedia, vol. 9(3), pp.44-55, 2002. [2] F. Arman, A. Hsu and M.Y. Chiu, ”Image processing on Compressed Data for Large Video Databases”, Proc. ACM Multimedia ’93, Annaheim, CA, pp.267-272, 1993. [3] A. Pentland, R. Picard, G. Davenport and K. Haase, ”Video and Image Semantics: Advanced Tools for Telecommunications”, IEEE MultiMedia, vol. 1(2), pp.73-75, 1994. [4] S. Han, K. Yoon, and I. Kweon, ”A new Technique for Shot Detection and Key Frames Selection in Histogram Space”, Proc. 12th Workshop on Image Processing and Image Understanding, 2000. [5] A. Hanjalic, R. Lagendijk, and J. Biemond, ”A New Method for Key Frame based Video Content Representation”, Proc. First International Workshop on Image Databases and Multimedia Search, pp. 67-74, 1996. [6] L. Itti, and C. Koch, ”A model of saliency based visual attention of rapid scene analysis”, IEEE Trans. on Pattern Analysis and Machine Intelligence, vol. 20, pp.1254-1259, 1998. [7] G. Boccignone, A. Chianese, V. Moscato and A. Picariello, ”Foveated Shot Detection for Video Segmentation”, IEEE Transactions on Circuits and Systems for Video Technology, in press, 2004. [8] C. Privitera and L. Stark, ”Algorithms for defining visual regions of interest: comparison with eye fixations”, IEEE Trans. on Pattern Analysis and Machine Intelligence, vol. 22, pp. 970-982, 2000. [9] S. Corchs and G. Deco, ”Large-scale neural model for visual attention: integration of experimental single-cell and fMRI data”, Cerebral Cortex, vol. 12, pp. 339-348, 2002. [10] E. Rolls and G. Deco, ”Computational Neuroscience of Vision”, Oxford University Press Inc. New York, 2002. [11] H. Wilson and S. Cowan, ”Excitatory and inhibitory interactions in localised populations of model neurons”, Biological Cybernetics, vol. 12, pp.1-24, 1972. [12] T. Lee, ”Image representation using 2D Gabor wavelets”, IEEE Transactions on Pattern Analysis and Machine Intelligence, vol. 18, pp.959-971, 1996. [13] G. Ciocca, I. Gagliardi, R. Schettini, ”Quicklook2: An Integrated Multimedia System, International Journal of Visual Languages and Computing”, Special issue on Querying Multiple Data Sources, vol. 12, pp.81-103, 2001. [14] X. Zhu, J. Fan, A.K. Elmagarmid and X. Wu, ”Hierarchical video content description and summarization using unified semantic and visual similarity”, Multimedia Systems, vol. 9, pp.31-53, 2003. [15] http://black.elet.polimi.it/mais/index.php.