allows specification of colour matches for an average observer. ... temperature of approximately 4900 K [13]. ...... switch get(handles.light_group1,'Value') case 1.
Virtual Imaging System
Lulu Wang
A thesis submitted to Auckland University of Technology in fulfilment of the degree of Master of Engineering (ME)
2009
Faculty of Design and Creative Technologies
Primary Supervisor: Maximiano Ramos
1
ACKNOWLEDGEMENT There are many people I wish to formally thank for their contribution to this thesis. First of all, I would like to express my appreciations and gratitude to my supervisor, Dr Andrew Chalmers from the ECE department at the Manukau Institute of Technology. He is such knowledgeable, patient and helpful supervisor. During this master study, I learned more than I expected from him. Without his invaluable support, consistent and encouragement, I would not have finished this research.
Secondly, I would also like to thank my supervisor Dr Max Ramos for his suggestions during this research project. I gratefully acknowledge the support of the Institute for Biomedical Technologies (IBTec) at the Auckland University of Technology, particularly its Director, Professor A. M. Al-Jumaily.
I wish to thank Dr. David Parker for correcting this thesis (The first two chapters). He gave me lots of help and valuable suggestions about the writing.
I would like to thank all the staff in the Master of Engineering Programme at the Auckland University of Technology. I acknowledge the support of the ECE Research Committee at the Manukau Institute of Technology.
I would like to acknowledge of ethics approval by the AUTEC, the ethics application number is 08/173 and the approval date is 05 September, 2008. Thanks to all observers for testing of the virtual imaging system, particularly thanks to Dr Helen Zhou, A.T. Bookwala, Ashis Mookerjee, Gijs Ijpma, Robert Li, Hai Lan and Maggie Ma.
Finally, I wish to give my most sincere thanks to my parents. They have always stood behind me, without their support and encouragement, this thesis would not have been possible.
2
ABSTRACT The main purpose of this research project was to implement a combination of computer graphics and processing to generate displays that will aid in the visualization of the colour rendering properties of a range of light sources, including the new generation of high-output LEDs (light emitting diodes) that are becoming widely adopted in general lighting service. The CIE (International Commission on Illumination) has developed a colour appearance model CIECAM02 for use in colour imaging and colour management, and this model is utilized in this work.
This thesis describes the design and construction of a computer-based model that can be used as a research tool for the simulation and demonstration of the colour rendering properties of various artificial light sources. It is a comprehensive study of the colour models and measurement procedures currently in use in the lighting industry, as recommended by the CIE. This research project focused on the display of a set of surface colour patches as if they were illuminated by a specific light source, and the simultaneous display of two such sets to demonstrate the surface colour differences arising from the use of the two different light sources.
A VIS (virtual imaging system) has been developed to display the colour properties of a series of test colour samples under different light sources. This thesis describes the computer models developed for the representation and display of surface colours in general, and colour rendering in particular. The designed system computes and displays the colour of each sample from a knowledge of the light-source spectrum and the spectral reflectance of each surface. It can simultaneously display the colours resulting from illumination by two different sources. In addition, the system computes the colour appearance differences for two sets of colours using the CIECAM02 colour appearance model. Subjective and objective tests were taken to validate the computed results.
3
The VIS has been designed and implemented. It also has been tested by 21 observers and we believe that it will be a powerful research tool for the lighting industry, especially in relation to colour rendering.
4
TABLE OF CONTENTS ACKNOWLEDGEMENT ................................................................................ 2 ABSTRACT .................................................................................................... 3 TABLE OF CONTENTS .................................................................................. 5 LIST OF FIGURES ......................................................................................... 7 LIST OF TABLES ........................................................................................... 9 LIST OF TABLES ........................................................................................... 9 STATEMENT OF ORIGINALITY ................................................................. 10 GLOSSARY .................................................................................................. 11 ABBREVIATIONS ........................................................................................ 13 1.INTRODUCTION ......................................................................................... 1 1.1
Background ..................................................................................................... 1
1.2
Objectives......................................................................................................... 2
1.3 Structure of the Thesis.................................................................................... 3 2.THEORETICAL PRINCIPLES ..................................................................... 5 2.1
Introduction ..................................................................................................... 5
2.2 Colorimetry ..................................................................................................... 5 2.2.1 Light Source and Illuminants ........................................................................ 5 2.2.1.1 CIE Standard Illuminantion .................................................................. 6 2.2.1.2 LED light sources ................................................................................. 7 2.2.1.2.1 Development of LEDs ...................................................................... 7 2.2.1.2.2 Application areas of LEDs ................................................................ 8 2.2.2 Spectral power distribution (SPDs) of Illuminants Measurement ................ 9 2.2.3 Colour Matching Functions (CMFs) ........................................................... 10 2.2.4 Chromaticity Diagrams ............................................................................... 11 2.2.5 CIE Colour Spaces ...................................................................................... 13 2.2.6 Colour-difference Specification .................................................................. 14 2.3
Colour Rendering (CR) and Colour Rendering Index (CRI) ................... 14
2.4 Colour Appearance Model ........................................................................... 17 2.4.1 Introduction ................................................................................................. 17 2.4.2 CAM02 ....................................................................................................... 1 8 2.5 Correlated Colour Temperature (CCT) ..................................................... 19 3 VIRTUAL IMAGING SYSTEM .................................................................. 21 3.1
Introduction ................................................................................................... 21
3.2
Software Selection ......................................................................................... 21
3.3
Equipment ..................................................................................................... 21
3.4
Research Method .......................................................................................... 22 5
3.5
The Computer Interface Design Process .................................................... 22
3.6 Development of The Virtual Imaging System (VIS)Error! Bookmark not defined. 3.6.1 Main GUI .................................................................................................... 29 3.6.1.1 Monitor Calibration GUI (Monitor Set-up) ........................................ 31 3.6.1.2 Selection of Light Sources .................................................................. 33 3.6.1.3 Selection of Colour Samples for Display............................................ 33 3.6.2 Colour Management System (CMS) ........................................................... 34 3.6.2.1 Compute Ra and Tc of Light Sources ................................................. 39 3.6.3 SPD Displaying GUI (Plot SPD_GUI) ....................................................... 39 3.6.4 Reflectance Plotting GUI (Plot Re_GUI) ................................................... 40 3.7 Summary ........................................................................................................ 41 4.SUBJECTIVE TESTING ............................................................................ 43 4.1
Introduction ................................................................................................... 43
4.2 Subjective Testing Method ........................................................................... 43 4.2.1 Observers .................................................................................................... 43 4.2.2 Colour Vision Test ...................................................................................... 44 4.2.3 Colour Displays Test................................................................................... 44 4.2.3.1 Group I (5 Observers) 60 Minutes ...................................................... 45 4.2.3.2 Group II (10 Observers) 30 Minutes ................................................... 47 4.2.3.3 Group III (6 Observers) 15 Minutes ................................................... 50 4.3 Test Results .................................................................................................... 51 4.3.1 Test Results from Group I........................................................................... 51 4.3.2 Test Results from Group II ......................................................................... 57 4.3.3 Test Results from Group III ........................................................................ 60 5.OBJECTIVE TESTING .............................................................................. 65 5.1
Introduction ................................................................................................... 65
5.2 Objective Testing Method ............................................................................ 65 5.2.1 CIECAM02 Model...................................................................................... 65 5.2.2 Measurement ............................................................................................... 66 5.2.3 The CECAM02 Model ................................................................................ 66 5.3 Objective Testing Results ............................................................................ 6 8 5.3.1 Testing results from CIECAM02 Model .................................................... 6 8 5.3.2 Test Results From Measurement ................................................................ 72 6.CONCLUSIONS ......................................................................................... 75 6.1
Introduction ................................................................................................... 75
6.2 Discussion of Test Results ............................................................................ 75 6.2.1 Test Results from subjective test (Refer to Chapter 4) ............................... 75 6.2.2 Test Results from Objective Test (Refer to Chapter 5) .............................. 76 6.3
Outcomes of the Research Project............................................................... 76
6.4
Conclusion .................................................................................................... 8 1
6.5 Recommendation.......................................................................................... 8 1 APPENDICES .............................................................................................. 8 2 REFERENCE .............................................................................................. 211 6
LIST OF FIGURES Figure 1.1-Thesis Structure 4 Figure 2.1-The fundamental components that lead to the perception of colour: a light source, a selectively reflecting surface (of an object) and a three-channel detector 5 Figure 2.2-Spectral power distributions of CIE standard illuminants 7 Figure 2.3-Left: The spectrometer and measurement object. Right: Acquired signal spectral of a red object under sunlight 9 Figure 2.4-Schematic representation of reflection 10 Figure 2.5-The CIE colour-matching functions for the 1931 Standard Colorimetric Observer 11 Figure 2.6-CIE 1931 Colour Space Chromaticity Diagram 12 Figure 2.7-3D representation of the CIELAB L, a* and b*coordinates 13 Figure 2.8-Block diagram to illustrate the CRI calculation process 16 Figure 2.9-Comparing the colour appearance under different light sources (left); Test swatches under different light (right) 17 Figure 2.10-Colour display appearance model 19 Figure 2.11-Colour temperatures in Kelvin scale 20 Figure 3.1-The first version of VIS 23 Figure 3.2-Final version of VIS 23 Figure 3.3-The first version of CMCDS 24 Figure 3.4-Second version of CMCDS 24 Figure 3.5-The third version of CMCDS 25 Figure 3.6-The fourth version of CMCDS 26 Figure 3.7-The fifth version of CMS 27 Figure 3.8-Final version of colour management system (CMS) 27 Figure 3.9-Main structure of VIS 28 Figure 3.10-Virtual Prototyping system based on CIECAM02 29 Figure 3.11-Monitor Set-up Screen 30 Figure 3.12-Select light sources 30 Figure 3.13-Display Ra and Tc of selected light sources 30 Figure 3.14-Calculate RGB values of the displayed 16 colour samples under CIED65 31 Figure 3.15-Test images under CIED65 with gamma=1.8 and K1=1(left side), K1=1.2(right side) 32 Figure 3.16-Colour management and display process 35 Figure 3.17-Flow chart of the colour display model 38 Figure 3.18-CIE13_3D.EXE program 39 Figure 3.19-Display Spectral Power Distributions of illuminants 40 Figure 3.20-Plot reflectance of 16 test colour samples 41 Figure 3.21-MATLAB GUI system interface 42 Figure 4.1-Test image shown to Group I 44 Figure 4.2-Group I total score for reference illuminants CIE A 53 Figure 4.3-Ranking of illuminants in Group CIE A 55 Figure 4.4-Ranking of illuminants in Group CIE D50 56 Figure 4.5-Group I average magnitude for illuminants in group CIE D50 56 Figure 4.6 – Tc Group D50 63 Figure 4.7 – Tc Group D65 63 Figure 4.8 – Tc Group PM4000 63 7
Figure 5.1-Colour difference computation model Figure 5.2- RMS Error and Ra in Group CIE A Figure 5.3- RMS Error and Ra in Group PM4000K Figure 5.4- RMS Error and Ra in Group CIE D50 Figure 5.5- RMS Error and Ra in Group CIE D65 Figure 5.6-Colour difference from measurement and file values Figure 6.1-MATLAB GUI Figure 6.2-Main GUI Figure 6.3-List of available source spectra Figure 6.4-Calculate RGB of displayed colours Figure 6.5-Graph of current source SPDs Figure 6.6-Graph of current reflectance spectra
8
65 70 70 71 71 74 78 7 79 79 0 0
LIST OF TABLES Table 2.1-Brief History of commercial LED Development Table 2.2-CIE CR groups Table 2.3-CRI for different light sources Table 3.1 - Comparison of Microsoft Paint, Blender and MATLAB GUI Table 3.2-Gamma value function Table 3.3-Offset K1 value function Table 3.4-Gamma & K1 OK Button Table 3.5-The displayed test colour samples Table 3.6-Colour displays for CRT monitor Table 3.7-Colour displays for CRT monitor II Table 3.8-Matrix of calibrated CTR monitors I & II Table 3.9-Plot reflectance function Table 4.1-Sources in groups based on their colour temperature Table 4.2-Question sheet for Group II Table 4.3-Question sheet for Group III. Table 4.4-Test results of monitor set-up Table 4.5-Test results from Group I Table 4.6-Rank table for light sources compared with CIE Illuminat A Table 4.7-Rank table for light sources compared with CIE Illuminant D50 Table 4.8-Rank table for light sources compared with CIE D65 Table 4.9- Test results from Group I Table 4.10-Comparison table of test light sources in Group I & II Table 4.11-Ra and Tc of light sources in Group III evaluations Table 4.12-Illuminants ranking table Table 4.13-Test results by Group III Table 5.1-Sources used in colour appearance difference computation Table 5.2-Measure Group I Table 5.3-Colour appearance difference tables Table 5.4-Comparison table of the Measurement results
9
8 17 17 21 32 32 32 34 36 37 37 40 46 49 50 51 52 54 55 57 58 59 60 61 62 66 68 69 73
STATEMENT OF ORIGINALITY ‘I hereby declare that this submission is my own work and that, to the best of my knowledge and belief, it contains no material previously published or written by another person nor material which to a substantial extent has been accepted for the qualification of any other degree or diploma of a university or other institution of higher learning, except where due acknowledgment is made in the acknowledgments.’
……………………….. (signed)
…………………….. (date)
10
GLOSSARY Colour Rendering
It is the effect of an illuminant on the colour appearance of objects by conscious or subconscious comparison with their colour appearance under a reference illuminant.
Colour Rendering Index
It is a specification of the colour rendering property of a light source. The CRI is calculated by comparing the colorimetric values for a given set of test colours illuminated by the test light source against the values for the same test colours illuminated by a reference illuminant with a colour temperature close to that of the test light source.
Colour Temperature
It is a characteristic of visible light that has important applications in lighting, photography, videography, publishing, and other fields. The colour temperature of a light source is determined by comparing its chromaticity with that of an ideal black-body radiator.
Colorimetry
In its strict sense is a tool used for making a prediction on whether two lights (visual stimuli) of different spectral power distribution will match in colour for certain given conditions of observation. The prediction is made by determining the tristimulus values of two visual stimuli. If the tristimulus values of a stimulus are identical to those of the other stimulus, a colour match will be observed by an average observer with normal colour version.
Colorimeter
It is a device used for colorimetry. It measures the absorbance of different wavelengths of light in a solution.
11
Spectral Power Distribution
Describes the power per unit area per unit wavelength of any radiometric or photometric quantity.
Colour Adaptation
Changes in visual perception of colour with prolonged stimulation or adjustment of vision to degree of brightness or colour tone of illumination.
12
ABBREVIATIONS CR
Colour Rendering
Ra
General Colour Rendering Index
Ri
Special Colour Rendering Index
Tc
Colour Temperature
SPD
Spectral Power Distribution
CIE
International Commission on Illumination.
LED
Light-emitting diode
ISO
International Organization for Standardization
VIS
Virtual Imaging System
CMS
Colour Manage System
CMCDS
Colour-Managed Computer Display System
RGB
Red, Green and Blue
13
1 INTRODUCTION 1.1 Background During the past 30 years, the method of calculating the colour rendering index (CRI) has slowly developed. The currently recommended CRI calculation method was originally introduced in 1974, and it is described, with a few minor revisions, in the current publication CIE 13.3-1995[1] (The CIE is the International Commission on Illumination which is the main standardizing body in the field of lighting and related areas- and the acronym CIE comes from the French version of its name).
The potential use of LED (Light Emitting Diode) light sources as the predominant lighting in future clinical situations [2] means that there is a need to be able to assess their colour rendering properties. This is particularly critical in situations where clinicians will be making a visual judgment of a patients‘ conditions based on the appearance of their complexion. LEDs appear to offer economic and engineering advantages over existing light sources in terms of length of life and efficiency. However, because their spectral properties often differ significantly from those of existing sources, it follows that their colour rendering can also be difficult to predict [3].
White LED light sources are efficient, long-life, and compact. The luminous flux and the luminous efficacy of commercially available LED light sources are improving rapidly. High CIE colour rendering indices could be achieved by varying the types of LEDs used in the LED light sources. The conclusion of the relevant technical report of the CIE is that the CIE CRI is generally not able to give an accurate prediction of the colour rendering of white LED light sources. For all white-light LED applications, an up-to-date mathematical model for calculating colour rendering index, correlating well with visual experience is needed [3, 4].
For white LEDs to be used in general lighting, they should have an appropriate white colour and good colour rendering performance for illuminated objects. CR (Colour
1
rendering) and energy efficiency are the two most important criteria for traditional light sources in general lighting [4]. CR is defined in the Glossary on page [5].
Davis et [6, 7] all used a multispectral camera to estimate the spectral reflectance of natural scenes pixel by pixel; and then the tristimulus values of the scene under a certain illuminant were reproduced on a calibrated CRT monitor. This technique was applied to visually evaluate the colour rendering properties of white LED light sources including nine RGB (Red, Green and Blue) LED clusters and one blue LED with a yellow phosphor. The semantic differential method was applied to evaluate the visual impression of five natural scenes under these illuminants. The authors concluded that a new colour rendering index was needed to fully describe the visual impression related to the colour rendering phenomenon. The present project is intended to replicate and extend this work – but using a modified technique that is based on independent spectral measurements to supplement the normal 3-band digital colour system instead of the (far more expensive) multi-spectral imaging.
This research project focuses on implementing a combination of computer graphics and processing to generate displays that will aid in the visualization of the colour rendering properties of a range of light sources. These sources will include the new generation of high-output LEDs that are becoming widely adopted in the general lighting service. The CIE has developed a colour appearance model CIECAM02 [8] for use in colour imaging and colour management, and it was intended to utilize this model in this work.
1.2 Objectives A major objective of the work was to enable the user to study the colour rendering effects [9] of various light sources, by both computation and display of the colour differences between corresponding pairs of surface colours as they appear when illuminated by two different sources. This has necessitated a comprehensive study of the colour models and measurement procedures currently in use by the lighting industry, as recommended by the CIE – and these are briefly reviewed below.
The main objectives of this research are listed below: 1. To calibrate a suitable computer monitor to display colour images of repeatable quality. 2
2. To design a computer display model to display the colour rendering performance of different light sources. 3. To allow the user to select representative test light sources. 4. To allow the user to select appropriate test colour samples. 5. To allow the user to analyse the spectral reflectance of colour samples. 6. To allow the user to set up the monitor (by selecting gamma r and offset k1 values) 7. To allow the user simultaneously to view and compare the colour samples under two different light sources. 8. To allow the user to calculate RGB values of each displayed colour sample under the selected light source. 9. To allow the user to view the Ra (special colour rendering index) and Tc (colour temperature) of each selected light source. 10. To allow the user to plot and display the SPD of each selected light source. 11. To allow the user to view the spectral reflectance of each displayed colour sample. 12. To display the predicted colours as accurately as possible. 13. To compute colour differences between colour samples under two different (selected) sources, using the CIECAM02 colour appearance space [8]. 14. To verify testing the results of step 13 by groups of observers.
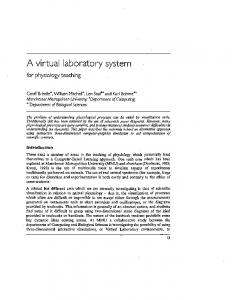
1.3 Structure of the Thesis Figure 1.1 displays the main structure of this thesis. The organization of the rest of the thesis is as follows: chapter two details all the theory of the technology. The VIS (virtual imaging system) are designed and explained in chapter three. The fourth chapter gives subjective and objective test methods of the VIS, and fifth chapter details test results of the designed VIS with the explanations. The research outcomes and conclusions of the thesis are located in chapter six, recommendations for future work are also given in this chapter.
3
Chapter 1 Introduction
Chapter 2 Theoretical Principles
Chapter 3 Virtual Imaging System
Chapter 4 Test Methods
Chapter 5 Test Results
Chapter 6 Conclusion
Figure 1.1-Thesis Structure
4
2 THEORETICAL PRINCIPLES 2.1 Introduction This chapter introduces background information and theory relevant to this research project. All the required information and technologies which lead to the final research product will be described in this chapter. Parts of this literature review will refer to appendices for more details.
This chapter covers four main topics as follows: colorimetry, colour rendering and CRI, colour appearance model and colour temperature.
2.2 Colorimetry Colorimetry is the measurement of colour, it is can be used as a tool to check whether two lights of different SPD will match in colour for certain given conditions of observation [11]. The first consistent system was recommended by CIE in 1931, while allows specification of colour matches for an average observer. This system is now certified by ISO (International Organization for Standardization) as an international standard. The precise definition of colorimetry is found in CIE Publication 15.2 [12]. This section describes the well-established techniques of basic colorimetry that form the foundation for colour appearance modelling. 2.2.1
Light Source and Illuminants
Figure 2.1-The fundamental components that lead to the perception of colour: a light source, a selectively reflecting surface (of an object) and a three-channel detector 5
The first component of the appearance of colour in Figure 2.1 is the light source. The electromagnetic energy, which is required to initiate visual responses, is providing by light sources. A light source is an actual physical emitter of visible energy, such as incandescent light bulb. An illuminant is simply a standardized table of values that represent a spectral power distribution typical of a particular light source . 2.2.1.1 CIE Standard Illuminantion The CIE has recommended certain illuminants to be used for general colorimetry. These are defined by relative spectral power distributions; their details are given in Appendix 1. Figure 2.2 illustrates the SPDs of the CIE standard illuminants [13]. CIE standard illuminant A: This is a standardized representation of a typical incandescent source, it is a particular type of tungsten source that produces the relative spectral power distribution of the CIE illuminant A [13]. CIE standard illuminant D65: This is a standardized representation of a typical incandescent source, it is a particular type of daylight source. CIED65 is a statistical representation of an average daylight with a correlated colour temperature of approximately 6500 K [13]. Other illuminants D: CIE recommended that D65 be used whenever possible in the interest of standardization. When D65 cannot be used, CIE recommended the use of one of the daylight illuminants D50, D55, or D75. When none of these daylight illuminants can be used, a daylight illuminant at a nominal correlated colour temperature (CCT) can be calculated using the CIE published equations in CIE15_3, 1993 [11]. Illuminant D50 represents an average daylight with a CCT of 5003 K, D55 represents an average daylight with a CCT of 5503 K and D75 represents an average daylight with a CCT of 7507 K. Illuminant B: Originally intended to represent direct sunlight with a correlated colour temperature of approximately 4900 K [13]. lluminant C: This is intended to represent average daylight with a correlated colour temperature of approximately 6800 K [13].
6
Figure 2.2-Spectral power distributions of CIE standard illuminants 2.2.1.2 LED light sources A LED is a type of semiconductor diode. The LED effect is a form of electroluminescence where incoherent and narrow spectrum light is emitted from the pn junction. It is usually a small area (less than 1 mm2) light source, often with optics added to the package to shape its radiation pattern and improve efficiency. LEDs are widely used as indicator lights on electronic devices and increasingly in higher power applications such as flashlights and area lighting [14]. 2.2.1.2.1
Development of LEDs
The LED was first created in the middle of 1920s by Russian Oleg Vladimirovich Losev. The first practical visible-spectrum (red) LED was developed in the 1960‘s. Other types of monochromatic LEDs, which include yellow-green, yellow, green and amber light LEDs, have been successively developed and marketed since this the first discovery. Meanwhile, their intensity radiant has been increasing gradually, and LEDs have become widely used in various application fields, such as display sources, indicator lamps, traffic signs, automobile lighting, and special fields of illumination [14, 15].
7
The first blue LED was developed in 1993 and the market for LEDs has rapidly become larger. A newly developed high efficiency phosphor is a combination of a blue LED and a white LED was developed and put into the market in 1996. Nowadays, these kinds of white LEDs are being investigated as application for general lighting fields. White light LEDs are expected to be used as the major light sources in the 21st Century. Table 2.1 displays the brief history of LED development [15]. Table 2.1-Brief History of commercial LED Development Year 1967 1975 1978 1993 1997 2001
Development of LEDs 1st LED (red light, GaAs+LaF3YbEr) Yellow light LED High brightness red light LED Blue light LED White light LED (blue LED + phosphor) White light LED (UV LED + phosphor)
White LEDs to be used for general lighting should have appropriate white colour and good colour rendering performance for illuminated objects. Colour rendering and energy efficiency have been the two most important criteria for traditional light sources in general lighting [3, 4]. 2.2.1.2.2
Application areas of LEDs
LEDs were commonly used to replace incandescent indicators and seven-segment displays in the early days, first in expensive equipment such as laboratory and electronics test equipment, then later in such appliances as TVs, radios, telephones, calculators, and even watches. These red LEDs were bright enough only for use as indicators, as the light output was not enough to illuminate an area. Later, other colours became widely available and also appeared in appliances and equipment. The light output has been increased as the LED materials technology became more advanced, while maintaining the efficiency and the reliability at an acceptable level. These advantages lead that LEDs are becoming bright enough to be used for illumination in various applications such as lamps and other lighting fixtures, as well as in clinical situations.
The potential use of LED light sources as the predominant lighting in future clinical situations means that there is a need to be able to assess their colour rendering properties. This is particularly critical in situations where clinicians will be making 8
visual judgment of patients‘ conditions based on the appearance of their complexion. LEDs appear to offer economic and engineering advantages over existing light sources in terms of length of life and efficiency. However, because their spectral properties often differ significantly from those of existing sources, it follows that their colour rendering can also be difficult to predict [2]. 2.2.2
Spectral power distribution (SPDs) of Illuminants Measurement
The SPD shows the brightness of an object at each wavelength of light. The wavelengths most commonly used are in the range from 380 nm to 780 nm, the range that the human eye can respond to [16].
Figure 2.3-Left: The spectrometer and measurement object. Right: Acquired signal spectral of a red object under sunlight [16] A typical SPD is shown on the right Figure 2.3. In order to understand the effect that a light source has on the colour of an illuminated surface, it is necessary to note that most ordinary surfaces in ones surroundings emit light by virtue of reflection.
The reflected spectrum is essentially the source spectrum as modified by the absorption and reflection properties of the surface. The process is modelled in Equation (2.1), and illustrated in Figure 2.4.
9
Figure 2.4-Schematic representation of reflection
r e
(2.1)
Where r = SPD of reflected light
e = SPD of emitter (light source)
= spectral reflectance of surface (SPD = spectral power distribution) In most normal viewing conditions, this reflected spectrum will evoke a colour response in the observer [16] that is governed not only by the reflectance of the surface of interest (as represented here) but also by the reflectances of all the surfaces in the field of view, especially surfaces that the viewer judges (either consciously or subconsciously) to be neutral in colour. 2.2.3
Colour Matching Functions (CMFs)
These colour-matching functions are given in the standard as values from 360 nm to 830 nm at 1 nm intervals with seven significant figures, and they define the CIE 1931 standard colorimetric observer [17]. The CIE also recommended 1931 and 1964 CMFs (colour matching functions) as the standard observers which are 2 degrees and 10 degrees [19, 20]. The CMFs illustrated in Figure 2.5 indicate the amount of the primaries required to match unit amount of power at each wavelength. This project decided to use the CIE 1931 (2 degrees) CMFs to complete the final design.
10
Figure 2.5-The CIE colour-matching functions for the 1931 Standard Colorimetric Observer
X k R( ) S ( ) x( )d Y k R( ) S ( ) y ( )d
(2.2)
Z k R( ) S ( ) z ( )d
Where k 100 / S ( ) y( )d S ( ) = SPD of selected light source R( ) = wavelength interval (usually 5 nm)
The tristimulus values X, Y, Z are in turn computed from knowledge of the light source spectrum and the reflectance spectrum of the surface colour sample, as set out in Equation (2.2) [20]. 2.2.4
Chromaticity Diagrams
Chromaticity diagrams provide a convenient two dimensional representation of colours. A triplet of tristimulus values can be used to specify the colour of a stimulus. Brightness and chromaticity are the two main parts of a colour specification. In this case, the colour white is a bright colour, while the colour grey is considered to be a less bright version of that same chromaticity [21].
11
Figure 2.6-CIE 1931 Colour Space Chromaticity Diagram [22] Figure 2.6 displays the CIE 1931 colour space chromaticity diagram. Chromaticity coordinates (x, y) can be calculated by using Equations (2.3) and (2.4). The trisitimulus value of Y approximately correlates with the brightness or lightness has been configured by CIE. The third chromaticity coordinate can always be obtained from the other two since the three always sum to unity. Therefore z can be calculated from x and y by use of Equation (2.6) [21]. X X Y Z Y y X Y Z Z z X Y Z x
(2.3) (2.4) (2.5)
z 1 x y
(2.6)
Usually the Y tristimulus value is reported, since it contains the luminance information. The Y tristimulus value is very useful for calculating the other two tristimulus values from chromaticity coordinates. They are given in Equations (2.7) and (2.8). X
Z
xY y
(2.7)
(1.0 x y )Y y
(2.8)
12
2.2.5
CIE Colour Spaces
Colour spaces are developed to provide uniform practices for the measurement of colour difference, something that cannot be done reliably in tristimulus or chromaticity spaces. In 1976, CIE recommended two colour spaces (CIELAB and CIELUV) as interim solutions to the problem of colour-difference specification. CIELAB has become almost universally used for colour specification and particularly colour-difference measurement since 1976. CIELAB is be used in this research project [11].
The CIELAB colour space can be calculated by Equations (2.9) through (2.13) for tristumulus values normalized to the white that are greater than 0.008856. X, Y, Z are the tristimulus values of the stimulus; Xn, Yn and Zn are the tristimulus values of the reference white; L* represent lightness; a* indicates redness to greenness; b* indicates * yellowness to blueness; Cab means chroma; and hab means hue. These are displaying in
Figure 2.7 Normally the range of L* is from 0 to 100 which indicates darkness to brightness [11, 22].
Figure 2.7-3D representation of the CIELAB L, a* and b*coordinates [23] Y 1/ 3 ) 16 Yn X 1/ 3 Y a* 500[( ) ( )1 / 3 ] Xn Yn Y Z 1/ 3 b* 200[( )1 / 3 ( ) ] Yn Zn L* 116(
13
(2.9) (2.10) (2.11)
* Cab (a *2 b *2 )
(2.12)
b* (2.13) ) a* The CIELUV colour space can be calculated by use of Equations (2.14) through (2.18) hab tan 1 (
for tristumulus values normalized to the white that are greater than 0.008856. L* 116(
Y 1/ 3 ) 16 Yn
(2.14)
u* 13L * (u ' un' )
(2.15)
v* 13L * (v' vn' )
(2.16)
Cab* (u *2 v *2 )
(2.17)
huv tan 1 (
v* ) u*
(2.18)
In these equations u ' and v ' are the chromaticity coordinates of the stimulus; u 'n and v 'n are the chromaticity coordinates of the white reference; L* represents lightness; u * * indicates redness to greenness; v* indicates yellowness to blueness; Cab represents
chroma; and huv means hue [11]. 2.2.6
Colour-difference Specification
* The colour difference Eab in CIELAB space is the distance between the coordinates
for the two stimuli. This can be calculated by use of Equation (2.19). At the same time, it can also be expressed in terms of lightness, chroma and hue differences as illustrated in Equation (2.20) by use of the combination of Equations (2.19) and (2.21) [11]. * Eab [L *2 a *2 b *2 ]1 / 2
2
2
2
2
* * * 1/ 2 Eab [L *2 Cab H ab ]
2
* * * 1/ 2 H ab [Eab L* Cab ]
(2.19) (2.20) (2.21)
2.3 Colour Rendering (CR) and Colour Rendering Index (CRI) CR is defined as the ―Effect of an illuminant on the colour appearance of objects by conscious or subconscious comparison with their colour appearance under a reference illuminant‖ [5]. 14
As mentioned in chapter 1, the currently recommended colour rendering index (CRI) calculation method was originally introduced in 1974, and it is described, with a few minor revisions, in the current publication CIE 13.3-1995 [1]. The CIE first standarized a spectral band method for CR in 1948 but, in 1961, it was decided to regard the ―test sample colour shift‖ method [3] as the fundamental method for CR appraisal. The CRI is measured by comparing the colour rendering of the test source to reference source under the same colour temperatures. Following the CIE, colour rendering is given as an index between 0 and 100, while the value can not exceed 100, it can be less than zero. Where 0 approximates ―very poor‖ colour rendering and 100 approximates ―very good‖ colour rendering [5, 24].
In an attempt to provide a basis for ranking light sources in terms of their colour rendering capabilities, the CIE has produced [CIE CRI doc] a ―general‖ CRI Ra, and a set of ―special‖ colour rendering indices, Rn (n = 1 … 14) for a specified set of test colours. These values can be obtained from Equation (2.22) and (2.23), where Ei is the colour difference on the 1964 U*V* W* uniform colour space [25].
Ri 100 4.6Ei Ra
(2.22)
1 8 Ri 8 i 1
(2.23)
Figure 2.8 illustrates the basis for this method of specification. It was first designed during the 1960s, at a time when fluorescent tubes were rapidly becoming the dominant light source internationally, and consumers were being presented with choices between high-efficiency low-CRI lamp types and low-efficiency high-CRI types. The CRI is a simple figure of merit, generally between 50 and 100 for fluorescent lamps, and it was intended to provide consumer guidance in the choice of the ―right tube for the job‖. The basic structure of the CRI model has remained largely unchanged since its inception, with only relatively minor changes to the details of the calculation methods in the subsequent revisions.
15
Test Light Source
Equal CCT
Reference Light Source
Set of 14 Surface Colour Samples
Convert XYZ to U*V*W*
Compute Colour Differences (Reference Vs Test Source)
Compute CRI
Figure 2.8-Block diagram to illustrate the CRI calculation process Figure 2.9 displays the colour appearance under different light sources (left) and test swatches under different light (right). It can be seen that the same colour samples are look different under two different light cabinets, to achieve this performance normally need two light cabinets would be needed. A light booth that contains 4 kinds of light sources is expensive (around US$1490) and it is hard for the owner to add new light sources. The driving force for the development of this system is the wide range of new high-output LED sources now entering the market-place and being utilized in applications as diverse as operating-theatre lights and marine navigation beacons. In certain applications, colour rendering is critically important. Reported attempts to classify the colour rendering performance of LEDs using the existing CIE specifications and recommendations [26] have proved to be unsatisfactory and misleading. This has led the CIE to promote new research into colour rendering with the aim of establishing revised recommendations in the appropriate areas.
One objective of the final designed computer model in this research project is implementing the same performance as a lighting cabinet does, but at a cheaper price and with the ability for users to add new light sources.
16
Figure 2.9-Comparing the colour appearance under different light sources (left); Test swatches under different light (right) [26] Table 2.2 and Table 2.3 show the group of the CIE colour rendering and colour rendering index for different application and for different light sources. Table 2.2-CIE CR groups [26]
Group 1A
Ra 90...100
1B 2 3
80...90 60...80 40...60
4
20...40
The CIE colour rendering groups Importance Typical application accurate colour matching Galleries, medical examinations, colour mixing accurate colour judgement Home, hotels, offices, schools moderate colour rendering Industry, offices, schools accurate colour rendering is of Industry, sports halls little importance accurate colour rendering is of Traffic lighting no importance
Table 2.3-CRI for different light sources [26] Colour rendering index for different light sources Light source Colour rendering group Incandescent 1A Metal halide 1A ... 2 Fluorescent 1A ... 3 High pressure sodium 1B ... 4 Low pressure sodium 4
2.4 Colour Appearance Model 2.4.1
Introduction
A colour appearance model includes the relative colour appearance at tributes of lightness, chroma, and hue. Reasonable predictors of these attributes of a model must include at least some form of a chromatic- adaptation transform. Models must be more complex to include predictors of brightness and colorfulness or to model luminance 17
dependent effects such as the Stevens effect or the Hunt effect [11]. The CIE has developed a colour appearance model CIECAM02 for use in colour imaging and colour management, and it is intended to utilize this model in this work [8]. 2.4.2
CAM02
One purpose of this project was to be able to investigate the correlation between the computed colour differences and the subjectively-judged colour differences as seen by a set of observers viewing the calibrated monitors. For this reason, the colour differences have been computed in CIECAM02 colour appearance space in an effort to enhance the correlation [8].
This space is based on the CIECAM02 colour appearance model [10], the origins and applications of which are explained in the relevant CIE publication 2003. A CIECAM02 colour appearance difference can be computed by use of Equation (2.24).
EC (J )2 (ac )2 (bc )2
(2.24)
Where ac C cos(h) ,
bc C sin(h) , and [J, C, h] are the lightness, chroma and hue attributes, respectively, in the CIECAM02 model.
The appearance attributes [J, aC, bC] can be calculated from the CIE-1931 tristimulus values [X, Y, Z] by the use of a somewhat complex series of non-linear transformations described in the CIE specification. A number of parameters are used to model the viewing conditions experienced by the observers, as outlined below. These in turn are used to define the exact form of the non-linear relationships in the model. The procedure is outlined schematically in Figure 2.10 [27, 28, 29].
18
Define Background Viewing Conditions
Define Monitor Viewing Conditions
Input [X Y Z] for selected
Apply Viewing
sample and source
Conditions and [X Y Z]
Apply Non-linear Model
Appearance Attributes [J, aC, bC]]
Figure 2.10-Colour display appearance model
2.5 Correlated Colour Temperature (CCT) One important application of visible light in lighting, photography and videography is colour temperature. The colour temperature of a light source is measured and expressed by the resultant chromaticity coordinates (x, y). The colour of ―white light‖ can be expressed by CCT (correlated colour temperature) in Kelvin (K) units. The CCT is measured as the heated black body radiator matches the colour of the light source‘s colour temperature and it is related to Planck‘s law for a black body source. Figure 2.11 shows that the lower colour temperatures (2700-3600 K), which look yellow-red, are considered as warm while high colour temperatures (3600-5500 K) are considered cool. Warm light is recommended for most general indoor uses while cool light is considered better for visual tasks [7, 26, 30, 31].
19
Figure 2.11-Colour temperatures in Kelvin scale [31]
20
3
VIRTUAL IMAGING SYSTEM
3.1 Introduction This research project aimed to design a VIS (virtual imaging system), which uses a combination of computer graphics and image processing to generate displays that will aid in the visualization of the colour rendering properties of a range of light sources including the new generation of high output LEDs. This chapter details the design process of the VIS, and includes the selection of software, equipment section, design method and processes, data collection and final design model, as well as the testing of the final model.
3.2 Software Selection Microsoft Paint, MATLAB GUI and BLENDER were initially considered for use as the research software. Table 3.1 compares Microsoft Paint, Blender and MATLAB GUI in ten difference areas. Because MATLAB contains colour imaging tool box and it can display better colour images than Microsoft Paint and Blender, it decided to use MATLAB to complete the system. Table 3.1 - Comparison of Microsoft Paint, Blender and MATLAB GUI
RGB Value 2D displaying 3D displaying Material Choose Able ImageSave Format Control Colour Colour imaging tool box Background Colour Implantation Image Displaying
Paint 0-255 Yes No No Bitmap,JPG,GIF.. Edit colours button No
Blender 0-1.000 Yes Yes Yes Bitmap,JPG,GIF…>18 F5 material and colour button No
MATLAB 0-255 Yes Yes No No Property inspector Yes
Can change No Good
Can change F12, Rendering Good
Can change GUI, Run Better
3.3 Equipment The required equipment for the implementation of this system is listed below: 1. Desktop computer system support for: MATLAB and Image processing toolbox (2006b or later version) Microsoft Office 21
Irfanview image viewer tool 2. Internet access, printing and photocopy facilities. 3. Ocean Optics® HR2000™ Fibre-optic Spectrometer 4. Philips model 170 B4 CRT monitor
3.4 Research Method The candidate was given access to a general-purpose colorimeter based on the commercially-available HR 2000 fibre-optic spectrometer. This permitted the measurement of the spectral reflectance properties of the selected surface colour samples. The fibre-optic spectrometer was also used to obtain SPD measurements of selected test sources.
The following steps were completed in this research: 1. Design of a computer display model to display the colour rendering performance of different light sources. 2. Selection of representative test light sources. 3. SPD measurement for selected light sources or use of standard SPD tables. 4. Selection of representative test colour samples. 5. Spectral reflectance measurement of selected colour samples, or use of standard reflectance tables. 6. Use of existing models of colour appearance to predict the colour appearance of samples under the different light sources. 7. Display of the predicted colours as accurately as possible. 8. Use of the computer monitor model to display the predicted colours as accurately as possible. 9. Use of the displayed colours for visual assessment of the colour rendering performance of different sources. 10. Subjective assessment of the displayed colours by group of observers.
3.5 The Computer Interface Design Process After research and study of Matlab imaging processing [31, 32], the first designed VIS is displayed in Figure 3.1, it contains monitor set-up, Main GUI (colour-managed computer system) and Plot SPDs screens. Figure 3.2 illustrates the final designed VIS 22
interface that includes Main GUI, Plot SPDs, and Plot Reflectance, as well as Manual screens. The development of VIS is explained in this section.
Figure 3.1-The first version of VIS
Figure 3.2-Final version of VIS 23
The CMCDS (colour-managed computer display system) is the most important part of the VIS. It displays and compares the test colour charts under reference and test light sources. The development of CMCDS consisted of 6 versions. The first version of CMCDS displays the same four colour charts under difference light sources and their position is showing in Figure 3.3. Because this version only can display colour samples under four light sources, a second CMCDS version was designed.
Figure 3.3-The first version of CMCDS
Figure 3.4-Second version of CMCDS 24
Figure 3.4 shows a screenshot of the second version of CMCDS. In this version, the number of colour charts has been reduced to two in order to allow the user to view and compare the colour samples more clearly. It also allows the user to select a colour sample from a dropdown box to view an enlarged version of the colour sample on the display. Additionally, this version added two new features. The Display RGB button allows the user to view the RGB values of the displayed colour samples under the test light source with the selected gamma and offset K1 values. The Calculate RGB button calculates all the RGB values of the displayed colour samples in a set for the selected light source. The second version also contains six additional light sources that can be selected. The light sources are now selected from a dropdown box as opposed to the buttons in version 1. This feature matches the CMCDS easier for the user and was extruded to cover other features as they were added in later versions.
The second version also introduced an intuitive graphical user interface design to the CMCDS. It guides the user through the process of selecting options by displaying items in the order they need to be chosen in. For example, when version 2 of CMCDS is first opened, the user only sees the option to select a light source. Once they have chosen a light source, the lamp type option then becomes available. After a lamp type is selected, the OK button then appears. After the OK button is clicked versions other options become available and so on.
Figure 3.5-The third version of CMCDS 25
In the second version of CMCDS users had to manually enter the three RGB values for each of the 12 colour samples in a set. This process has to repeat each time a new light source was selected. Because of this, the third version of CMCDS (See Figure 3.5) has been developed to implement the test colour samples fully automatically. This version incorporates a database that containing 52 light sources, 46 of which are test illuminants and 6 are CIE standard illuminants. This version automatically displays the RGB values of the displayed colour samples under the selected light source.
Figure 3.6-The fourth version of CMCDS In order to display the colour samples accurately under difference light sources, a fourth version of the CMCDS was developed. Figure 3.6 shows the screenshot of this version. It contains an additional four features. These include: 1. The ability for a user to manually adjust the gamma and offset K1 values of the monitor from CMCDS. 2. The ability for the user to automatically calculate the colour rendering index and colour temperature of the selected light source by clicking the Ra button. 3. The ability for a user to automatically calculated the RGB values of the displayed colour samples under the selected light source by clicking Calculate RGB button.
26
The ability for a user to automatically plot the reflectances of the displayed colour samples on a graph.
Figure 3.7-The fifth version of CMS For demonstrations relating to the CIE colour rendering model, the fifth version of the CMCDS implements the 14 specified test colour samples which are published by the CIED (See Figure 3.7).
Figure 3.8-Final version of colour management system (CMS) 27
The final version of the CMCDS adds two neutral grey colours, in additional to the 14 CIE published colours added in the fifth version. These two colours will act as scalier when user compares different colour samples. The screenshot of the final version of CMCDS is shown in Figure 3.8.
3.6 Development of The Virtual Imaging System (VIS) In order to achieve the research objectives, the VIS has been designed by using of MATLAB GUI, the main structure of which is shown in Figure 3.9. The designed VIS contains three main components: SMS (spectral management system), CMCDS and RDS (reflectance display system). Additionally, four sub-systems are located in the colour-managed computer display system and they are named as monitor set-up, CMS (colour management system), CAM (colour appearance model) and CDM (colour difference model).
Three main modules in the final MATLAB GUI interface of VIS are called the Plot SPD_GUI (implement of SMS), Main GUI_GUI (implement of CMCDS) and Plot Reflectance _GUI (implement of RDS).
Spectral Management System(SMS) [Plot SPD_GUI]
Virtual Imaging System (VIS)
Colour-Managed Computer Display System (CMCDS) [Main GUI_GUI] Reflectance Display System (RDS) [Plot Reflectance_GUI]
Monitor Set-up Colour Management System (CMS) Colour Appearance Model (CAM) Colour Difference Model (based on CAM02)
Figure 3.9-Main structure of VIS Figure 3.10 explains the virtual prototyping system based on CIECAM02. To complete the final virtual imaging system, the user must first select display colour samples, followed by measuring the colour proprieties of test colour samples under different light 28
sources, then using the collected data and light source spectrum with the calibrated CRT monitor information to convert the colour version to compute RGB values of displaying colour samples, next step is to set up designed MATLAB GUI model to display colour samples. Finally, some necessary adjustment of design system is required before achieve the final system.
Figure 3.10-Virtual Prototyping system based on CIECAM02 [33] 3.6.1
Main GUI
The Main GUI contains the most important features of the application. It contains the selection of the test and reference light sources, calculation of the RGB values of the displayed colour samples, and calculating of the Ra and CCT values for the selected light source. It also provides links to plot the spectral power distribution of selected light sources and the spectral reflectance of the displayed colours, as well as incorporates features for monitor set-up and the CMCDS.
The CMCDS consists of five main features, they are monitor set-up (See Figure 3.11. ), select test light and reference light sources (See Figure 3.12), display test colour samples (See Figure 3.8), display colour rendering index (Ra) and correlated colour temperature ( TC ) values of each selected light sources (See Figure 3.12), calculate RGB values of the 16 displayed colour samples under selected illuminants (See Figure 3.14) and a link to the plot reflectance interface and the plot SPDs interface. For more
29
information about the development processing of the Main GUI can refer to the code in Appendix V.13.
Figure 3.11-Monitor Set-up Screen
Figure 3.12-Select light sources
Figure 3.13-Display Ra and Tc of selected light sources 30
Figure 3.14-Calculate RGB values of the displayed 16 colour samples under CIED65 3.6.1.1 Monitor Calibration GUI (Monitor Set-up) Monitor calibration is a very important and necessary step for the visual colour judgement of displayed colours. It was decided that this project would make use of CRT (cathode ray tube) monitors and the GOG (gain offsite gamma) model, as summarized in Equation (3.1). Users can choose computer gamma value (in the range 1.8 to 2.8) and offset K1 value (in the range 0.8 to 1.2) [34].
Ln K1Dn K2
(3.1)
Where Ln = normalized luminance of screen primary
Dn = normalized digital pixel value = monitor gamma K1 = monitor gain factor K2 = monitor offset And K1 + K2 = 1. Figure 3.11 shows the designed monitor set-up system, based on the GOG model. Figure 3.15 demonstrates that the same colour chart will look different with different K1 values even though the light source (CIE D65) gamma value (1.8). 31
Figure 3.15-Test images under CIED65 with gamma=1.8 and K1=1(left side), K1=1.2(right side) Two main functions used in MATLAB are gamma value (function rvalue) and K1 value function, which are created and called to receive and implement monitor gamma and offset K1 values automatically. And OK button was created to implement this feature. These codes are listing in Table 3.2 through to Table 3.4. For more information about the development processing of the Main GUI, refer to the code in Appendix V.13. Table 3.2-Gamma value function function rvalue_Callback(hObject, eventdata, handles) r=get(handles.rvalue,'string'); r = str2num(r); if (isempty(r) || r< 0 ) set(handles.rvalue,'Value',0);set(handles.rvalue,'String','0'); else set(handles.rvalue,'Value',r );end
Table 3.3-Offset K1 value function function k1value_Callback(hObject, eventdata, handles) k1=get(handles.k1value,'string');k1 = str2num(k1 ); if k1==0 errordlg('K1 can not be 0, please enter a new value'); else set(handles.k1value,'Value',k1 );end
Table 3.4-Gamma & K1 OK Button Function S_OK_Callback(hObject, eventdata, handles) set(handles.light_sources1,'visible','on'); set(handles.light_sources2,'visible','on');
32
3.6.1.2 Selection of Light Sources The designed VIS contains two light source selection menus. The illuminant database contains 52 illuminants [12, 35, 36].They were divided into the 7 groups as listed below: Group 1: CIE standard illuminants A, D65, C, D50, D55 and D75 Group 2: High pressure discharge lamps [Published in CIE15.3] HP1: Standard high pressure sodium lamp HP2: Colour enhanced high pressure sodium lamp HP3-5: Three types of high pressure metal halide lamps Group 3: Fluorescent lamps F1-12, published in CIE 15.2 as F1-F12 F1-6: standard F7-9: broad-band F10-12: narrow band fluorescent lamps Group 4: New set of fluorescent lamps [Published in CIE15.3] FL3.1-3: Standard halophosphate lamps FL3.4-6: DeLuxe type lamps FL3.7-8: Three band fluorescent lamps (A new set of fluorescent lamps) FL3.9-11: Three band fluorescent lamps FL3.12-14: Multi-band fluorescent lamps FL3.15: D65 simulator lamp Group 5: L.W research 3-, 4-, 5-, 6- and 7-BAND LEDs Group 6: Philips Mixed LED sources for Tc of 3016K, 4000K, 4100K, 5500K and 6500K and Luxeon white LED Group 7: New LED1, New LED 2, New LED 3 The illuminants in groups 1 to 4 are published in CIE publications [37]. According to research [36], the others are digitized from their SPDs for the range 380nm to 780nm at 5 nm intervals [32, 39]. The first group of the illuminants are standard CIE sources [38]. 3.6.1.3 Selection of Colour Samples for Display A set of colour samples, including 9 Munsell colours and 3 paint samples, was selected as the colour sample set for display at the beginning of this research. The 12 colour samples used were 5R 6/12, 5P6/8, 5PB6/10, 5B, 5BG6/6, 5G6/8, 5GY6/10, 5Y6/10, 5YR6/10, 8M6, 3PO, and 764. This colour sample set was measured and provided by Dr. Andrew N. Chalmers. (Refer to Appendix I.1) [27]. 33
Table 3.5-The displayed test colour samples
The final VIS compares a set of 16 surface colours as listed in Table 3.5. These are the 14 CIE test colours with the addition of two synthetic neutral grey colours. The spectral reflectances of the test colours are tabulated for the wavelength range 380 nm to 780 nm (See Appendix I.2). The completed source code used to display the 16 selected colour samples is listed in Appendix V.1 to Appendix V.3. 3.6.2
Colour Management System (CMS)
The VIS displays and compares two colour charts under about 46 test light sources with 6 reference light source and the colour chart is made of 16 test colour samples which contain 14 CIE specified test colours and two neutral grey colour samples.
34
Acquire Screen White and [R G B] Primaries
Compute the Display Matrix[M]
Input Monitor Transfer Function
―Gamma Linearize‖ by use of Monitor Transfer Function‖ [ R‘ G‘ B‘]=M[R G B]
Converter RGB to SRGB
Calculate the Colour to be Displayed Use of GOG Model Input Source and Reflectance Spectra
Converter SRGB to MATLAB RGB
Figure 3.16-Colour management and display process The conversion of the displaying colour samples is the major objective in design of the colour management system. Figure 3.16 explains the 6 steps of the conversion of the test colour samples and they are listed in steps 1 to 6. 1. Calibrate the CRT monitor to get primary screen RGB values of screen red, green and blue, as well as screen the white point. 2. Compute the matrix [M] by using of the achieved [R G B] primaries. 3. Calculate the displaying colours using the achieved matrix and input source. 4. Convert CIEXYZ to RGB by using the achieved results from the above steps. 5. Convert the RGB values of test colours to screen RGB values for each test colour sample using the GOG model. 6. Convert the screen RGB values to MATLAB displaying RGB to display the test colour samples. Equation (3.2) is used to calculate the CIE XYZ, with the reflectance factor of the samples which were measured at intervals of 5 nm from 380 nm to 780 nm. Where is the reflectance factor of the samples at the wavelength (Appendix I-1 contains all the reflectance of the selected 16 test colour samples), is the value of the spectral power distribution of illuminate at the wavelength , and x , y , z are CIE 1931 35
colour matching functions for the standard observer at the wavelength (and they are explained in Equation (3.2))
X
780nm
x
380nm
Y
780nm
(3.2)
y
380nm
Z
780nm
z
380nm
Appendixes (I-2) to (I-9) contain all the selected 52 light sources in this work which include ranges of fluorescent tubes and high-intensity discharge lamps. Additionally, a number of LED spectra have been measured at Manukau Institute of Technology (MIT) by use of an Ocean Optics® HR2000™ fiber-optic spectrometer. Other values were obtained from published commercial [41] and research sources [42, 43].
The next stage is the calibration of the CRT monitor to achieve the 3x3 matrix factor M. Two 170 B4 Philips CRT monitors were provided and calibrated in MIT. Steps 1 though to 4 are main steps in CRT monitor calibration. 1. Set up the computer system and spectrophotometer with running the Ocean Optics Spectra Suite software for about 6 hours 2. Use the spectrophotometer to measure the chromaticities x, y of the displays RGB primaries and white point. Ensure all the emission spectra of the display are between 380 nm to 780 nm. 3. Adjust the RGB primaries of the CRT monitor to achieve the best suitable chromaticity values. 4. Save the calibrated values. The results of two calibrated CRT monitors are displayed in Table 3.6 and Table 3.7. Table 3.6-Colour displays for CRT monitor
x y z Y
Red 0.5504 0.3504 0.0992 6.88
Green 0.2705 0.5955 0.134 13.48 36
Blue 0.1596 0.1413 0.6991 4.29
White 0.3123 0.3398 0.3479 23.01
Table 3.7-Colour displays for CRT monitor II Red
Green
Blue
White
x
0.5875
0.2746
0.1537
0.3173
y
0.3466
0.6129
0.1329
0.343
z
0.0659
0.111
0.7134
0.3398
Y
7.28
13.96
4.07
23.95
With use of the calibrated results from Table 3.6 and Table 3.7, the matrix of the coefficients used to calculate the display tristimulus values R, G, B from the CIE tristimulus values X, Y, Z can be computed by the use of Equations (3.3) through (3.6). Where
screen
xr yr zr
xb and yb zb
xg yg zg
white
point.
xw , yw , zw are the calibrated [x, y, z] results of primaries and the The
matrixes
of
the
calibrated
CRT
monitors
are
2.7288 1.1551 0.3727 2.8521 1.2038 0.4078 M 1 1.7193 2.7466 0.1626 and M 2 1.4563 2.4972 0.1515 They are 0.0090 0.2206 1.2405 0.0672 0.2600 1.2910
displayed in Table 3.8 [1]. xr yr zr
xg yg zg
xb Pr xw / yw yb Pg 1 zb Pb zw / yw
Pr xw / yw xr P 1 / y g r Pb zw / yw zr
xg yg zg
(3.3)
xb yb zb
(3.4)
X r Pr xr ; X g Pg x g ; X b Pb xb Yr Pr yr ; Yg Pg y g ; Yz Pb yb
(3.5)
Z r Pr zr ; Z g Pg z g ; Z b Pb zb Rx Ry M Gx Gy Bx By
Rz X r Gz Yr Bz Z r
Xg Yg Zg
Xb Yb Z b
1
(3.6)
Table 3.8-Matrix of calibrated CTR monitors I & II
R G B
x1 2.8521 -1.7193 -0.0672
y1 -0.4078 2.7466 -0.2600
z1 -0.323 -0.1626 1.2910 37
x2 2.7288 -1.4563 -0.0090
y2 -1.1551 2.4972 -0.2206
z2 -0.3727 -0.1515 1.2405
The next step is to convert CIE XYZ to RGB value by using Equation (3.7) and then use of the GOG (gain-offset-gamma) model to transfer the computed RGB values [R, G, B] to screen RGB values [SR, SG, SB]. In this situation, Equations (3.8) through (3.10) are used to calculate the final screen displaying RGB values, where r is the monitor setup gamma value, K1 is the monitor gain factor and K2 is the monitor offset. Normally, suitable gamma and offset K1 values are in the range of 1.8 to 2.8 and 0.8 to 1.2, additionally, K1+K2=1. R G [ M ] B
X Y Z
(3.7)
SR (r
R 255 K 2)( ) 255 K1
(3.8)
SG ( r
G 255 K 2)( ) 255 K1
(3.9)
SB ( r
B 255 K 2)( ) 255 K1
(3.10)
This means the virtual imaging system may not display colour samples 100% accurately because of data conversion errors. Figure 3.17 shows the calculation process and conversion equations required for conversion in colour display process. In this research, part of the SPDs ( ) of the test light sources and the reflectances ( ) of the displayed colour samples, x , y , z are obtained from the CIE publications [41] and research sources [42, 43] which are detailed in the above sections. For more data information can refer to Appendix (II-1) through (II-9). The last step is to convert screen [SR SG SB] to the values that can be readable by MATLAB [R G B]. Because of MATLAB can only read the RGB values of the displaying colour from 0 to 1, any inputted values outside this range will be automatically adjusted to 1 or 0. This means the virtual imaging system may not display colour samples 100% accurately because of data conversion errors.
Figure 3.17-Flow chart of the colour display model 38
3.6.2.1 Compute Ra and Tc of Light Sources To calculate Ra and Tc values, the CIE central bureau has provided two application software programs on a disk:
CIE13_3D.EXE is a program that calculates the spectral colour rendering indices and the general colour rendering index on an IBM or DOS compatible PC running DOS 3.2 or higher.
CIE13_3W.EXE is a modification of the above program to be run on an IBM PC 386 or 486 or compatible under MS-WINDOWS 3.1
This research decided to use of CIE CRI program to compute the general colour rendering index and colour temperature of the selected light sources. Figure 3.18 shows an example calculating the Ra and Tc values of L. W.4-Band LED light source using the CIE13_3W.EXE programme. Ra and Tc values of all selected light sources in this research project are computed using the same method.
Figure 3.18-CIE13_3D.EXE program 3.6.3
SPD Displaying GUI (Plot SPD_GUI)
This section describes the design and implementation process of the SPD Displaying system (Plot SPD_GUI). The VIS contains SPDs of displayed light sources. The Plot SPD_GUI interface allows the user to choose and compare any two of the selected light source SPDs. Once the user has selected two light sources to compare, the SPD GUI will plot the comparison of the SPDs in wavelengths between 380 nm and 780 nm at 5 nm intervals. All SPDs of illuminants are tabulated in Appendixes (II.1) though (II.8).
39
Figure 3.19 shows an example of a comparison of SPDs of two illuminants (F1 and CIED65) that are implemented by use of the Plot SPD_GUI. For more information about the SPD Displaying GUI work processing, refer to the code (in Appendix V.14).
Figure 3.19-Display Spectral Power Distributions of illuminants The user interface permits the user to select and display any two sources from the same database. To facilitate the comparisons of SPDs, all the test sources have been converted to the same power range and they have the same relative luminance value ( Yo =292.82), which is the value given in the tabulated SPDs for the CIE standard illuminants. 3.6.4
Reflectance Plotting GUI (Plot Re_GUI)
Appendix I.2 contains all reflectances of the 16 colour samples in the database for the wavelength range 380nm to 780nm. Figure 3.20 illustrates the reflectances of displayed colour samples that are plotted by use of this data. Table 3.9 shows the Matlab code fragment for this function. Figure 3.20 shows the spectral reflectances for the CIE CR test colour samples. The completed code can be found in Appendix V.15. Table 3.9-Plot reflectance function function Re_Callback(hObject, eventdata, handles) % hObject handle to Re (see GCBO) % eventdata reserved - to be defined in a future version of MATLAB % handles structure with handles and user data (see GUIDATA) set(handles.Reflection,'Visible','on'); axes(handles.Reflection); imshow('Samples.bmp');
40
Figure 3.20-Plot reflectance of 16 test colour samples
3.7 Summary A visual imaging system has successfully achieved the requirements of the research project. Figure 3.21 (a), (b), (c) and (d) are the four main user interfaces of the designed system, while (e) and (f) are the two main readout tables of the system.
The structure of the system is such that the SPD data for any new sources can easily be added to the data base, and their colour rendering performance computed and demonstrated. In a similar way, additional or alternative test colours can be added to the colour sample data-base as soon as their spectral reflectances have been measured.
41
(a)
(b)
(c)
(d)
(e)
(f)
Figure 3.21-MATLAB GUI system interface
42
4 SUBJECTIVE TESTING 4.1 Introduction This chapter details the subjective testing methods used during the testing phase of the virtual imaging system. Subjective testing was accomplished by human sight -- a group of observers who were selected to test the VIS were placed into three groups, each with a different test propose. The testing methods and results are detailed throughout the following section and the achieved results are explained at the end of the chapter.
4.2 Subjective Testing Method According to research into [44, 45] ―informal and formal subjective measurements have always been, and will continue be, used to evaluate system performance from the design lab to the operational environment. Even with all the excellent objective testing methods available today for analog and full-bandwidth digital video, it is important to have human observation of the pictures. There are impairments which are not easily measured yet are obvious to a human observer. This situation certainly has not changed with the addition of modern digital compression. Therefore, casual or informal subjective testing by a reasonably expert viewer remains an important part of system evaluation or monitoring.‖ Observers are viewed the developed VIS and it is their opinion of the colour display quality which is important.
In addition to the selection of the subjective testing method there are a number of other procedural elements for which alternate approaches are available. These are such things as: viewing conditions, choice of observers, scaling method to score the opinions, reference conditions, signal sources for the test scenes, timing of the presentation of the various test scenes, selection of a range of test scenes, and analysis of the resulting scores. 4.2.1
Observers
According to Peter G. Engeldrum [46] the number of observers to use in scaling studies is typically governed by availably. Scaling studies in the imaging area are conducted with as few as 4 observers, and with as many as 50. A range of 10 to 30 is recommended for a typical scaling application. This is not intended to be a rigid rule, 43
only a guideline. In this research, 21 non-expert observers have been selected and tested for their visual capabilities. The observers were shown a series of test scenes for about 10 to 30 minutes in a controlled environment and observers were divided into three groups according to different test purposes. In this quality of colour display test, 21 observers were selected. 4.2.2
Colour Vision Test
Every observer was given a colour blindness test before they started testing the VIS. To protect the privacy of all participants, these tests were taken individually. The test results showed that none of the observers selected suffer from colour vision deficiencies. 4.2.3
Colour Displays Test
All Participants were divided into three groups with different test proposes: 1. Group I (five people) tests the monitor set-up system which is contained in VIS and colour displayed by a range of light sources (including new research LEDs). 2. Group II (ten people) tests the developed CMS. 3. Group III (six people) uses the designed VIS to test the author‘s proposed ―rules of colour rendering properties‖.
Figure 4.1-Test image shown to Group I 44
4.2.3.1 Group I (5 Observers) 60 Minutes Observers in Group I viewed the fully developed VIS to compare the colour sample charts under 46 light sources with 5 reference sources (CIE Illuminants A, D50, D55, D65 and D75), and they gave score of the quality of each test colour sample on colour char. In the interests of simplicity and brevity in the subjective testing procedure, the test source and reference source do not always have the identical CCT. However, in each instance, the closest available reference is chosen from the above mentioned subset of CIE illuminants. This process took approximately 60 minutes per observer. Figure 4.1 shows a sample of an image shown to Group I.
There are two main purposes for the observers in Group I, they are to test the designed colour management system (especially the Monitor Set-up system) is working normally and to test light sources (especially the research LEDs) are provide good colour rendering.
To start the test, the calibrated Philips 170 B4 CRT monitor displaying the developed VIS was provided, question sheet S1 was used for part I for the test and question sheet S2 was used for part II of the test. In part I, participants gave a score for each displayed colour under test light source compared with its reference source. The test method and processes are listed as below: 1. Run the VIS, keep the reference light source (CIE Illuminant D65) on the LEFT side of the monitor and keep the test light source (CIE Illuminant D65) on the RIGHT side of the monitor, select a gamma
value=2.0 and a K1 value=1.0 to
view the two compared colour images. 2. Run the VIS, keep the test light source (CIE Illuminant D65) on the RIGHT side of the monitor and keep the reference light source (CIE Illuminant D65) on the LEFT side of the monitor, then choose different gamma
values (between 1.8
to 2.8) at an 0.1 interval with K1=1.0. Participants compared the displayed colour chart with reference light source and gave a score between +5 (best) to -5 (poorest) (See Appendix IV.1). 3. Keep the test light source (CIE Illuminant D65) on the RIGHT side of the monitor and keep the reference light source (CIE Illuminant D65) on the LEFT side of the monitor, then choose different K1 values (between 0.8 to 1.2) at 0.1 intervals with best gamma (selected by step 2) to compare the displayed colour 45
charts with reference light source and given score in 11 step grade, +5 to -5 scale labelled: best to poorest (See Appendix IV.1). 4. Determine the best results for gamma
and offset K1 values.
5. Keep reference light source (CIE Illuminant D65) on the LEFT side of the monitor under the ―best gamma and offset K1‖ values obtained in step 4.
Part II of the test has been done by 5 observers from Group I. They viewed and compared the 16 displayed colour samples under the 46 test light sources with 5 reference light sources. The differences between the colour samples were scored using the adjectival method to define ―best‖ to ―worst‖. Participants scored on a 7 step scale of +3 to -3 (+3 being best and -3 being worst). The total score of colour samples under all test light sources has been calculated and the average scores of the test light sources from Part II of the test have been calculated and analysed.
According to the CIE method calculates Ra by comparing the colour samples under the test light source with reference light source at the same Tc , the test light sources were separated into 5 groups referenced to their closest available Tc . The selected 5 reference light sources include CIE Illuminants A, D50, D55, D65 and D75.
Table 4.1 displays the grouped test light sources for Group I (More information in Appendix IV.2). Table 4.1-Sources in groups based on their colour temperature Sources Compatible with Illuminant A
Reference Test Sources Illuminant CIE A HP1 HP2 LW4BANDLED LW5BANDLED LW6BANDLED LW7BANDLED HP3 F3 F4 F12 FL3.1 FL3.2 FL3.4 FL3.7 FL3.12 46
Illuminant D50
CIE D50
Illuminant D55
D55
Illuminant D65
D65
Illuminant D755
D75
FL3.13 PM3016K LED3 F2 F6 F8 F9 F10 F11 FL3.5 FL3.6 FL3.8 FL3.9 FL3.10 FL3.14 HP4 HP5 PM4000K PM4100K FL3.11 PM5500K LuxenWhiteLED F1 F5 F7 FL3.3 FL3.15 PM6500K LED1 LED2 LW3BANDLED
4.2.3.2 Group II (10 Observers) 30 Minutes 10 observers in Group II viewed and compared the displayed colour charts under 20 selected light sources in comparisons with three CIE standard illuminants as reference sources using the same method as the test in part II of Group I‘s test. The gamma
and
offset K1 values in the monitor colour management test were using the achieved results of Part I of Group I‘s test ( =2.1 and K1=1.0). In order not to influence the observers‘ opinions, the observers in Group II were given no specific information concerning the test and reference light sources. The VIS was run by researcher, and observers only gave scores for each displayed colour comparison. Table 4.2 shows the score sheet used for Group II, where M1 to M20 refer to the selected 20 light sources from Group I. Those 20 light sources are selected because of they are achieved the higher score than others in Group I‘s test. The headers for columns 3 to 18 give the Munsell hues of 16 displayed colour samples. 47
The test processes for Group II are outlined below. 1. Use the pre-selected gamma and K1 values throughout the test. 2. Keep reference light sources on the LEFT side of the VIS screen. 3. Keep the test light source on the RIGHT side of the VIS screen. 4. Compare the 16 displayed colour samples on the colour charts under the test and reference light sources. The differences between colour samples are scored using the adjectival method. Participants rate the samples on a 7 grade scale, +3 to -3 (+3 being best and -3 being worst) (See Appendix IV.3). 5. Change reference and test light sources then repeat the steps 2 to 4. 6. Calculate the scores for each colour sample under each test light source, by finding the algebraic sum and the total magnitude of scored differences.
48
Table 4.2-Question sheet for Group II Re
Test
CIE Illuminant A
M1
7.5R
5Y
5GY
2.5G
10BG
5PB
2.5P
M2 M3 M4 M5 M6 M7 M8 M9 M10 M11 CIE D50
Illuminant
M12 M13 M14 M15 M16 M17
CIE D65
Illuminant
M18 M19 M20
49
10P
4.5R
5Y8/10
4.5G
3PB
5YR
5GY4/4
DG
LG
4.2.3.3 Group III (6 Observers) 15 Minutes The main purpose of Group III was to test two hypotheses expressed in the following ―two rules of colour rendering properties‖ proposed by the author. 1. The displayed colour sample looks ―better‖ under a test light source with a larger Ra value when the test and reference light sources are at the same Tc . 2. The displayed colour sample looks ―better‖ under a test light source with a higher Tc when the test and reference light sources have the same Ra. Table 4.3 lists all the test light sources and reference light sources used for Group III. Table 4.3 (a) is based on the test light sources that have the same (or very close) Tc as the reference light sources while Table 4.3 (b) is based on the test light sources that have the same Ra with reference light sources. The test method and processes of Group III are same as those used on Group II. Table 4.3Table 4.3-Question sheet for Group III. (a)Light sources grouped by their colour temperatures. Reference Illuminants D50 D50 D50 D55 D65 D65 PM4000K PM4000K F12 F12
Test Illuminants F8 F10 FL3.10 PM5500K F7 FL3.15 F11 HP4 PM3016K FL3.12
Nominal Colour Temperature (K) 5000 5000 5000 5500 6500 6500 4000 4000 3016 2984
Colour rendering index (Ra) 95 81 88 86 90 98 83 74 77 93
(b) Light sources grouped based on Ra Reference Illuminants F9 F12 F12 F12
Test Illuminants F7 F11 HP2 HP3
Colour rendering index (Ra) 90 83 83 83
50
Nominal Colour Temperature (K) 6500 4000 2506 3144
4.3 Test Results As detailed above, the VIS has been tested by 21 observers in three groups. Each group tests a different performance feature of the designed VIS. The results achieved by observers in three different groups are detailed in this section. 4.3.1
Test Results from Group I
Two tests were performed by Group I subjects. In test part I, 5 observers have done the monitor set up window test to select the best values of gamma and offset K1 for the displayed CRT monitor. One observer has done this test twice in order to get the best gamma value, and the achieved 6 results are listed in Table 4.4. The results show about 84% of people believe the designed VIS displays the best colour images under offset K1=1, however, every observer selected a different a gamma value. One explanation for this is the gamma value just slightly changes the displayed colours compared with the offset K1 value. Because of this, is much harder for human eyes to distinguish the colour differences. The test results also show that the displayed colours look much darker with a lower gamma value, whereas, the displayed colour samples looks much darker with higher offset K1 value. From the Table 4.4, the average gamma value =2.1 and the average offset K1 values=1. Those values are selected as a standard pair of settings for
and K1 for all observers in part II test to use. Table 4.4-Test results of monitor set-up
Gamma K1
Test 1 1.8 1
Test 2 1.9 1.1
Test 3 2 1
Test 4 2.1 1
Test 5 2.2 1
Test 6 2.6 1
In test part II, 5 observers were selected to view and compare the displayed colour samples under test illuminants with reference illuminants implemented by VIS. 46 test light sources were compared with 5 CIE standard light sources, which means the test light sources were grouped with the same (or a very close) colour temperature Tc to the reference illuminants (CIE Illuminants A, D50, D55, D65 and D75).
51
Table 4.5-Test results from Group I
Reference Illuminants A
D50
D55
D65
D75
Test Illuminants HP1 HP2 4BAND 5BAND 6BAND 7BAND HP3 F3 F4 F12 FL3.1 FL3.2 FL3.4 FL3.7 FL3.12 FL3.13 PM3016 LED3 F2 F6 F8 F9 F10 F11 FL3.5 FL3.6 FL3.8 FL3.9 FL3.10 FL3.14 HP4 HP5 PM4000 PM4100 FL3.11 PM5500 WHITELED F1 F5 F7 FL3.3 FL3.15 PM6500K LED1 LED2 3BAND
T
Test 1 M
-40 -12 16 8 -4 4 8 12 -16 -12 -20 16 -4 -12 4 20 13 0 -16 -20 0 -12 -12 -16 -12 0 -20 -16 -12 0 -20 -12 -4 -11 -28 -16 -19 -12 -16 -1 -15 0 -29 -32 -36 -24
40 20 16 16 12 20 8 12 24 12 20 16 12 12 4 20 13 0 16 20 0 12 12 16 12 0 20 16 12 0 20 12 12 13 28 18 17 12 16 1 15 0 29 34 36 24
T
Test 2 M
-48 -47 40 26 21 -3 -4 -7 -17 -4 -9 14 -9 -9 -1 18 9 -1 -39 -31 -8 -24 -16 -25 -26 -20 -30 -22 -9 -7 -33 -32 -17 -28 -48 -48 -31 -4 -4 -7 -9 0 -48 -42 -48 -34
T
48 47 40 26 21 19 10 17 23 10 17 16 9 15 1 20 13 3 39 31 8 24 16 25 26 20 30 22 9 7 33 32 17 28 48 48 31 8 8 8 13 0 48 42 48 34
Test 3 M
-35 -13 -4 -2 -2 -10 -1 -8 -11 0 -12 -3 -10 -7 -5 -11 -1 -4
35 17 14 10 10 18 11 12 19 10 20 14 20 13 5 13 13 8
-3 -9 -8 -9 0 -1 -10 -7 -6 -5 -14 -10 -5 -10 -14 -17 -17 -7 -9 -6 -5 -1 -32 -28 -29 -20
7 13 15 12 10 3 16 13 10 5 20 14 11 16 18 23 21 11 17 8 15 3 32 30 31 20
T
Test 4 M
-42 -21 22 6 6 2 0 -4 -4 -4 -4 -4 -4 -4 0 23 8 0 -30 -30 0 -14 -16 -16 -16 -16 -32 -48 -32 0 -32 -16 -16 -32 -48 -48 -48 -16 -16 -16 -32 0 -48 -48 -48 -48
42 21 26 10 10 10 2 6 6 6 6 6 6 6 0 25 10 0 30 30 0 16 16 16 16 16 32 48 32 0 32 16 16 32 48 48 48 16 16 16 32 0 48 48 48 48
T
Test 5 M
-38 -29 40 45 45 30 -16 -32 -48 -48 -48 16 -32 -16 0 32 32 -16 -32 -48 -15 -32 -16 -32 -32 -16 -32 -16 -16 -16 -48 -32 -32 -48 -48 -48 -48 -48 -48 -16 -48 -12 -48 -48 -48 -48
38 29 40 45 45 30 16 32 48 48 48 16 32 16 0 32 32 16 32 48 15 32 16 32 32 16 32 16 16 16 48 32 32 48 48 48 48 48 48 48 48 16 48 48 48 48
Average AT AM -40.6 -24.4 22.8 16.6 13.2 4.6 -2.6 -7.8 -19.2 -13.6 -18.6 7.8 -11.8 -9.6 -0.4 16.4 12.2 -4.2 -23.4 -25.8 -5.2 -18.2 -13.6 -19.6 -17.2 -10.6 -24.8 -21.8 -15 -5.6 -29.4 -20.4 -14.8 -25.8 -37.2 -35.4 -32.6 -17.4 -18.6 -9.2 -21.8 -2.6 -41 -39.6 -41.8 -34.8
40.6 26.8 27.2 21.4 19.6 19.4 9.4 15.8 24 17.2 22.2 13.6 15.8 12.4 2 22 16.2 5.4 23.4 25.8 6 19.4 15 20.2 19.2 11 26 23 15.8 5.6 30.6 21.2 17.6 27.4 38 37 33 19 21 16.2 24.6 3.8 41 40.4 42.2 34.8
Based on the results displayed in Table 4.5, the obtained outcomes in Group (I) are as follows: 1. In light source group CIE A, Figure 4.2 shows L.W.4-, 5-, 6-, and 7-Band LEDs, FL3.13 PM3016 LED and FL3.2 achieved much higher Average Total (AT) scores than other illiminants (See Table 4.6). 52
Reference CIE A
30 20 10
HP1
HP2
F4
FL3.1
F12
FL3.4
FL3.7
F3
HP3
FL3.12
7BAND
FL3.2
PM3016
5BAND
6BAND
-20
FL3.13
-10
4BAND
0
-30 -40 -50
Figure 4.2-Group I total score for reference illuminants CIE A Table 4.5 illustrates the test results from Group I, where T and M refer to the Total (algebraic) and Magnitude score of the colour differences samples. According to the CIE recommended calculation method for Ra (detailed in Chapter 1), Ra can be calculated by use of Equations (4.1) and (4.2), and the Ei (colour difference) in Equation (4.1) refers to the rms Magnitude of the test results. It is can be seen that at the same colour temperature ( Tc ), if Ei value increases, the Ri value will decrease and therefore, the value for Ra will decrease. Similarly, when comparing colour samples under two light sources at the same Tc , the test light source with a larger M (magnitude) should have a smaller Ra value and the colour images under such light source will look better than the colour images under light source with a smaller M [1, 34]. T T1 T2 ... Tn
(4.1)
M T1 T2 ... Tn
(4.2)
Ri 100 4.6Ei
(4.3)
Ra
1 8 Ri 8 i 1
(4.4)
At the same time, when comparing the displayed colour samples under two light sources at the same Tc , the light source with a larger T value should have a larger Ra value, and as a result the displayed colour samples under such light source will look better than the displayed colour samples under light source with a smaller T value.
53
Based on the results displayed in Table 4.5, the obtained outcomes in Group (I) are as follows:
2. In light source group CIE A, Figure 4.2 shows L.W.4-, 5-, 6-, and 7-Band LEDs, FL3.13 PM3016 LED and FL3.2 achieved much higher Average Total (AT) scores than other illiminants (See Table 4.6).
Figure 4.2-Group I total score for reference illuminants CIE A
3. Table 4.6 displays the rank of the test light sources in reference to the CIE illuminant A group. The Rank1 column displays the rank that the illuminants achieved based on their Tc and Ra, while the Rank2 column displays the rank of the test light sources by referring their AT and AM. Table 4.6-Rank table for light sources compared with CIE Illuminat A Test Illuminants 4BAND FL3.13 6BAND 5BAND PM3016 FL3.2 7BAND FL3.12 HP3 F3 FL3.7 FL3.4 F12 FL3.1 F4 HP2 HP1
Tc (K) 3848 3896 3478 3457 3016 3965 3492 2984 3144 3450 2979 2904 3000 2932 2940 2506 1959
Average Total(AT)
Average Magnitude(AM)
Rank1
Rank2
Ra from CIE CRI Program
22.8 20.8 16.6 13.2 12.2 7.8 4.6 -0.4 -2.6 -7.8 -9.6 -11.8 -13.6 -18.6 -19.2 -24.4 -40.6
27.2 22 21.4 19.6 16.2 13.6 19.4 2 9.4 15.8 12.4 15.8 17.2 22.2 24 26.8 40.6
1 2 3 4 5 6 7 8 9 10 11 12 13 14 15 16 17
1 2 3 4 5 6 7 8 9 10 11 12 13 14 15 16 17
95 96 94 94 77 70 92 93 83 57 82 87 83 51 51 83 8
4. Figure 4.3 displays the rank of the illuminants (Rank1, blue) is same as the rank of the tested light sources (Rank2, red) in group CIE illuminant A. 54
Figure 4.3-Ranking of illuminants in Group CIE A 5. Table 4.7 explains the rank of the test light sources in reference to the CIE D50 group. In this table, the Tc and Ra were calculated using CIE CRI program [48]. AT and AM columns refer to the test average total and magnitude scores respectively in Group I. The Rank1 column displays the rank of the illuminants which was achieved based on their Tc and Ra, while the Rank2 column displays the rank of the test light sources from their AT and AM. Table 4.7-Rank table for light sources compared with CIE Illuminant D50 Test Illuminants
(K)
FL3.14 LED3 F8 FL3.6 F10 PM4000 FL3.10 FL3.5 F9 F11 HP5 FL3.9 FL3.8 PM4100 HP4 F2 F6
5045 4998 5000 4894 5000 4000 5000 4086 4150 4000 4039 4853 4006 4100 4002 4230 4150
Tc
Average Total (AT) -1.4 -4.2 -5.4 -10.6 -13.6 -14.8 -15 -17.2 -18.2 -19.6 -20.4 -21.8 -24.8 -25.8 -29.4 -31 -31.8
Average Magnitude (AM) 1.4 5.4 6.2 11 15 17.6 15.8 19.2 19.4 20.2 21.2 23 26 27.4 30.6 31 31.8
Rank1
Rank2
1 2 3 4 5 6 7 8 9 10 11 12 13 14 15 16 17
1 2 3 4 5 6 7 8 9 10 11 12 13 14 15 16 17
Ra from CIE CRI Program 95 93 95 96 81 88 88 95 90 83 87 79 79 90 74 64 59
6. Figure 4.4 displays the rank of the tested light sources (Rank2, red) verses the rank of the illuminants (Rank1, blue) (calculated by CIE CRI program) in group CIE illuminant D50. Figure 4.5 shows the AT values of illuminants (new LED 3, 55
FL3.14 and F8) are much larger than other light sources in the same group. Four light sources (New LED3, FL3.14, F8 and FL3.10) have larger AT values at the same (or very close) Tc were selected for Group II to test.
Figure 4.4-Ranking of illuminants in Group CIE D50
Figure 4.5-Group I average magnitude for illuminants in group CIE D50 7. 8. Table 4.8 lists the rank of the illuminants in group CIE D65, the best four light sources (which have large AT and smaller AM values) were selected for Group II to test. They are FL3.15, F7, F1 and F5. 56
Table 4.8-Rank table for light sources compared with CIE D65 Test Illuminants FL3.15 F7 F1 F5 FL3.3 PM6500K
Average Total
Average Magnitude
Rank
-2.6 -9.2 -17.4 -18.6 -21.8 -41
3.8 16.2 19 21 24.6 41
1 2 3 4 5 6
Ra from CIE CRI Program 98 90 76 72 72 73
9. No light source have been selected from groups CIE Illuminants D55 and D75, because all light sources in these groups display very poor colour rendering. 4.3.2
Test Results from Group II
The results obtained from Group I show that the rank of the light sources which was achieved based on their Tc and Ra values match the rank of the light sources from their AT and AM. This means the designed VIS works properly. However, the testing time for each observer is takes 1 hour. In order to save observers‗ time and to test the VIS more fully, a shorter Group II test has been devised. In this test, 10 observers tested the selected 20 light sources using the same method as Group I observers did in part II. Table 4.9-9 displays the test results obtained from Group II.
Table 4.10 shows that the test light sources in each Tc group in Group II obtained the same rank as in Group I with the exception of the L.W. 5-Band LED and L.W.6-Band LED. However, the AT and AM values of these two light sources are very close (11.9 Vs 10.6, 12.9 Vs 12.6). Because both of these light sources have the same colour rendering index (Ra=94) and a very close (3457K and 3478K), it is very hard for subjects to tell the difference between them. The results obtained from Group II are very consistent with the results achieved by Group I. Therefore, the VIS has successfully achieved the implementation of a combination of computer graphics and processing to generate displays that aid in the visualization of the colour rendering properties of a range of light sources, including the new generation of high-output LEDs.
57
Table 4.9- Test results from Group I
Reference A
D50
D65
Test L.W 4BAND L.W 5BAND L.W 6BAND L.W 7BAND HP3 FL3.2 FL3.7 FL3.12 FL3.13 F12 PM3016 LED3 F8 F9 FL3.10 FL3.14 F1 F5 F7
Test 1
Test 2
Test 3
Test 4
Test 5
Test 6
Test 7
Test 8
Test 9
Test 10
T 25
M 25
T 22
M 24
T 18
M 18
T 16
M 16
T 20
M 20
T 22
M 22
T 22
M 22
T 16
M 16
T 22
M 24
T 16
M 20
12
12
10
12
15
15
4
4
14
14
12
14
16
18
8
8
14
16
14
16
12
12
10
12
15
15
4
4
14
14
12
14
7
9
1
15
15
17
16
14
2
8
4
10
17
18
2
12
7
13
12
20
7
9
5
9
4
14
-2
27
3 5 4 3 12 0 4 0 -2 -16 -4 -3 0 -4 -3
7 7 9 38 12 0 4 0 2 16 4 3 0 4 3
3 4 -10 0 15 -4 7 -3 -2 -14 -1 0 -9 -12 -3
5 8 10 2 17 6 7 3 2 14 3 0 11 14 3
1 8 1 1 10 0 8 -3 0 -7 -2 0 3 3 0
1 8 3 1 10 2 8 3 0 7 6 0 7 7 0
2 3 1 2 11 3 5 -1 -4 -14 -8 -4 -5 -10 -11
6 5 7 6 11 7 7 7 8 16 12 8 15 12 13
3 3 -1 3 13 2 8 3 -6 -9 -2 0 -2 -4 -4
3 5 9 3 13 2 8 11 6 9 4 0 10 8 11
1 8 -7 0 21 3 5 6 -6 -18 -3 0 -7 -7 -6
7 14 13 0 21 7 7 8 8 20 7 0 11 11 6
5 6 -6 0 20 0 8 -1 0 -16 0 0 -6 -4 -1
7 14 10 0 20 6 12 1 0 16 0 0 10 14 5
-3 6 -1 1 22 -6 14 -3 -5 -23 -10 1 -12 -8 -4
11 8 11 1 22 14 14 7 9 23 14 1 16 4 17
4 10 -3 0 14 -5 14 -3 -2 -13 -10 1 -11 -14 -3
8 14 7 0 16 14 14 3 2 13 10 1 11 14 3
-6 8 -3 1 27 -6 -4 -2 4 -16 2 0 -12 -3 -4
15 20 19 5 29 14 4 6 14 16 10 8 16 15 4
58
Table 4.10-Comparison table of test light sources in Group I & II (a)Light sources consistent with CIE Illuminant A Source Compatible With Illuminant A
Reference Illuminant CIE-A CIE-A CIE-A CIE-A CIE-A CIE-A CIE-A CIE-A CIE-A CIE-A CIE-A
Test Sources L.W.4-Band LED FL3.13 L.W.5-Band LED L.W.6-Band LED PM3016 FL3.2 L.W.7-Band LED HP3 FL3.12 F12 FL3.7
Average Total(AT) (Group II) 19.9 16.5 11.9 10.6 6.9 6.1 5.8 1.3 1.1 -1.3 -2.5
AverageMagnitude (AM) (Group II) 20.7 17.1 12.9 12.6 8.5 10.3 14 7 5.6 7.2 9.8
Rank Group II 1 2 3 4 5 6 7 8 9 10 11
in
Rank Group I 1 2 4 3 5 6 7 8 9 10 11
in
(b)Light sources consistent with CIE Illuminant D50 Source Compatible With Illuminant D50
Reference Illuminant CIE-D50 CIE-D50 CIE-D50 CIE-D50 CIE-D50
Test Sources FL3.14 L.W.3-Band LED F8 FL3.10 F9
Average Total(AT) (Group II) -0.5 -0.7 -2.3 -3.8 -14.6
Average Magnitude (AM) (Group II) 2.1 4.9 5.1 7 15
Rank in Group II 1 2 3 4 5
Rank in Group I 1 2 3 4 5
Rank in Group II
Rank in Group I
1 2 3 4
1 2 3 4
(c)Light sources consistent with CIE Illuminant D65 Source Compatible With Illuminant D65
Reference Illuminant CIE-D65 CIE-D65 CIE-D65 CIE-D65
Test Sources FL3.15 F7 F1 F5
Average Total (AT) (Group II) -4.6 -4.9 -6.1 -6.3
59
Average Magnitude (AM) (Group II) 6.1 7.1 10.7 10.3
4.3.3
Test Results from Group III
The methods used to analyses the test results from Group III are outlined below: 1. Compare the displayed colour samples under the reference light source with the test light source at the same colour temperature ( Tc ) but having a different colour rendering index ( Ra ) 2. Compare the displayed colour samples under the reference light source with the test light source having the same Ra , but different Tc . Table 4.11 displays the results for the Tc and Ra values of the selected light sources in Group III. These were calculated using the CIE‘s CRI calculator (program) [48]. According to this table, the selected 15 test light sources were grouped as outlined below: 1) HP3, FL3.12 and PM3016 were compared with F12 (at the same Tc =3000K) 2) F11 and HP4 were compared with PM4000K LED (at the same Tc =4000K) 3) F8, FL3.10 and F10 were compared with CIED50 (at the same Tc =5000K) 4) PM5500K LED was compared with CIED55 (at the same Tc =5500K) 5) FL3.15 and F7 were compared with CIED65 (at the same Tc =6500K) 6) F7 was compared with F9, having the same Ra (90) but different Tc (6500K Vs 4150K) 7) HP2 and F11 were compared with F12, having the same Ra (83) but different
Tc values (4000K, 2506K, 3000K). Table 4.11-Ra and Tc of light sources in Group III evaluations Lamp F12 FL3.12 HP3 PM4000K F11 HP4 D50 F8 FL3.10 F10 D55 PM5500K D65 FL3.15 F7 PM3016K HP2 F9
Correlated colour temperature (Tcp) (Kelvin) 3000 2984 3144 4000 4000 4002 5002 5000 5000 5000 5503 5500 6505 6509 6500 3016 2506 4150
60
General colour rendering index (Ra) 83 93 74 88 83 74 100 95 88 81 100 86 100 98 90 77 83 90
8) Table 4.12 (a) compares the calculated Ra of the illumiants under the same Tc and rank are based on their Ra value while Table 4.12 (b) compares the illuminants under the same calculated Ra but with a different Tc . Table 4.12-Illuminants ranking table (a)Lamps grouped according to Tc Tcp 3000K 3000K 3000K
Lamp FL3.12 F12 PM3016K
Ra 93 83 77
Rank 1 2 3
4000K 4000K 4000K
PM4000K F11 HP4
88 83 74
1 2 3
5000K 5000K 5000K 5000K
D50 F8 FL3.10 F10
100 95 88 81
1 2 3 4
5500K 5500K
D55 PM5500K
100 86
1 2
6500K 6500K 6500K
D65 FL3.15 F7
100 98 90
1 2 3
(b)Lamps grouped by their Ra Ra 83 83 83
Lamp PM4000K F11 HP2
Rank 1 2 3
90 90
F7 F9
1 2
Table 4.13 shows the scores obtained from Group III, where T and M refer to the Total and Magnitude score of the displayed colour samples under the test light sources and AT and AM refer to the Average Total and Magnitude score of the displayed colour samples in Group III. The test colour samples were compared against reference sources at the same Tc . Hence the AM values show inverse correlation with Ra.
61
Table 4.13-Test results by Group III
Reference D50
D55 D65 F9 F12
PM4000 F8
Test F8 FL3.10 F10 PM5500 FL3.15 F7 F7 F11 PM3016 HP3 FL3.12 HP2 F11 HP4
Ra 95 88 81 86 98 90 90 83 77 74 93 83 83 74
Test 1 T M -3 7 -4 4 -6 10 -38 38 0 0 -3 3 36 38 11 13 9 11 2 4 2 2 -6 8 -16 16 -18 18
Test 2 T M -5 9 -6 8 -17 17 -24 24 0 0 -6 6 25 25 13 13 10 16 -2 4 2 2 -2 2 -15 21 -20 20
Test 3 T M 1 3 -2 8 -6 10 -48 48 0 6 -2 2 16 16 16 16 8 10 -2 3 3 2 -3 3 -10 10 -13 13
Test 4 T M -8 16 -14 18 -15 25 -25 27 -5 11 0 13 21 25 -6 24 4 26 4 14 0 18 8 20 13 25 0 28
Test 5 T M -1 3 -3 8 -6 10 -27 48 -2 6 -3 2 11 16 17 10 5 16 -1 3 -5 2 -12 3 -7 10 -6 13
Test 6 T M -2 2 -3 3 -13 13 -7 13 0 4 -1 5 12 14 4 4 6 8 0 0 2 2 -5 5 -12 14 -13 15
Average AT AM -3.0 6.7 -5.3 8.2 -10.5 14.2 -28.2 33.0 -1.2 4.5 -2.5 5.2 20.2 22.3 9.2 13.3 7.0 14.5 0.2 4.7 0.7 4.7 -3.3 6.8 -7.8 16.0 -11.7 17.8
FL3.10
88
-2
-4
-2
-3
-1
-1
-2.2
2
4
62
2
13
2
-1
3.7
Tc Group D50 AT, AM
20 15 10 5
AT
0 -5 80
85
90
95
AM
100
-10 -15
Ra Figure 4.6 – Tc Group D50
Tc Group D65 6 4
AT,AM
2
AT
0 -2
88
90
92
-4
94
96
98
100
AM
Ra Figure 4.7 – Tc Group D65
Tc Group PM4000 20 15
AT,AM
10 5
AT
0 -5 72
74
76
78
80
82
84
-10 -15
Ra Figure 4.8 – Tc Group PM4000 63
AM
Figures 4.6 to 4.8 compare the relationship between AT, AM and Ra of the tested light sources in each colour temperature group. The results show that AM value of the light source decreases when Ra value increases while the AT value increases when the Ra value increases. The following two rules have been proved: Rule 1: The displayed colour sample looks ―better‖ under a test light source with a larger Ra value when the test and reference light sources are at the sameTc . Rule 2: The displayed colour sample looks ―better‖ under a test light source with a higher Tc when the test and reference light sources have the same Ra. Rule 1 has been proved by the data given in Table 4.12 (a) and diagrams plotted in Figures 4.6 to 4.8. When comparing colour samples under two light sources at the same Tc, the test light sources with larger T (total) value should have a larger Ra value and the colour images under such light source will look better than the same colour images under light source with smaller T value. In the same situation, the test light source with smaller M (magnitude) should have a larger Ra value and the colour images under such light source will look better than the same colour images under light source with larger M value.
Rule 2 has been proved by the data given in Table 4.12 (b). It is true that this only a small data set; however, it is difficult to identify sources with different colour temperatures that have the same CRI.
64
5 OBJECTIVE TESTING 5.1 Introduction This chapter describes the objective testing of the VIS. The main task of the objective testing was to compute the colour appearance difference of the compared two colour samples. The colour appearance difference has been achieved from the file values and the measurements. The file values are based on CIECAM02 model and the measurements are completed with a spectrophotometer. The test method and the achieved results are detailed in this chapter.
5.2 Objective Testing Method The objective testing includes two different test methods, one was to compute the colour difference of the displayed colour samples from the RGB values in their data files, the other was to measure and calculate the colour difference between two displayed colour samples on the monitor using the Ocean Optics HR 2000 spectrophotometer. In both cases, the results were to be computed using the CIECAM02 model. Test methods and processes are detailed in this section. 5.2.1
CIECAM02 Model
As described in Chapter 3, the system will normally be holding the [R‘, G‘, B‘] values for each of the sample colours being displayed. These colours are computed separately for both the test and reference sources. The opportunity therefore exists to calculate the colour differences between corresponding pairs of samples being displayed for the two different sources. Figure 5.1 illustrates these steps. Test Light Source Selected from Database Apply Equations to Colour Samples Selected Repeat for Different Source Compute Colour Differences
Figure 5.1-Colour difference computation model 65
Table 5.1 lists the 15 light sources that have been selected to compare with the four reference light sources grouped according to their Tc . The colour appearance difference from file values for samples under these light source pairs has been computed using the CIECAMO2 model. The following sources listed in Table 5.1 were chosen to provide illustrations of the calculation method. Table 5.1-Sources used in colour appearance difference computation Reference Illuminant CIE-A
PM4000K
CIE-D50
CIE-D65
5.2.2
Test Sources F12 FL3.7 FL3.4 PM3016K F4 F11 FL3.8 HP4 F8 FL3.10 F10 FL3.15 F7 F1 F5
Nominal Tc (K) 3000 2979 2904 3016 2940 4000 4000 4002 5000 5000 5000 6500 6500 6500 6500
∆E(F) 14.317 16.229 18.0822 23.1369 24.0478 20.7263 22.7458 23.382 0.578021 5.241996 9.826677 2.76822 8.06 16.8605 21.5753
Measurement
In order to test the comparisons of the different sources, the measurement method was used to measure the tristimulus values XYZ of the displayed colour samples on the CRT monitor and calculate the colour difference from these measured values. The measured colour difference is then compared with the calculated colour difference based on digital file values. The Ocean Optics HR2000 spectrophotometer was used to measure the trisitmulus XYZ values of the displayed colour samples on the CRT monitor under the test light sources and each respective reference light source. 5.2.3
The CECAM02 Model
In research paper [50], it is recognized that, at this time, there is no formally approved colour space for either the CIECAM02 or the CIECAM97s model. This research project selected to use CIECAM02 model (as explained in Section 2.4.2). Input data for the CIECAM02 model are as follows: [X,Y,Z]—the relative tristimulus values of the test colour stimulus in the source conditions. 66
[Xw, Yw, Zw]—the relative tristimulus values of the source white in the source conditions, here the tristimulus values of D65 white, normalized to make Yw=100. 2
LA – the adapting field luminance. This research assume LA =16 cd / m . Y – the relative luminance of the source background in the source conditions. c – the impact of the surround = 0.69 for average surround, or = 0.59 for dim surround. This project selected c=0.69. Nc – a chromatic induction factor = 1.0 for average surround, or = 0.9 for dim surround. In this research, Nc =1.0. F – a factor for the degree of adaptation = 1.0 for average surround, or = 0.9 for dim surround. This research project selected F=1.0.
In this research project, the output for each sample has been computed in terms of the CIECAM02 Lightness, Chroma and Hue [J,C, h] , following the procedures specified in [51]. These have then been converted into rectangular coordinates [ J , ac , bc ] for the three-dimensional colour space discussed earlier, using Equation (5.1):
ac C cos(h) bc C sin (h) 5.2.4
(5.1)
GOG Model for the display
To display colours on the CRT (cathode ray tube) monitor, there is a nonlinear transformation between the luminance reproduced on the screen and the corresponding input voltage, as expressed by the GOG model (More details in section 3.6.1.1). The implementation of the non-linear monitor response has been achieved in this model by use of the transformation given in Equation (5.2): P ' (1.15P 0.15) P' 0
(1.15P 0.15) 0
(5.2)
(1.15P 0.15) 0
Where P represents the normalized primary-colour content [R G B] (respectively) obtained from the numerical pixel values in the digitized version of image. The term P
'
gives the transformed primary-colour content R' G' B' (respectively) used as input to the next stage of the model. [50]
A set of nine LED sources and one fluorescent lamp were separated into five groups based on their nominal colour temperatures as shown in Table 5.2. The ten tested light 67
sources are compared with the five different references having the closest nominal colour temperature in each instance. The fourth and fifth columns are comparing the colour difference obtained from the file values and measurement. Table 5.2-Measure Group I Sources Compatible With Illuminant A Illuminant D50 Illuminant D55 Illuminant D65 Illuminant D75
CIE Reference Illuminant A D50 D55 D65 D75
Test Sources
CIECAM02 Colour Difference
L.W 4-Band LED L.W.6-Band LED LED3 PM4100 PM5500 WHITE LED F7 PM6500 NEW LED2 L.W 3-Band LED
ERMS (F )
ERMS (M )
23.14 15.41 5.53 23.33 23.04 29.93 8.06 38.72 48.89 26.65
21.16 12.89 5.24 15.48 18.92 26.27 5.90 31.03 39.44 26.26
5.3 Objective Testing Results 5.3.1
Testing results from CIECAM02 Model
As mentioned in Chapter 2, a colour appearance difference model based on the CIECAM02 has been selected to compute the colour appearance difference ( EC ) of the displayed colour samples under test and reference light sources. The rank of the test light sources was based on the colour rendering properties of light sources which are detailed in Chapter 4. The RMS error in Table 5.3 refers to the rms colour appearance difference ( E RMS ) of the 16 displayed colour samples in this research project (See Equation (5.3)). If the light sources are in the same light source group, the light source with smaller RMS Error value should have a larger Ra value, i.e. the displayed colour sample under such a light source should look better than under a light source with a larger RMS Error. Therefore, in the same illuminant group, the light source with smaller RMS Error value should get a smaller rank number. Rank numbers in Table 5.3 are listed from smallest to largest and indicate the CR performance of the the light sources, from best to poorest [2]. E RMS
16
EC
/ 16
(5.3)
i 1
Table 5.3-Colour appearance difference tables 68
(a)Computed results in reference CIEA group Reference llluminant
Test Illuminant
Correlated colour temperature(Tcp) (Kelvin)
Ra
A
F12 FL3.7 FL3.4 PM3016K F4 FL3.1
3000 2979 2904 3016 2940 2932
83 82 87 77 51 51
Rank1
ERMS (F )
Rank2
2 1 3 4 6 5
from File Values 14.317 16.229 18.0822 23.1369 24.0478 26.163
1 2 3 4 5 6
(b)Computed results in reference PM4000K LED group Reference llluminant
Test Illuminant
PM4000K
F11 FL3.8 HP4
Correlated colour temperature(Tcp) (Kelvin) 4000 4006 4002
Ra
Rank1
ERMS (F )
Rank2
from File Values 83 79 74
1 2 3
20.7263 22.7458 23.382
1 2 3
(c)Computed results in reference CIED50 group
Source Compatible With Illuminant D50
Reference llluminant
Test Sources
Correlated colour temperature (Tcp) (Kelvin)
Ra
CIE-D50 CIE-D50 CIE-D50 CIE-D50
F8 FL3.10 F10 F9
5000 5000 5000 4150
95 88 81 90
Rank1
ERMS (F )
Rank2
from File Values 1 2 3 4
0.578021 5.241996 9.826677 34.4335
1 2 3 4
ERMS (F )
Rank2
(d)Computed results in reference CIED65 group Source Compatible With
Reference llluminant
Illuminant D65
CIE-D65 CIE-D65 CIE-D65 CIE-D65
Test Sources
FL3.15 F7 F1 F5
Correlated colour temperature (Tcp) (Kelvin) 6509 6500 6430 6350
69
Ra
Rank1
from File Values 98 90 76 72
1 2 3 4
2.76822 8.06 16.8605 21.5753
1 2 3 4
Figure 5.2- RMS Error and Ra in Group CIE A
Figure 5.3- RMS Error and Ra in Group PM4000K
70
Figure 5.4- RMS Error and Ra in Group CIE D50
Figure 5.5- RMS Error and Ra in Group CIE D65 Figures 5.2 to 5.5 plot the relationship of colour appearance difference from file values ( ERMS (F ) ) and colour rendering ( Ra ) of the light sources in the same colour temperature ( Tc ) group. These diagrams are plotted based on the computed results that are displayed in Table 5.3. Light sources of CIE illuminant A group, are included in Figure 5.2 and it is noted that their colour temperatures were in the range 2904 K to 3016 K. It is can be seen that :
1. Comparing the colour images under the test and reference illuminants at the same (or very close) Tc , ERMS (F ) will decreases if Ra increases (See Figures 5.2 to 5.4). 71
2. Comparing the same colour images under the test and reference illuminants at the same (or very close) Tc , the rank of the light sources computed from the ERMS (F ) is the same as the rank calculated from CIE CRI program (See Table
5.3 (b),(c),(d)). 5.3.2
Test Results From Measurement
The measurement method of testing the VIS by use of HR 2000 spectrophotometer has been detailed in above. In this section, the measured results of the test light sources are displayed and analysed. Table 5.4 illustrates the measurement results and the ranks of the test light sources in the different lighting groups are compared from the measurements, CAM02 model, subjective test and Ra.
The fourth and fifth columns in Table 5.4 display the colour appearance difference ( ERMS ) under the compared light sources from the file values and measurements. These
results can be calculated by use of Equation (5.3). R1, R2, R3 and R4 are comparing the rank of the light sources from each light group which was achieved using four different test methods; they are from file value, measurement, observers‘ test results and Ra of light sources.
72
Table 5.4-Comparison table of the Measurement results Colour Difference Sources Compatible With “Warm” White (7000K)
Rank Order R2 R3 R4 (M) (O) (Ra)
Reference Illuminant
Test Sources
ERMS (F )
ERMS (M )
R1 (F)
CIE-A
4 BAND 6 BAND
23.14
21.16
2 1
2 1
2 1
CIE-D50
LED3 PM4100
15.41 5.53
12.89 5.24
1 2
1 2
CIE-D55
PM5500 White LED F7 PM6500
23.33 23.04
15.48 18.92
1 2
29.93 8.06
26.27 5.90
38.72
31.03
48.89 26.65
39.44 26.26
CIE-D65
CIE-D75
NEW LED2 3 BAND
Tc
Ra
2 1
3848 3478
95 94
1 2
1 2
4998 4100
93 90
1 2
1 2
1 2
5500 5782
86 66
1 2
1 2
1 2
1 2
6500 6500
90 73
2
2
2
2
7380
34
1
1
1
1
9528
93
M=Measurement, F=File Values, M=Measurement; O=Observer, R=Rank, ERMS=Error RMS, Ra=Colour rendering index; Tc = Colour tempearture
73
Figure shows the linear relationship between the CAM02 Erms and the measurement
Erms . The equation for the regression line, and the high correlation coefficient, show good agreement between the two sets of data. 50 y = 1.181x + 0.3439 R² = 0.9614
∆E from Measurements
45 40 35 30 25 20 15 10 5 0 5
10
15
20
25
30
35
40
45
∆E from File Values Figure 5.6-Colour difference from measurement and file values The achieved results in Table 5.4 and Figure 5.6 show that : 1. In each test lighting group, ranks of the colour appearance difference compared with the four different test methods are the same (See R1,R2,R3 and R4 in Table 5.4). 2. Most of the colour appearance difference values between the test and reference colour samples computed from the file values are very close to that value from the measurements (See Table 5.4), except PM4100K and F7. 3. The correlation coefficient, R 2 is 0.9614, which is very close to 1. This indicates the excellent linear reliability between file values based on CAM02 model and measurements (See Figure 5.6). This means the two sets of data are correlated.
74
6 CONCLUSIONS 6.1 Introduction The objective of this thesis was to develop a VIS that implements a combination of computer graphics and processing to generate displays that aid in the visualization of the colour rendering properties of a range of light sources, including new generation high-output LEDs that are becoming widely adopted in general lighting service. In this chapter, the main aspects of the research are summarized and recommendations are given for future work.
6.2 Discussion of Test Results 6.2.1
Test Results from subjective test (Refer to Chapter 4)
The results of the subjective test show that the designed VIS has the features that enable users to set up monitors to display colour images, and to select, view and compare the effects of different light sources and reference illuminants.
In part I of the Group I subjective test observers were required to select the best gamma and offset K1 values to provide that they perceived as ―good‖ image display conditions. Their average selections were 2.1 for gamma and 1.0 for K1. These values were selected as the standard settings for
and K1 for rest of the subjective tests and for the
calculations that were used to derive comparison data sets.
The results obtained from Group I show that the rank of the light sources which was based on their Tc and Ra values, matched the rank of the light sources assessed from their AT (Average Total) and AM (Average Magnitude). This means the designed VIS as required performance.
The results obtained from Group II are very consistent with the results achieved by Group I. Therefore, the VIS has successfully achieved the implementation of a combination of computer graphics and processing to generate displays that aid in the
75
visualization of the colour rendering properties of a range of light sources, including the new generation of high-output LEDs. The following ―two rules of colour rendering properties‖ proposed by the author have been proved from subjective test. 1. The displayed colour sample looks ―better‖ under a test light source with a larger Ra value when the test and reference light sources are at the same Tc . 2. The displayed colour sample looks ―better‖ under a test light source with a higher Tc when the test and reference light sources have the same Ra. 6.2.2
Test Results from Objective Test (Refer to Chapter 5)
The achieved results from CIE CAM02 model in objective test show that: 1. Comparing the colour images under the test and reference illuminants at the same (or very close) Tc , ERMS (F ) will decreases if Ra increases. 2. Comparing the same colour images under the test and reference illuminants at the same (or very close) Tc , the rank of the light sources computed from the ERMS (F ) is the same as the rank calculated from CIE CRI program.
The rank orders of the colour appearance differences from file values and measurements are the same. The correlation coefficient between measurements and file values is 0.9614, which means results from measurements are very close to results computed from file values
Measurement errors could have arisen from the ingress of stray light and from imperfect light coupling between the CRT screen and the cosine-corrected sampling aperture used on the fibre-optic input to the HR2000. However, stray light was kept to practical minimum by conducting measurement in a darkened room (using dark-coloured curtain).
6.3 Outcomes of the Research Project A VIS has been successfully developed as explained in Chapter 3, using MATLAB GUI. The designed MATLAB GUI application interface has been tested on a CRT monitor by 21 observers. At the time, the colour appearance difference model based on CIECAM02
76
was used to compute the colour appearance difference of the VIS. The outcomes of this research project are outlined as below: 1. A colour-managed computer display system that allows the user to utilize the system functionality to: a. Set up monitors for display (See Figure 6.2). b. Select light sources (from the data-base of 52 illuminants including high output LEDs). c. View and compare the test colour images under various test light sources (See Figure 6.2). d. Compute Ra and Tc of the test light source. (See Figure 6.3). e. Compute the [RGB] values of each displayed colour sample under different light sources. (See Figure 6.4). f.
Compute CIECAM02 colour appearance differences.
2. A spectrum display system (SPD_GUI) has been developed to allow the user to view the SPDs of test light sources (See Figure 6.5). 3. A spectral reflectance display system (Re_GUI) has been developed to allow the user to view the reflectance of each colour sample (See Figure 6.6). 4. The structure of the system is such that the SPD data for any new sources can easily be added to the data base, and their colour rendering performance computed and analyzed. 5. In a similar way, additional or alternative test colours can be added to the colour sample data-base as soon as their spectral reflectances have been measured.
77
Figure 6.1-MATLAB GUI
Figure 6.2-Main GUI 78
\ Figure 6.3-List of available source spectra
Figure 6.4-Calculate RGB of displayed colours
79
Figure 6.5-Graph of current source SPDs
Figure 6.6-Graph of current reflectance spectra 80
6.4 Conclusion The designed VIS has been tested using four different methods, the test results from the subjective and objective testing proved that a virtual imaging system has been successfully implemented. The VIS system allows the user to display and compare the 16 displayed colour samples under test and reference light sources.
The measurements using the HR2000 spectrophotometer show that after completion of the validation steps outlined in Chapter 3, it is possible to draw meaningful and valid conclusions regarding the colour rendering performance of new sources such as high output LEDs (or any other new lamps). However, the measured results and the calculated colour difference based on the CAM02 model show that not all of the new research LED light sources display colour samples as expected, especially the Philips Mixed 4100K LED and F7 lamp.
The VIS system can be extended by adding furtuer source SPDs into the existing data base. In a similar way, additional or alternative test colours can be added to the colour sample database as soon as their spectral reflectances have been measured.
6.5 Recommendation It is a requirement of the project to verify that, as far as is technically feasible; the colour appearance differences displayed in the virtual images are accurate representations of the ―real-life” experience. The results in Chapter 4 demonstrate that the observers‘ responses to the different source SPDs were largely in agreement with Ra. The measurement results in Chapter 5 show that some of the new research LEDs, especially Philips Mixed LEDs do not display colour samples as expected.
81
APPENDICES APPENDIX I- REFLECTANCES .................................................................................. 84 APPENDIX II-SPDs ....................................................................................................... 90 APPENDIX III-OBSERVERS ..................................................................................... 103 APPENDIX IV-SUBJECTIVE TEST SHEETS........................................................... 104 APPENDIX V-MATLAB CODE ................................................................................. 114 APPENDIX VI-SUBJECTUVE TEST RESULTS ...................................................... 202 APPENDIX VII-USERS‘ MANUAL ........................................................................... 205 Appendix I. 1- Reflectance of 12 test colour samples .................................................... 84 Appendix I. 2 - Reflectance of 16 test colour samples ................................................... 87 Appendix II. 1- Relative spectral power distributions of illuminants representing typical fluorescent lamps.......................................................................................... 90 Appendix II. 2- High pressure discharge lamps .............................................................. 92 Appendix II. 3-Relative spectral power distributions of illuminants representing new set of fluorescent lamps. .................................................................................... 93 Appendix II. 4 -Relative spectral power distributions of illuminants representing new set of fluorescent lamps. ............................................................................... 95 Appendix II. 5 - L.W. research 3-, 4-, 5-, 6-, 7-Band LED............................................. 97 Appendix II. 6- Philips Mixture LEDs & Luxeon white LED ........................................ 98 Appendix II. 7 - Relative spectral power distributions of CIE illuminants .................. 100 Appendix II. 8 -New LEDs ........................................................................................... 102 Appendix III. 1-CIE1931 Colorimetric Observer ......................................................... 103 Appendix IV. 1- Monitor Set-up Test ........................................................................... 104 Appendix IV. 2-Group I Test ........................................................................................ 105 Appendix IV. 3-Group II Test ....................................................................................... 108 Appendix IV. 4-. Group II Test ..................................................................................... 110 Appendix IV. 5-Group III Test ..................................................................................... 112 Appendix V. 1- Displaycolour.m .................................................................................. 114 Appendix V. 2-Backgroundcolour.m ............................................................................ 116 Appendix V. 3-Musell.m .............................................................................................. 120 Appendix V. 4-CIExyz.m ............................................................................................. 121 Appendix V. 5-SPD.m .................................................................................................. 121 Appendix V. 6-SPD2.m ................................................................................................ 121 Appendix V. 7-SPD3.m&SPD4.m ................................................................................ 121 Appendix V. 8-SPD5.m&SPD6.m ................................................................................ 121 Appendix V. 9-SPD7.m ................................................................................................ 122 Appendix V. 10- CalculateRGB.m ............................................................................... 123 Appendix V. 11–Colour 1.m ......................................................................................... 126 Appendix V. 12–Colour 2.m ......................................................................................... 128 Appendix V. 13 -Test2.m .............................................................................................. 130 82
Appendix V. 14- Plot_GUI.m ....................................................................................... 197 Appendix V. 15 - Plot_Re.m ......................................................................................... 201 Appendix VI. 1-Test results from Group I .................................................................... 202 Appendix VI. 2-Test results from Group II .................................................................. 203 Appendix VI. 3-Test results from Group III ................................................................. 204 Appendix VII 1-USERS‘ MANUAL ............................................................................ 205
83
APPENDIX I- REFLECTANCES Appendix I. 1- Reflectance of 12 test colour samples
(nm) 380 385 390 395 400 405 410 415 420 425 430 435 440 445 450 455 460 465 470 475 480 485 490 495 500 505 510
5R 6/12 0.27 0.54 0.46 0.45 0.35 0.28 0.25 0.22 0.22 0.2 0.21 0.2 0.2 0.19 0.19 0.19 0.19 0.18 0.18 0.17 0.17 0.17 0.16 0.16 0.16 0.15 0.15
5P6/8 0.42 0.75 0.7 0.7 0.59 0.54 0.48 0.44 0.42 0.4 0.4 0.4 0.4 0.4 0.4 0.39 0.39 0.37 0.36 0.34 0.33 0.31 0.3 0.29 0.28 0.26 0.25
5PB6/10 0.67 1.04 0.74 0.79 0.77 0.74 0.73 0.66 0.65 0.63 0.63 0.62 0.6 0.59 0.57 0.56 0.54 0.51 0.49 0.47 0.45 0.44 0.42 0.4 0.38 0.37 0.36
5B
5BG6/6 0.47 0.87 0.82 0.88 0.82 0.79 0.79 0.75 0.75 0.76 0.76 0.77 0.78 0.79 0.79 0.8 0.8 0.79 0.77 0.75 0.73 0.7 0.67 0.64 0.6 0.56 0.53
0.36 0.83 0.72 0.75 0.64 0.58 0.52 0.5 0.5 0.48 0.5 0.5 0.52 0.53 0.54 0.55 0.57 0.58 0.59 0.6 0.6 0.6 0.6 0.6 0.59 0.58 0.56
5G6/8
5GY6/10
0.5 0.62 0.43 0.47 0.41 0.33 0.31 0.29 0.28 0.28 0.29 0.3 0.31 0.32 0.34 0.37 0.4 0.43 0.45 0.48 0.51 0.53 0.54 0.55 0.55 0.54 0.53
0.17 0.51 0.38 0.3 0.29 0.23 0.2 0.18 0.18 0.18 0.18 0.18 0.19 0.21 0.22 0.23 0.25 0.27 0.29 0.31 0.34 0.37 0.4 0.43 0.46 0.49 0.51
84
5Y6/10 -0.14 0.36 0.17 0.1 0.06 0.05 0.06 0.04 0.05 0.03 0.03 0.03 0.03 0.03 0.03 0.04 0.04 0.04 0.04 0.05 0.05 0.06 0.08 0.1 0.13 0.17 0.22
5R 6/12 -0.06 0.33 0.22 0.1 0.05 0.06 0.06 0.04 0.05 0.02 0.03 0.03 0.03 0.03 0.04 0.04 0.04 0.03 0.03 0.03 0.04 0.03 0.04 0.04 0.05 0.06 0.09
5YR6/10 0.18 0.41 0.19 0.18 0.11 0.08 0.08 0.07 0.06 0.05 0.06 0.05 0.05 0.06 0.06 0.06 0.07 0.07 0.07 0.08 0.09 0.1 0.11 0.12 0.13 0.14 0.15
8M6 0.03 0.18 0.02 0.04 0.02 0.02 0.02 0.02 0.03 0.03 0.03 0.04 0.04 0.05 0.04 0.05 0.05 0.04 0.04 0.04 0.04 0.03 0.03 0.02 0.02 0.02 0.01
3PO 0.08 0.01 0.05 0 0 0.01 0.01 0.01 0.01 0.01 0 0.01 0.01 0.01 0.01 0.01 0.01 0.01 0 0.01 0.01 0.01 0.01 0.01 0.01 0.01 0.01
764 0.74 0.43 0.52 0.43 0.36 0.3 0.27 0.24 0.24 0.25 0.25 0.26 0.26 0.27 0.28 0.3 0.31 0.32 0.34 0.35 0.36 0.37 0.38 0.38 0.37 0.37 0.37
Appendix I.1 Continued
(nm) 515 520 525 530 535 540 545 550 555 560 565 570 575 580 585 590 595 600 605 610 615 620 625 630
5R 6/12 0.15 0.15 0.15 0.15 0.15 0.15 0.16 0.17 0.18 0.19 0.21 0.23 0.28 0.35 0.45 0.55 0.64 0.73 0.8 0.86 0.9 0.92 0.94 0.95
5P6/8 0.23 0.22 0.22 0.22 0.22 0.21 0.2 0.2 0.19 0.18 0.18 0.2 0.23 0.3 0.39 0.48 0.57 0.64 0.69 0.72 0.74 0.75 0.76 0.76
5PB6/10 0.35 0.34 0.33 0.32 0.31 0.3 0.3 0.31 0.31 0.32 0.32 0.31 0.31 0.3 0.29 0.29 0.3 0.33 0.37 0.42 0.46 0.51 0.54 0.57
5B 0.5 0.47 0.44 0.41 0.38 0.36 0.33 0.31 0.3 0.28 0.27 0.25 0.24 0.23 0.23 0.22 0.22 0.22 0.21 0.21 0.22 0.22 0.22 0.23
5BG6/6 0.55 0.53 0.5 0.48 0.45 0.43 0.39 0.37 0.34 0.31 0.28 0.26 0.25 0.24 0.23 0.22 0.21 0.21 0.2 0.2 0.19 0.19 0.19 0.2
5G6/8
5GY6/10
0.52 0.5 0.49 0.47 0.45 0.43 0.4 0.38 0.36 0.33 0.31 0.29 0.27 0.25 0.23 0.21 0.2 0.18 0.18 0.17 0.17 0.16 0.16 0.16
0.52 0.52 0.52 0.5 0.49 0.47 0.45 0.42 0.4 0.37 0.34 0.31 0.28 0.26 0.23 0.2 0.18 0.16 0.15 0.14 0.13 0.12 0.12 0.12
85
5Y6/10 0.29 0.37 0.44 0.49 0.52 0.52 0.5 0.48 0.45 0.42 0.39 0.36 0.33 0.31 0.29 0.27 0.26 0.25 0.24 0.23 0.23 0.23 0.22 0.22
5R 6/12 0.14 0.2 0.27 0.33 0.37 0.4 0.42 0.43 0.43 0.44 0.44 0.44 0.43 0.43 0.43 0.43 0.43 0.43 0.43 0.43 0.42 0.42 0.42 0.42
5YR6/10 0.16 0.16 0.16 0.17 0.17 0.18 0.19 0.21 0.24 0.28 0.33 0.39 0.44 0.49 0.53 0.57 0.59 0.61 0.62 0.63 0.63 0.63 0.63 0.63
8M6 0.01 0.01 0.01 0.01 0.01 0.01 0.01 0.01 0.01 0.01 0.01 0.01 0.01 0.01 0.01 0.01 0.01 0.01 0.01 0.01 0.01 0.01 0.01 0.01
3PO 0.01 0.01 0.01 0.01 0.01 0.01 0.01 0.01 0.01 0.01 0.01 0.01 0.01 0.02 0.03 0.05 0.09 0.13 0.17 0.23 0.3 0.38 0.45 0.51
764 0.37 0.36 0.36 0.35 0.35 0.34 0.33 0.32 0.31 0.29 0.28 0.26 0.25 0.23 0.21 0.2 0.18 0.17 0.16 0.15 0.15 0.14 0.14 0.14
Appendix I.1 Continued
(nm) 635 640 645 650 655 660 665 670 675 680 685 690 695 700 705 710 715 720 725 730 735 740 745 750 755 760 765 770 775 780
5R 6/12 0.96 0.97 0.97 0.97 0.97 0.97 0.97 0.98 0.98 0.98 0.97 0.98 0.98 0.98 0.98 0.98 0.98 0.98 0.98 0.98 0.98 0.98 0.98 0.98 0.98 0.98 0.98 0.98 0.97 0.98
5P6/8 0.76 0.77 0.76 0.76 0.76 0.76 0.76 0.76 0.76 0.76 0.75 0.75 0.75 0.75 0.75 0.74 0.74 0.74 0.73 0.74 0.74 0.74 0.74 0.73 0.74 0.73 0.73 0.73 0.73 0.73
5PB6/10 0.6 0.61 0.63 0.64 0.66 0.67 0.68 0.7 0.71 0.72 0.73 0.74 0.75 0.76 0.77 0.77 0.78 0.79 0.79 0.79 0.8 0.8 0.8 0.81 0.8 0.81 0.8 0.81 0.81 0.82
5B
5BG6/6 0.23 0.24 0.25 0.26 0.27 0.28 0.29 0.3 0.31 0.32 0.32 0.33 0.34 0.35 0.36 0.37 0.38 0.4 0.41 0.43 0.44 0.46 0.49 0.51 0.53 0.55 0.58 0.6 0.61 0.63
0.2 0.21 0.21 0.21 0.22 0.22 0.22 0.22 0.21 0.21 0.2 0.2 0.2 0.2 0.2 0.21 0.21 0.21 0.21 0.22 0.22 0.24 0.26 0.28 0.29 0.3 0.32 0.33 0.33 0.34
5G6/8
5GY6/10
0.15 0.15 0.15 0.15 0.15 0.15 0.15 0.15 0.15 0.16 0.16 0.17 0.17 0.17 0.17 0.17 0.17 0.17 0.16 0.16 0.16 0.17 0.17 0.18 0.19 0.19 0.2 0.2 0.2 0.2
0.11 0.11 0.1 0.1 0.1 0.1 0.1 0.1 0.1 0.1 0.1 0.11 0.11 0.12 0.12 0.12 0.12 0.12 0.12 0.12 0.13 0.13 0.14 0.15 0.16 0.16 0.17 0.17 0.17 0.17
86
5Y6/10
5R 6/12
0.22 0.23 0.23 0.24 0.25 0.26 0.26 0.27 0.29 0.31 0.33 0.35 0.36 0.37 0.38 0.39 0.42 0.46 0.51 0.55 0.58 0.62 0.65 0.68 0.7 0.73 0.75 0.77 0.77 0.79
0.42 0.42 0.42 0.42 0.41 0.41 0.41 0.41 0.41 0.41 0.4 0.4 0.4 0.4 0.4 0.39 0.39 0.39 0.39 0.39 0.39 0.39 0.39 0.38 0.38 0.39 0.38 0.39 0.38 0.39
5YR6/10 0.63 0.63 0.63 0.63 0.63 0.63 0.62 0.62 0.62 0.62 0.61 0.61 0.61 0.61 0.61 0.6 0.6 0.61 0.6 0.6 0.6 0.6 0.59 0.59 0.59 0.59 0.59 0.59 0.59 0.58
8M6 0.01 0.01 0.01 0.01 0.01 0.01 0.01 0.01 0.01 0.01 0.01 0.01 0.01 0.01 0.01 0.01 0.01 0.01 0.01 0.01 0.01 0.01 0.01 0.01 0.01 0.01 0.01 0.02 0.02 0.02
3PO 0.55 0.59 0.62 0.63 0.65 0.66 0.68 0.69 0.69 0.7 0.7 0.71 0.71 0.71 0.71 0.72 0.72 0.72 0.72 0.72 0.72 0.72 0.72 0.72 0.72 0.72 0.72 0.72 0.73 0.72
764 0.14 0.13 0.13 0.13 0.13 0.13 0.13 0.14 0.14 0.15 0.15 0.16 0.16 0.16 0.16 0.16 0.16 0.16 0.16 0.16 0.16 0.17 0.17 0.18 0.18 0.19 0.19 0.19 0.2 0.19
Appendix I. 2 - Reflectance of 16 test colour samples
(nm)
7.5R
5Y6/4
5GY6/8
2.5G
10BG
5PB
2.5P
10P
4.5P
5Y8/10
4.5G
3PB
5YR
5GY4/4
Dark Grey
Light Grey
380 385 390 395 400 405 410 415 420 425 430 435 440 445 450 455 460 465 470 475 480 485 490 495 500 505 510 515 520
0.219 0.239 0.252 0.256 0.256 0.254 0.252 0.248 0.244 0.24 0.237 0.232 0.23 0.226 0.225 0.222 0.22 0.218 0.216 0.214 0.214 0.214 0.216 0.218 0.223 0.225 0.226 0.226 0.225
0.07 0.079 0.089 0.101 0.111 0.116 0.118 0.12 0.121 0.122 0.122 0.122 0.123 0.124 0.127 0.128 0.131 0.134 0.138 0.143 0.15 0.159 0.174 0.19 0.207 0.225 0.242 0.253 0.26
0.065 0.068 0.07 0.072 0.073 0.073 0.074 0.074 0.074 0.073 0.073 0.073 0.073 0.073 0.074 0.075 0.077 0.08 0.085 0.094 0.109 0.126 0.148 0.172 0.198 0.221 0.241 0.26 0.278
0.074 0.083 0.093 0.105 0.116 0.121 0.124 0.126 0.128 0.131 0.135 0.139 0.144 0.151 0.161 0.172 0.186 0.205 0.229 0.254 0.281 0.308 0.332 0.352 0.37 0.383 0.39 0.394 0.395
0.295 0.306 0.31 0.312 0.313 0.315 0.319 0.322 0.326 0.33 0.334 0.339 0.346 0.352 0.36 0.369 0.381 0.394 0.403 0.41 0.415 0.418 0.419 0.417 0.413 0.409 0.403 0.396 0.389
0.151 0.203 0.265 0.339 0.41 0.464 0.492 0.508 0.517 0.524 0.531 0.538 0.544 0.551 0.556 0.556 0.554 0.549 0.541 0.531 0.519 0.504 0.488 0.469 0.45 0.431 0.414 0.395 0.377
0.378 0.459 0.524 0.546 0.551 0.555 0.559 0.56 0.561 0.558 0.556 0.551 0.544 0.535 0.522 0.506 0.488 0.469 0.448 0.429 0.408 0.385 0.363 0.341 0.324 0.311 0.301 0.291 0.283
0.104 0.129 0.17 0.24 0.319 0.416 0.462 0.482 0.49 0.488 0.482 0.473 0.462 0.45 0.439 0.426 0.413 0.397 0.382 0.366 0.352 0.337 0.325 0.31 0.299 0.289 0.283 0.276 0.27
0.066 0.062 0.058 0.055 0.052 0.052 0.051 0.05 0.05 0.049 0.048 0.047 0.046 0.044 0.042 0.041 0.038 0.035 0.033 0.031 0.03 0.029 0.028 0.028 0.028 0.029 0.03 0.03 0.031
0.05 0.054 0.059 0.063 0.066 0.067 0.068 0.069 0.069 0.07 0.072 0.073 0.076 0.078 0.083 0.088 0.095 0.103 0.113 0.125 0.142 0.162 0.189 0.219 0.262 0.305 0.365 0.416 0.465
0.111 0.121 0.127 0.129 0.127 0.121 0.116 0.112 0.108 0.105 0.104 0.104 0.105 0.106 0.11 0.115 0.123 0.134 0.148 0.167 0.192 0.219 0.252 0.291 0.325 0.347 0.356 0.353 0.346
0.12 0.103 0.09 0.082 0.076 0.068 0.064 0.065 0.075 0.093 0.123 0.16 0.207 0.256 0.3 0.331 0.346 0.347 0.341 0.328 0.307 0.282 0.257 0.23 0.204 0.178 0.154 0.129 0.109
0.104 0.127 0.161 0.211 0.264 0.313 0.341 0.352 0.359 0.361 0.364 0.365 0.367 0.369 0.372 0.374 0.376 0.379 0.384 0.389 0.397 0.405 0.416 0.429 0.443 0.454 0.461 0.466 0.469
0.036 0.036 0.037 0.038 0.039 0.039 0.04 0.041 0.042 0.042 0.043 0.044 0.044 0.045 0.045 0.046 0.047 0.048 0.05 0.052 0.055 0.057 0.062 0.067 0.075 0.083 0.092 0.1 0.108
0.3 0.3 0.3 0.3 0.3 0.3 0.3 0.3 0.3 0.3 0.3 0.3 0.3 0.3 0.3 0.3 0.3 0.3 0.3 0.3 0.3 0.3 0.3 0.3 0.3 0.3 0.3 0.3 0.3
0.6 0.6 0.6 0.6 0.6 0.6 0.6 0.6 0.6 0.6 0.6 0.6 0.6 0.6 0.6 0.6 0.6 0.6 0.6 0.6 0.6 0.6 0.6 0.6 0.6 0.6 0.6 0.6 0.6
87
Appendix I.2-Continued
(nm) 525
7.5R
5Y6/4
5GY6/8
2.5G
10BG
5PB
2.5P
10P
4.5P
5Y8/10
4.5G
3PB
5YR
5GY4/4
Dark Grey
Light Grey
0.225
0.264
0.302
0.392
0.381
0.358
0.273
0.262
0.031
0.509
530
0.227
0.267
0.339
0.385
0.372
0.341
0.265
0.256
0.032
0.546
0.333
0.09
0.471
0.121
0.3
0.6
0.314
0.075
0.474
0.133
0.3
535
0.23
0.269
0.37
0.377
0.363
0.325
0.26
0.251
0.032
0.6
0.581
0.294
0.062
0.476
0.142
0.3
540
0.236
0.272
0.392
0.367
0.353
0.309
0.257
0.25
0.6
0.033
0.61
0.271
0.051
0.483
0.15
0.3
545
0.245
0.276
0.399
0.354
0.342
0.293
0.257
0.6
0.251
0.034
0.634
0.248
0.041
0.49
0.154
0.3
550
0.253
0.282
0.4
0.341
0.331
0.279
0.6
0.259
0.254
0.035
0.653
0.227
0.035
0.506
0.155
0.3
555
0.262
0.289
0.393
0.327
0.32
0.6
0.265
0.26
0.258
0.037
0.666
0.206
0.029
0.526
0.152
0.3
560
0.272
0.299
0.38
0.312
0.6
0.308
0.253
0.26
0.264
0.041
0.678
0.188
0.025
0.553
0.147
0.3
565
0.283
0.309
0.365
0.6
0.296
0.296
0.241
0.258
0.269
0.044
0.687
0.17
0.022
0.582
0.14
0.3
570
0.298
0.322
0.6
0.349
0.28
0.284
0.234
0.256
0.272
0.048
0.693
0.153
0.019
0.618
0.133
0.3
575
0.318
0.6
0.329
0.332
0.263
0.271
0.227
0.254
0.274
0.052
0.698
0.138
0.017
0.651
0.125
0.3
580
0.6
0.341
0.335
0.315
0.247
0.26
0.225
0.254
0.278
0.06
0.701
0.125
0.017
0.68
0.118
0.3
0.6
585
0.367
0.339
0.299
0.229
0.247
0.222
0.259
0.284
0.076
0.704
0.114
0.017
0.701
0.112
0.3
0.6
590
0.39
0.341
0.285
0.214
0.232
0.221
0.27
0.295
0.102
0.705
0.106
0.016
0.717
0.106
0.3
0.6
595
0.409
0.341
0.272
0.198
0.22
0.22
0.284
0.316
0.136
0.705
0.1
0.016
0.729
0.101
0.3
0.6
600
0.424
0.342
0.264
0.185
0.21
0.22
0.302
0.348
0.19
0.706
0.096
0.016
0.736
0.098
0.3
0.6
605
0.435
0.342
0.257
0.175
0.2
0.22
0.324
0.384
0.256
0.707
0.092
0.016
0.742
0.095
0.3
0.6
610
0.442
0.342
0.252
0.169
0.194
0.22
0.344
0.434
0.336
0.707
0.09
0.016
0.745
0.093
0.3
0.6
615
0.448
0.341
0.247
0.164
0.189
0.22
0.362
0.482
0.418
0.707
0.087
0.016
0.747
0.09
0.3
0.6
620
0.45
0.341
0.241
0.16
0.185
0.223
0.377
0.528
0.505
0.708
0.085
0.016
0.748
0.089
0.3
0.6
625
0.451
0.339
0.235
0.156
0.183
0.227
0.389
0.568
0.581
0.708
0.082
0.016
0.748
0.087
0.3
0.6
630
0.451
0.339
0.229
0.154
0.18
0.233
0.4
0.604
0.641
0.71
0.08
0.018
0.748
0.086
0.3
0.6
635
0.451
0.338
0.224
0.152
0.177
0.239
0.41
0.629
0.682
0.711
0.079
0.018
0.748
0.085
0.3
0.6
640
0.451
0.338
0.22
0.151
0.176
0.244
0.42
0.648
0.717
0.712
0.078
0.018
0.748
0.084
0.3
0.6
645
0.451
0.337
0.217
0.149
0.175
0.251
0.429
0.663
0.74
0.714
0.078
0.018
0.748
0.084
0.3
0.6
650
0.45
0.336
0.216
0.148
0.175
0.258
0.438
0.676
0.758
0.716
0.078
0.019
0.748
0.084
0.3
0.6
655
0.45
0.335
0.216
0.148
0.175
0.263
0.445
0.685
0.77
0.718
0.078
0.02
0.748
0.084
0.3
0.6
660
0.451
0.334
0.219
0.148
0.175
0.268
0.452
0.693
0.781
0.72
0.081
0.023
0.747
0.085
0.3
0.6
665
0.451
0.332
0.224
0.149
0.177
0.273
0.457
0.7
0.79
0.722
0.083
0.024
0.747
0.087
0.3
0.6
88
Appendix I.2-Continued
(nm) 670 675 680 685 690 695 700 705 710 715 720 725 730 735 740 745 750 755 760 765 770 775 780
7.5R
5Y6/4
5GY6/8
2.5G
10BG
5PB
2.5P
10P
4.5P
5Y8/10
4.5G
3PB
5YR
5GY4/4
0.453 0.454 0.455 0.457 0.458 0.46 0.462 0.463 0.464 0.465 0.466 0.466 0.466 0.466 0.467 0.467 0.467 0.467 0.467 0.467 0.467 0.467 0.467
0.332 0.331 0.331 0.33 0.329 0.328 0.328 0.327 0.326 0.325 0.324 0.324 0.324 0.323 0.322 0.321 0.32 0.318 0.316 0.315 0.315 0.314 0.314
0.23 0.238 0.251 0.269 0.288 0.312 0.34 0.366 0.39 0.412 0.431 0.447 0.46 0.472 0.481 0.488 0.493 0.497 0.5 0.502 0.505 0.51 0.516
0.151 0.154 0.158 0.162 0.165 0.168 0.17 0.171 0.17 0.168 0.166 0.164 0.164 0.165 0.168 0.172 0.177 0.181 0.185 0.189 0.192 0.194 0.197
0.18 0.183 0.186 0.189 0.192 0.195 0.199 0.2 0.199 0.198 0.196 0.195 0.195 0.196 0.197 0.2 0.203 0.205 0.208 0.212 0.215 0.217 0.219
0.278 0.281 0.283 0.286 0.291 0.296 0.302 0.313 0.325 0.338 0.351 0.364 0.376 0.389 0.401 0.413 0.425 0.436 0.447 0.458 0.469 0.477 0.485
0.462 0.466 0.468 0.47 0.473 0.477 0.483 0.489 0.496 0.503 0.511 0.518 0.525 0.532 0.539 0.546 0.553 0.559 0.565 0.57 0.575 0.578 0.581
0.705 0.709 0.712 0.715 0.717 0.719 0.721 0.72 0.719 0.722 0.725 0.727 0.729 0.73 0.73 0.73 0.73 0.73 0.73 0.73 0.73 0.73 0.73
0.797 0.803 0.809 0.814 0.819 0.824 0.828 0.83 0.831 0.833 0.835 0.836 0.836 0.837 0.838 0.839 0.839 0.839 0.839 0.839 0.839 0.839 0.839
0.725 0.729 0.731 0.735 0.739 0.742 0.746 0.748 0.749 0.751 0.753 0.754 0.755 0.755 0.755 0.755 0.756 0.757 0.758 0.759 0.759 0.759 0.759
0.088 0.093 0.102 0.112 0.125 0.141 0.161 0.182 0.203 0.223 0.242 0.257 0.27 0.282 0.292 0.302 0.31 0.314 0.317 0.323 0.33 0.334 0.338
0.026 0.03 0.035 0.043 0.056 0.074 0.097 0.128 0.166 0.21 0.257 0.305 0.354 0.401 0.446 0.485 0.52 0.551 0.577 0.599 0.618 0.633 0.645
0.747 0.747 0.747 0.747 0.747 0.746 0.746 0.746 0.745 0.744 0.743 0.744 0.745 0.748 0.75 0.75 0.749 0.748 0.748 0.747 0.747 0.747 0.747
0.092 0.096 0.102 0.11 0.123 0.137 0.152 0.169 0.188 0.207 0.226 0.243 0.26 0.277 0.294 0.31 0.325 0.339 0.353 0.366 0.379 0.39 0.399
89
Dark Grey 0.3 0.3 0.3 0.3 0.3 0.3 0.3 0.3 0.3 0.3 0.3 0.3 0.3 0.3 0.3 0.3 0.3 0.3 0.3 0.3 0.3 0.3 0.3
Light Grey 0.6 0.6 0.6 0.6 0.6 0.6 0.6 0.6 0.6 0.6 0.6 0.6 0.6 0.6 0.6 0.6 0.6 0.6 0.6 0.6 0.6 0.6 0.6
APPENDIX II-SPDs Appendix II. 1- Relative spectral power distributions of illuminants representing typical fluorescent lamps
(nm) 380 385 390 395 400 405 410 415 420 425 430 435 440 445 450 455 460 465 470 475 480 485 490 495 500 505 510 515 520 525 530 535 540 545 550 555 560 565 570 575 580 585 590 595 600
F1
F2
F3
F4
F5
F6
F7
F8
F9
F10
F11
F12
1.87 2.36 2.94 3.47 5.17 19.49 6.13 6.24 7.01 7.79 8.56 43.67 16.94 10.72 11.35 11.89 12.37 12.75 13 13.15 13.23 13.17 13.13 12.85 12.52 12.2 11.83 11.5 11.22 11.05 11.03 11.18 11.53 27.74 17.05 13.55 14.33 15.01 15.52 18.29 19.55 15.48 14.91 14.15 13.22
1.18 1.48 1.84 2.15 3.44 15.69 3.85 3.74 4.19 4.62 5.06 34.98 11.81 6.27 6.63 6.93 7.19 7.4 7.54 7.62 7.65 7.62 7.62 7.45 7.28 7.15 7.05 7.04 7.16 7.47 8.04 8.88 10.01 24.88 16.64 14.59 16.16 17.56 18.62 21.47 22.79 19.29 18.66 17.73 16.54
0.82 1.02 1.26 1.44 2.57 14.36 2.7 2.45 2.73 3 3.28 31.85 9.47 4.02 4.25 4.44 4.59 4.72 4.8 4.86 4.87 4.85 4.88 4.77 4.67 4.62 4.62 4.73 4.99 5.48 6.25 7.34 8.78 23.82 16.14 14.59 16.63 18.49 19.95 23.11 24.69 21.41 20.85 19.93 18.67
0.57 0.7 0.87 0.98 2.01 13.75 1.95 1.59 1.76 1.93 2.1 30.28 8.03 2.55 2.7 2.82 2.91 2.99 3.04 3.08 3.09 3.09 3.14 3.06 3 2.98 3.01 3.14 3.41 3.9 4.69 5.81 7.32 22.59 15.11 13.88 16.33 18.68 20.64 24.28 26.26 23.28 22.94 22.14 20.91
1.87 2.35 2.92 3.45 5.1 18.91 6 6.11 6.85 7.58 8.31 40.76 16.06 10.32 10.91 11.4 11.83 12.17 12.4 12.54 12.58 12.52 12.47 12.2 11.89 11.61 11.33 11.1 10.96 10.97 11.16 11.54 12.12 27.78 17.73 14.47 15.2 15.77 16.1 18.54 19.5 15.39 14.64 13.72 12.69
1.05 1.31 1.63 1.9 3.11 14.8 3.43 3.3 3.68 4.07 4.45 32.61 10.74 5.48 5.78 6.03 6.25 6.41 6.52 6.58 6.59 6.56 6.56 6.42 6.28 6.2 6.19 6.3 6.6 7.12 7.94 9.07 10.49 25.22 17.46 15.63 17.22 18.53 19.43 21.97 23.01 19.41 18.56 17.42 16.09
2.56 3.18 3.84 4.53 6.15 19.37 7.37 7.05 7.71 8.41 9.15 44.14 17.52 11.35 12 12.58 13.08 13.45 13.71 13.88 13.95 13.93 13.82 13.64 13.43 13.25 13.08 12.93 12.78 12.6 12.44 12.33 12.26 29.52 17.05 12.44 12.58 12.72 12.83 15.46 16.75 12.83 12.67 12.45 12.19
1.21 1.5 1.81 2.13 3.17 13.08 3.83 3.45 3.86 4.42 5.09 34.1 12.42 7.68 8.6 9.46 10.24 10.84 11.33 11.71 11.98 12.17 12.28 12.32 12.35 12.44 12.55 12.68 12.77 12.72 12.6 12.43 12.22 28.96 16.51 11.79 11.76 11.77 11.84 14.61 16.11 12.34 12.53 12.72 12.92
0.9 1.12 1.36 1.6 2.59 12.8 3.05 2.56 2.86 3.3 3.82 32.62 10.77 5.84 6.57 7.25 7.86 8.35 8.75 9.06 9.31 9.48 9.61 9.68 9.74 9.88 10.04 10.26 10.48 10.63 10.78 10.96 11.18 27.71 16.29 12.28 12.74 13.21 13.65 16.57 18.14 14.55 14.65 14.66 14.61
1.11 0.8 0.62 0.57 1.48 12.16 2.12 2.7 3.74 5.14 6.75 34.39 14.86 10.4 10.76 10.67 10.11 9.27 8.29 7.29 7.91 16.64 16.73 10.44 5.94 3.34 2.35 1.88 1.59 1.47 1.8 5.71 40.98 73.69 33.61 8.24 3.38 2.47 2.14 4.86 11.45 14.79 12.16 8.97 6.52
0.91 0.63 0.46 0.37 1.29 12.68 1.59 1.79 2.46 3.33 4.49 33.94 12.13 6.95 7.19 7.12 6.72 6.13 5.46 4.79 5.66 14.29 14.96 8.97 4.72 2.33 1.47 1.1 0.89 0.83 1.18 4.9 39.59 72.84 32.61 7.52 2.83 1.96 1.67 4.43 11.28 14.76 12.73 9.74 7.33
0.96 0.64 0.4 0.33 1.19 12.48 1.12 0.94 1.08 1.37 1.78 29.05 7.9 2.65 2.71 2.65 2.49 2.33 2.1 1.91 3.01 10.83 11.88 6.88 3.43 1.49 0.92 0.71 0.6 0.63 1.1 4.56 34.4 65.4 29.48 7.16 3.08 2.47 2.27 5.09 11.96 15.32 14.27 11.86 9.28
90
Appendix II.1Continued
F1
F2
F3
F4
F5
F6
F7
F8
F9
F10
F11
F12
15.2 1 13.8
11.5 7 10.4 5 9.35
8.31
9.72
14.3 9 14.4
8.29
625
7.96
7.32
630
7.02
8.4
6.41
7.74
635
6.2
7.32
8.27
5.63
6.69
44.1 2 34.5 5 12.0 9 12.1 5 10.5 2 4.43
55.2 7 42.5 8 13.1 8 13.1 6 12.2 6 5.11
12.3 1 68.5 3 53.0 2 14.6 7 14.3 8 14.7 1 6.46
640
5.42
6.31
7.11
8.18
4.9
5.71
1.95
2.07
2.57
645
4.73
5.43
6.09
7.01
4.26
4.87
2.34
2.75
4.15
4.68
5.22
6
3.72
4.16
3.19
3.58
4.18
655
3.64
4.02
4.45
5.11
3.25
3.55
2.77
3.01
3.44
660
3.2
3.45
3.8
4.36
2.83
3.02
2.29
2.48
2.81
665
2.81
2.96
3.23
3.69
2.49
2.57
8.65
14.5 8 14.8 8 15.5 1 15.4 7 13.2
2.19
650
11.3 5 11.1 2 10.9 5 10.7 6 10.4 2 10.1 1 10.0 4 10.0 2 10.1 1 9.87
13.1 2 13.3 4 13.6 1 13.8 7 14.0 7 14.2
14.5
14.4 2 12.5 6 10.9 3 9.52
14.6 4 13.1 5 11.6 8 10.2 5 8.95
11.8 9 11.6
12.3 6 10.9 5 9.65
17.2 2 15.6 5 14.0 4 12.4 5 10.9 5 9.51
19.4 3 17.7 4 16
620
12.1 9 11.1 2 10.0 3 8.95
2
2.14
2.42
670
2.47
2.55
2.75
3.13
2.19
2.2
7.27
1.52
1.54
1.64
675 680 685 690 695 700 705 710 715 720 725 730 735 740 745 750 755 760 765 770 775 780
2.18 1.93 1.72 1.67 1.43 1.29 1.19 1.08 0.96 0.88 0.81 0.77 0.75 0.73 0.68 0.69 0.64 0.68 0.69 0.61 0.52 0.43
2.19 1.89 1.64 1.53 1.27 1.1 0.99 0.88 0.76 0.68 0.61 0.56 0.54 0.51 0.47 0.47 0.43 0.46 0.47 0.4 0.33 0.27
2.33 1.99 1.7 1.55 1.27 1.09 0.96 0.83 0.71 0.62 0.54 0.49 0.46 0.43 0.39 0.39 0.35 0.38 0.39 0.33 0.28 0.21
2.64 2.24 1.91 1.7 1.39 1.18 1.03 0.88 0.74 0.64 0.54 0.49 0.46 0.42 0.37 0.37 0.33 0.35 0.36 0.31 0.26 0.19
1.93 1.71 1.52 1.48 1.26 1.13 1.05 0.96 0.85 0.78 0.72 0.68 0.67 0.65 0.61 0.62 0.59 0.62 0.64 0.55 0.47 0.4
1.87 1.6 1.37 1.29 1.05 0.91 0.81 0.71 0.61 0.54 0.48 0.44 0.43 0.4 0.37 0.38 0.35 0.39 0.41 0.33 0.26 0.21
6.44 5.83 5.41 5.04 4.57 4.12 3.77 3.46 3.08 2.73 2.47 2.25 2.06 1.9 1.75 1.62 1.54 1.45 1.32 1.17 0.99 0.81
10.5 7 9.18 8.25 7.57 7.03 6.35 5.72 5.25 4.8 4.29 3.8 3.43 3.12 2.86 2.64 2.43 2.26 2.14 2.02 1.83 1.61 1.38 1.12
1.35 1.47 1.79 1.74 1.02 1.14 3.32 4.49 2.05 0.49 0.24 0.21 0.21 0.24 0.24 0.21 0.17 0.21 0.22 0.17 0.12 0.09
1.33 1.46 1.94 2 1.2 1.35 4.1 5.58 2.51 0.57 0.27 0.23 0.21 0.24 0.24 0.2 0.24 0.32 0.26 0.16 0.12 0.09
1.36 1.49 2.14 2.34 1.42 1.61 5.04 6.98 3.19 0.71 0.3 0.26 0.23 0.28 0.28 0.21 0.17 0.21 0.19 0.15 0.1 0.05
(nm) 605 610 615
91
14.1 6 14.1 3 14.3 4 14.5 14.4 6 14 12.5 8 10.9 9 9.98 9.22 8.62 8.07 7.39 6.71 6.16 5.63 5.03 4.46 4.02 3.66 3.36 3.09 2.85 2.65 2.51 2.37 2.15 1.89 1.61 1.32
14.4 7 14.6 2 14.7 2 14.5 5 14.4
Appendix II. 2- High pressure discharge lamps
380 385 390 395 400 405 410 415 420 425 430 435 440 445 450 455 460 465 470 475 480 485 490 495 500 505 510 515 520 525 530 535 540 545 550 555 560 565 570 575 580 585 590 595 600
HP1
HP2
HP3
HP4
HP5
0.38 0.44 0.50 0.54 0.62 0.86 0.76 0.84 0.96 1.04 1.18 1.48 1.58 1.14 2.58 1.34 0.86 4.16 2.60 1.34 0.28 0.30 0.64 3.64 11.25 0.58 0.42 2.68 0.42 0.40 0.44 0.46 0.52 1.02 2.28 3.10 4.16 11.13 50.81 11.23 22.36 59.60 28.51 66.97 37.88
0.53 0.55 0.68 0.74 0.87 1.10 1.19 1.44 1.80 2.05 2.50 3.36 3.21 3.05 4.52 4.01 3.03 5.05 5.61 3.20 2.08 2.22 2.69 4.52 9.94 3.44 3.42 5.45 4.00 4.31 4.67 5.13 5.94 8.62 19.66 25.12 26.91 29.94 33.22 19.76 6.09 0.23 0.08 0.33 4.28
0.63 1.50 2.17 2.51 2.59 4.26 5.26 6.04 8.61 5.92 4.64 7.06 5.26 4.86 4.58 5.24 5.86 5.06 5.63 4.81 4.36 4.10 4.61 5.40 6.19 6.14 5.43 5.91 6.84 6.00 8.24 34.63 28.27 13.00 6.77 6.85 6.66 10.56 14.86 9.59 9.84 19.21 17.08 35.04 30.75
1.96 2.66 3.99 5.16 4.94 9.53 10.89 12.76 17.10 12.11 7.67 17.64 8.99 7.13 6.15 6.75 8.16 6.75 7.06 6.51 5.89 5.23 5.99 6.57 6.72 8.23 6.59 6.43 6.89 6.02 8.23 37.42 20.27 24.79 8.49 6.95 6.36 10.93 11.49 14.09 13.90 9.87 36.67 32.43 21.87
0.07 1.42 2.30 2.99 2.99 5.83 7.62 10.31 12.51 11.12 8.40 10.00 8.43 7.81 8.10 9.06 10.20 9.84 9.81 9.22 9.15 7.89 8.88 9.23 9.91 11.95 9.69 9.68 9.74 8.85 10.88 25.79 16.25 13.47 9.70 10.28 9.78 13.70 16.17 13.20 11.89 13.51 25.67 26.37 20.34
605 610 615 620 625 630 635 640 645 650 655 660 665 670 675 680 685 690 695 700 705 710 715 720 725 730 735 740 745 750 755 760 765 770 775 780
92
23.56 HP1 15.99 21.62 9.37 7.63 6.49 5.67 5.07 4.60 4.08 3.96 3.56 3.36 3.84 3.60 2.74 2.00 1.64 1.52 1.40 1.36 1.30 1.28 1.22 1.20 1.16 1.16 1.16 1.16 1.28 1.20 1.12 6.39 5.57 1.18 1.34
15.22 HP2 25.23 32.40 32.01 31.64 30.74 29.48 28.12 26.99 25.51 24.93 23.60 22.79 23.62 23.03 20.57 18.11 16.67 15.89 15.39 14.97 14.62 14.30 14.03 13.81 13.50 13.34 13.26 13.03 13.14 12.95 12.82 16.61 17.25 12.79 12.98
24.04 HP3 19.78 18.05 14.01 13.37 11.52 10.61 9.97 9.63 8.55 10.13 9.68 8.25 8.69 8.10 7.03 6.99 4.94 4.94 4.30 3.90 3.70 3.51 3.47 3.42 3.26 3.21 3.32 3.16 3.53 4.09 3.32 3.56 3.21 2.97 2.92
14.48 HP4 14.12 11.62 8.83 10.04 8.16 7.58 7.34 7.66 6.25 7.06 9.12 7.16 17.98 7.20 6.51 7.85 4.65 5.06 4.00 3.51 3.25 3.04 3.03 3.04 2.85 2.53 2.95 2.64 3.53 4.68 3.20 4.89 4.41 3.22 2.58
15.41 HP5 13.25 15.42 12.10 13.05 11.57 11.24 10.87 11.27 9.15 10.16 11.33 10.40 16.86 9.50 9.49 12.36 6.90 7.75 6.20 5.09 4.58 4.16 4.21 4.16 3.74 3.51 3.92 3.28 4.75 7.08 4.27 6.92 6.04 3.94 3.12
Appendix II. 3-Relative spectral power distributions of illuminants representing new set of fluorescent lamps.
FL3.1
FL3.2
FL3.3
FL3.4
FL3.5
FL3.6
FL3.7
(nm) 380 385 390 395 400 405 410 415 420 425 430 435 440 445 450 455 460 465 470 475 480 485 490 495 500 505 510 515 520 525 530 535 540 545 550 555 560 565 570 575
0.4780 0.5860 0.7640 0.8460 0.9940 17.2600 2.3300 1.4180 1.5680 1.7180 1.8880 39.3080 2.1880 2.2760 2.3780 2.4740 2.5620 2.6300 2.6780 2.7120 2.7180 2.7120 2.8140 2.6780 2.6580 2.6500 2.7060 2.8480 3.1480 3.6520 4.4560 5.5940 7.1400 29.7960 11.3100 13.7360 15.9980 18.2940 20.2640 24.6320
1.1600 1.3980 1.7400 1.9780 2.3180 18.9060 4.1600 3.3040 3.6600 4.0660 4.4000 46.3800 5.1620 5.5260 5.8200 6.1220 6.3840 6.6220 6.7660 6.9400 7.0040 7.0440 7.1620 7.0280 7.0280 6.9800 6.9400 7.0040 7.2260 7.5840 8.1240 8.9400 9.9260 30.8320 12.4420 13.7840 15.1660 16.3900 17.3900 20.7080
1.7880 2.2420 2.8160 3.2960 3.9260 23.2660 6.4140 5.9440 6.6780 7.3880 8.0660 52.5320 9.3740 9.9580 10.4920 10.9620 11.3620 11.6880 11.9040 12.0240 12.0480 11.9760 11.9760 11.7200 11.5700 11.2580 10.9620 10.6840 10.5400 10.5000 10.6600 10.9780 11.5220 36.5500 13.0540 13.8820 14.6560 15.3120 15.7340 19.1480
0.6920 0.7720 0.8820 0.9020 0.9720 14.2440 1.7440 1.0720 1.1220 1.1820 1.2840 38.5540 1.5540 1.6740 1.8440 2.0360 2.2360 2.4560 2.6760 2.9080 3.1480 3.4180 3.9200 4.2100 4.7920 5.5540 6.5360 7.6580 8.7520 9.5440 10.0540 10.3560 10.5360 33.4720 11.0580 11.3880 11.8600 12.4300 13.0520 16.8520
0.9440 1.1640 1.4360 1.6780 1.9920 11.7720 3.1560 3.0200 3.4600 3.9320 4.4860 35.2000 5.7340 6.3840 7.0760 7.7460 8.3960 8.9840 9.4980 9.9160 10.2420 10.4720 10.7980 10.7560 10.8080 10.7760 10.7240 10.6500 10.6180 10.5760 10.5980 10.6300 10.7340 33.5860 11.1220 11.3640 11.6780 12.0440 12.4420 16.2900
1.1060 1.3260 1.6140 1.8900 2.2560 12.2940 3.5600 3.4940 4.0240 4.6100 5.2740 37.2020 6.7880 7.5960 8.4240 9.2760 10.0600 10.7900 11.3880 11.8960 12.2720 12.5360 12.8680 12.7800 12.7700 12.6480 12.4920 12.2820 12.0940 11.8960 11.7300 11.5860 11.4980 35.0340 11.4540 11.4980 11.5980 11.7520 11.9280 15.7540
0.7580 0.5120 0.3820 0.2840 0.3020 14.7280 1.4740 0.9380 1.0660 1.3500 1.7020 36.3620 2.3420 2.3920 2.4360 2.3800 2.2320 2.2440 1.9660 1.7880 2.4160 10.5120 11.0840 6.3380 3.2060 1.3440 0.9180 0.7340 0.6040 0.6420 0.9800 3.8100 35.5280 69.4680 23.3600 6.3740 3.2740 2.9840 2.8240 5.9000
93
Appendix II.3-Continued
FL3.1
FL3.2
FL3.3
FL3.4
FL3.5
FL3.6
FL3.7
(nm) 580 585 590 595 600 605 610 615 620 625 630 635 640 645 650 655 660 665 670 675 680 685 690 695 700 705 710 715 720 725 730 735 740 745 750 755 760 765 770 775 780
25.9060 23.0100 22.6960 22.0160 20.8560 19.5960 17.9200 16.1480 14.3840 12.7000 11.0920 9.5940 8.2780 7.1000 6.0640 5.1580 4.3680 3.7060 3.1340 2.6440 2.2280 1.8800 1.7300 1.3500 1.1380 0.9740 0.8580 0.7080 0.6060 0.5240 0.4560 0.3880 0.3400 0.3000 0.2720 0.2320 0.9820 0.1900 0.3000 0.1780 0.1360
21.9880 18.3900 17.9700 17.4300 16.6520 15.7860 14.7860 13.7680 12.6880 11.7680 10.7680 9.8860 9.1080 8.3060 7.6620 6.9240 6.3600 5.8040 5.3440 4.8440 4.4380 4.0820 3.8200 3.3580 3.0260 2.7640 2.5260 2.2780 2.0640 1.8420 1.7780 1.5000 1.3420 1.2220 1.0800 0.9600 1.7400 0.8020 0.8180 0.6600 0.5640
19.4440 15.3580 14.6720 13.8660 12.8460 11.7840 10.6760 9.5820 8.5220 7.5480 6.6220 5.8080 5.0580 4.4200 3.8620 3.3680 2.9360 2.5780 2.2740 1.9940 1.7640 1.5720 1.5560 1.2600 1.1340 1.0300 0.9820 0.8620 0.7980 0.7340 0.6860 0.6380 0.5900 0.5500 0.5260 0.4860 1.4280 0.4380 0.5420 0.4000 0.3600
17.8440 15.1580 15.8380 16.5600 17.1520 17.7240 18.2240 18.6860 19.3780 20.2900 20.7300 20.0600 19.5780 19.3180 21.2420 21.9940 23.4980 19.2080 16.0300 14.0840 13.0020 12.0300 11.2080 10.1840 9.2520 8.5200 7.7700 7.0180 6.3460 5.7540 5.1520 4.6320 4.2600 3.7100 3.5480 2.9480 2.5860 2.7260 2.0860 1.9340 1.6140
16.9920 13.7420 14.1400 14.6020 14.9380 15.2520 15.5360 15.7340 16.0280 16.3420 16.4160 15.9960 15.6300 15.3040 15.8400 15.9020 16.2160 14.1520 12.5160 11.3740 10.5660 9.8220 9.2560 8.4480 7.7160 7.1180 6.5520 5.9220 5.3780 4.9060 4.4340 4.0040 3.6900 3.2180 3.1240 2.6200 2.3380 2.4840 1.8860 1.7920 1.4780
16.2520 12.6360 12.8580 13.1560 13.3540 13.5540 13.7200 13.8200 14.0300 14.3380 14.3940 13.9620 13.6100 13.3320 13.9400 14.0740 14.4940 12.4600 10.8900 9.8400 9.1200 8.4800 8.0040 7.2960 6.6560 6.1680 5.6600 5.1300 4.6660 4.2460 3.8580 3.4820 3.2620 2.8420 2.8080 2.3100 2.0780 2.2560 1.7020 1.6480 1.4040
12.2800 17.0100 12.9720 13.0020 10.6340 6.8440 85.4540 40.2200 11.7260 14.4020 17.6380 4.0140 2.6200 2.5840 4.9080 3.1880 2.7120 2.6760 1.6840 1.3140 1.4360 1.9800 2.2940 1.7760 0.6100 4.4080 8.5580 2.8800 0.3760 0.3200 0.2840 0.2100 0.2460 0.3520 0.1480 0.1040 0.8200 0.0920 0.1980 0.0860 0.0000
94
Appendix II. 4 -Relative spectral power distributions of illuminants representing new set of fluorescent lamps.
FL3.8
FL3.9
FL3.10
FL3.11
FL3.12
FL3.13
FL3.14
FL3.15
(nm) 380 385 390 395 400 405 410 415 420 425 430 435 440 445 450 455 460 465 470 475 480 485 490 495 500 505 510 515 520 525 530 535 540 545 550 555 560 565 570 575 580
0.836 0.586 0.458 0.396 0.488 14.140 2.038 1.958 2.642 3.558 4.596 38.286 6.352 6.670 6.774 6.578 6.120 5.656 4.962 4.320 4.680 13.798 14.170 8.458 4.534 2.216 1.532 1.214 1.014 0.976 1.252 4.058 40.934 78.050 27.138 6.914 3.142 2.520 2.210 5.010 10.996
0.754 0.528 0.412 0.374 0.510 14.336 2.410 2.714 3.920 5.466 7.078 42.364 9.804 10.366 10.500 10.146 9.386 8.484 7.432 6.368 6.388 15.548 15.890 9.586 5.248 2.630 1.760 1.340 1.076 0.986 1.212 3.952 43.188 82.426 28.478 6.948 2.952 2.198 1.850 4.700 10.610
0.195 0.000 0.000 0.000 0.539 16.603 1.704 1.454 2.439 3.908 5.495 35.238 13.117 9.599 10.404 10.678 10.701 10.263 9.599 8.927 9.114 17.228 20.456 14.516 8.880 5.339 4.362 3.815 3.369 2.939 2.822 4.393 30.165 78.168 28.562 8.262 2.329 1.602 1.438 4.760 13.500
0.770 0.582 0.512 0.518 0.726 14.908 2.938 3.444 0.998 6.880 8.914 45.616 12.306 13.062 13.270 12.874 11.962 10.848 9.484 8.220 8.008 17.108 17.310 10.694 6.182 3.482 2.512 2.020 1.696 1.548 1.716 4.278 44.024 83.470 29.226 7.334 3.302 2.512 2.162 5.062 10.662
0.324 0.412 0.542 0.622 0.734 14.920 1.776 0.954 0.944 0.944 0.988 30.058 1.216 1.426 1.820 2.352 2.992 3.708 4.496 5.352 6.332 8.186 9.166 9.200 9.052 8.632 8.326 7.950 7.566 7.232 7.050 7.408 11.972 36.706 11.806 9.586 9.734 10.538 11.448 15.550 17.562
0.446 0.584 0.782 0.910 1.092 15.480 2.250 1.538 1.658 1.796 2.002 40.890 2.750 3.376 4.346 5.592 6.984 8.392 9.724 10.866 11.898 13.582 14.002 13.280 12.414 11.390 10.540 9.708 8.960 8.350 7.954 8.100 11.854 36.818 11.812 9.990 10.180 10.902 11.666 15.498 17.156
0.574 0.738 0.974 1.164 1.434 14.442 2.738 2.224 2.486 2.780 3.164 40.198 4.344 5.266 6.570 8.160 9.846 11.478 13.052 14.398 15.650 17.770 18.334 17.362 16.084 14.764 13.824 12.738 11.688 10.714 9.932 9.688 14.512 40.084 13.000 9.498 8.828 8.942 9.202 12.704 14.346
8.784 8.374 7.847 7.144 8.901 17.012 6.588 4.538 4.451 4.978 8.638 41.490 17.773 10.043 11.302 12.590 13.732 14.699 15.548 16.163 16.602 16.748 16.836 16.426 16.045 15.431 14.845 14.113 13.498 12.825 12.239 11.829 12.561 29.749 17.012 10.834 10.775 10.863 11.039 14.347 15.372
95
Appendix II.4-Continued
FL3.8
FL3.9
FL3.10
FL3.11
FL3.12
FL3.13
FL3.14
FL3.15
(nm) 585 590 595 600 605 610 615 620 625 630 635 640 645 650 655 660 665 670 675 680 685 690 695 700 705 710 715 720 725 730 735 740 745 750 755 760 765 770 775 780
16.568 11.644 10.612 8.288 5.052 65.978 32.258 10.838 13.260 14.286 3.148 2.044 2.136 4.064 2.826 2.344 2.350 1.574 1.276 1.446 1.788 1.958 1.452 0.518 3.406 6.738 2.404 0.336 0.300 0.262 0.202 0.232 0.318 0.158 0.134 0.964 0.122 0.250 0.158 0.116
16.380 10.984 9.560 7.330 4.364 57.138 27.988 10.674 12.860 12.808 2.758 1.812 1.966 3.720 2.676 2.198 2.154 1.514 1.238 1.418 1.708 1.754 1.282 0.452 3.004 5.878 2.044 0.284 0.246 0.220 0.168 0.194 0.270 0.130 0.026 0.844 0.020 0.136 0.032 0.000
17.017 14.633 7.934 5.675 4.041 44.290 38.607 14.516 11.108 10.951 4.682 2.095 2.454 4.885 4.518 5.276 4.033 2.368 1.227 1.344 1.204 1.337 0.860 0.219 2.853 5.894 1.829 0.039 0.031 0.031 0.023 0.023 0.016 0.016 0.008 0.008 0.000 0.000 0.000 0.000
16.150 10.712 8.804 6.610 4.052 46.722 23.640 10.332 12.254 11.030 2.590 1.786 1.954 3.424 2.602 2.090 2.066 1.540 1.268 1.470 1.644 1.586 1.140 0.446 2.486 4.848 1.748 0.278 0.246 0.220 0.168 0.188 0.246 0.136 0.104 0.920 0.090 0.208 0.090 0.000
16.110 16.966 17.368 18.288 19.302 21.050 21.348 21.706 21.384 20.308 19.040 17.868 16.590 15.156 13.730 12.340 11.046 9.716 8.580 7.548 6.586 5.930 5.038 4.338 3.856 3.472 2.948 2.572 2.256 1.994 1.776 1.556 1.408 1.260 1.110 2.030 0.900 0.962 0.744 0.656
15.240 15.746 15.790 16.296 16.914 17.550 17.912 18.272 17.800 16.734 15.652 14.638 13.522 12.284 11.098 9.956 8.892 7.826 6.890 6.056 5.274 4.776 4.020 3.480 3.058 2.724 2.336 2.062 1.822 1.606 1.426 1.262 1.134 1.022 0.910 1.812 0.748 0.808 0.628 0.550
12.704 12.826 12.748 13.364 14.130 15.858 16.154 16.718 16.518 15.520 14.494 13.668 12.764 11.714 10.636 9.594 8.628 7.638 6.770 5.988 5.248 4.780 4.066 3.484 3.128 2.868 2.442 2.130 1.886 1.668 1.504 1.346 1.216 1.104 1.000 1.894 0.816 0.886 0.678 0.634
11.771 11.829 12.063 12.239 12.444 12.532 12.649 12.678 12.620 12.503 12.298 12.005 11.683 11.273 10.834 10.307 9.838 9.282 8.725 8.111 7.613 7.086 6.529 5.915 5.475 4.890 4.451 3.982 3.660 3.309 3.016 2.723 2.460 2.196 1.932 1.698 1.493 1.347 1.200 1.083
96
Appendix II. 5 - L.W. research 3-, 4-, 5-, 6-, 7-Band LED
380
3Band 0.000
4Band 0.000
5Band 0.000
6Band 0.000
7Band 0.000
585
3Band 2.695
4Band 23.191
5Band 20.664
6Band 19.430
7Band 19.079
385
0.000
0.000
0.000
0.000
0.000
590
1.684
35.412
31.385
29.361
28.831
390
0.000
0.000
0.000
395
0.000
0.000
0.000
0.000
0.000
595
1.347
33.120
29.526
27.656
27.156
0.000
0.000
600
1.330
19.310
17.876
16.927
16.621
400
0.000
0.000
0.000
0.000
0.000
605
1.406
9.749
10.073
9.811
9.634
405
0.000
410
0.000
0.000
0.000
0.000
0.000
610
1.684
5.555
7.436
7.626
7.488
0.000
0.000
0.000
0.000
615
2.947
4.860
7.954
8.432
8.279
415
0.000
0.000
0.000
0.122
0.048
620
5.473
5.902
10.937
11.804
11.591
420
0.295
0.146
0.091
0.270
0.121
625
12.631
11.457
21.226
22.953
22.538
425
0.547
0.271
0.169
0.545
0.243
630
18.946
16.074
27.412
29.408
28.877
430
1.684
0.833
0.519
1.274
0.589
635
33.681
27.774
31.126
31.478
30.910
435
3.494
1.729
1.076
2.185
1.041
640
42.102
34.717
28.532
26.982
26.494
440
6.736
3.333
2.075
4.347
2.061
645
33.681
27.774
21.615
20.142
19.779
445
10.946
5.416
3.372
8.469
3.901
650
18.946
15.623
12.666
11.936
11.720
450
22.314
11.040
6.874
11.355
5.630
655
12.631
10.415
8.214
7.682
7.543
455
37.892
18.747
11.672
11.804
6.653
660
8.420
6.944
5.361
4.984
4.894
460
40.418
19.997
12.450
7.813
5.236
665
5.473
4.513
3.329
3.054
2.999
465
30.734
15.206
9.467
5.546
3.875
670
2.947
2.430
1.859
1.724
1.693
470
19.619
9.790
6.268
4.103
2.999
675
1.684
1.389
1.038
0.956
0.938
475
14.062
7.082
4.669
3.148
2.539
680
0.968
0.799
0.497
0.431
0.423
480
11.031
5.624
3.848
2.698
2.392
685
0.421
0.347
0.216
0.187
0.184
485
8.757
4.583
3.372
2.511
2.613
690
0.000
0.000
0.000
0.070
0.062
490
8.084
4.374
3.502
2.754
3.385
695
0.000
0.000
0.000
0.057
0.050
495
8.319
4.729
4.215
3.727
4.968
700
0.000
0.000
0.000
0.000
0.000
500
9.431
5.624
5.490
5.387
7.017
705
0.000
0.000
0.000
0.000
0.000
505
12.167
7.437
7.570
7.709
9.409
710
0.000
0.000
0.000
0.000
0.000
510
17.388
10.686
10.976
11.291
12.688
715
0.000
0.000
0.000
0.000
0.000
515
23.914
14.790
15.347
15.964
16.982
720
0.000
0.000
0.000
0.000
0.000
520
32.334
19.997
20.751
21.585
22.170
725
0.000
0.000
0.000
0.000
0.000
525
33.681
20.830
21.615
22.485
22.814
730
0.000
0.000
0.000
0.000
0.000
530
32.334
19.997
20.751
21.585
21.784
735
0.000
0.000
0.000
0.000
0.000
535
28.966
17.914
18.589
19.337
19.429
740
0.000
0.000
0.000
0.000
0.000
540
23.914
14.790
15.347
15.964
15.988
745
0.000
0.000
0.000
0.000
0.000
545
18.862
11.665
12.104
12.591
12.566
750
0.000
0.000
0.000
0.000
0.000
550
14.820
9.165
9.511
9.893
9.843
755
0.000
0.000
0.000
0.000
0.000
555
11.452
7.082
7.349
7.645
7.580
760
0.000
0.000
0.000
0.000
0.000
560
9.094
5.971
6.139
6.352
6.292
765
0.000
0.000
0.000
0.000
0.000
565
7.073
5.763
5.750
5.846
5.777
770
0.000
0.000
0.000
0.000
0.000
570
5.726
6.076
5.884
5.874
5.786
775
0.000
0.000
0.000
0.000
0.000
575
4.951
8.166
7.626
7.437
7.302
780
0.000
0.000
0.000
0.000
0.000
580
3.705
14.442
12.969
12.310
12.088
97
Appendix II. 6- Philips Mixture LEDs & Luxeon white LED
(nm)
PM3016K
PM4000K
PM4100K
PM5500K
PM6500K
Luxeon white
380 385 390 395 400 405 410 415 420 425 430 435 440 445 450 455 460 465 470 475 480 485 490 495 500 505 510 515 520 525 530 535 540 545 550 555 560 565 570 575 580 585 590 595 600 605
0.0000 0.0000 0.0000 0.0000 0.0203 -0.0083 0.0046 0.0314 0.0462 0.0810 0.1016 0.2356 0.6051 1.3455 2.8949 5.8196 10.3688 14.8597 16.5925 15.1322 12.4408 9.8269 7.5118 5.8387 5.2403 5.9282 8.1320 11.6597 15.5302 18.2934 18.9942 17.8488 15.7454 13.4304 10.9786 8.5670 6.5967 5.2771 4.8359 5.6641 8.2608 12.4295 18.8219 24.3798 23.1322 18.0861
0.0000 0.0000 0.0000 0.0000 0.0139 -0.0113 0.0094 0.0348 0.0447 0.0834 0.1080 0.2651 0.6831 1.5360 3.3096 6.6528 11.8700 17.0119 18.9985 17.3337 14.2353 11.2461 8.5963 6.6803 5.9977 6.7924 9.3092 13.3365 17.7765 20.9437 21.7377 20.4276 18.0370 15.3839 12.5617 9.7926 7.5157 5.9460 5.3322 6.0451 8.5403 12.6049 18.8591 24.0643 21.9916 15.6877
0.0000 0.0000 0.0000 0.0000 0.0129 -0.0134 0.0076 0.0346 0.0443 0.0731 0.0872 0.2154 0.5494 1.2233 2.6377 5.3053 9.4660 13.5667 15.1504 13.8297 11.3888 9.0523 7.0301 5.6745 5.4527 6.6456 9.5806 14.0699 18.9491 22.4172 23.3044 21.9204 19.3645 16.5164 13.4786 10.4915 8.0212 6.2788 5.4963 6.0020 8.1943 11.8783 17.6200 22.4135 20.4778 14.6379
0.0000 0.0000 0.0000 0.0000 0.0058 -0.0183 0.0092 0.0356 0.0444 0.0919 0.1266 0.3231 0.8321 1.8836 4.0668 8.1740 14.5868 20.9080 23.3582 21.3206 17.4912 13.8047 10.5296 8.1411 7.2397 8.1131 11.0254 15.7180 20.9226 24.6357 25.5523 24.0139 21.2155 18.0886 14.7475 11.4699 8.7328 6.7315 5.6613 5.7583 7.2991 10.1222 14.6654 18.4323 16.6650 11.6577
0.0000 0.0000 0.0000 0.0000 0.0006 -0.0238 0.0075 0.0356 0.0443 0.0922 0.1280 0.3339 0.8567 1.9393 4.1931 8.4288 15.0414 21.5612 24.0929 21.9999 18.0541 14.2676 10.9240 8.5258 7.7181 8.8327 12.1867 17.5043 23.3812 27.5680 28.6039 26.8928 23.7686 20.2620 16.5042 12.8141 9.7035 7.3512 5.9048 5.4891 6.2345 8.0256 11.1522 13.7690 12.3893 8.6727
0.0000 0.2848 0.2848 0.2848 0.5696 0.8547 1.4244 3.1341 7.4074 11.6667 22.2222 37.0370 35.6111 22.2222 14.8148 7.4074 5.1281 3.7037 2.5630 2.2778 2.2778 2.5630 2.8481 4.5593 5.9815 7.4074 9.9630 11.9630 13.6667 14.8148 15.6704 16.5259 17.0926 17.0926 17.0926 17.0926 17.0926 17.0926 16.5259 15.6704 15.6667 15.1000 14.5296 14.2444 13.3889 12.2507
98
Appendix II.6-Continued
(nm)
PM3016K
PM4000K
PM4100K
PM5500K
PM6500K
610 615 620 625 630 635 640 645 650 655 660 665 670 675 680 685 690 695 700 705 710 715 720 725 730 735 740 745 750 755 760 765 770 775 780
17.0921 21.5885 31.8360 41.8168 41.3706 28.2415 14.6389 7.1169 3.2505 1.5961 0.8172 0.4411 0.2647 0.1644 0.1122 0.0909 0.0698 0.0570 0.0000 0.0000 0.0000 0.0000 0.0000 0.0000 0.0000 0.0000 0.0000 0.0000 0.0000 0.0000 0.0000 0.0000 0.0000 0.0000 0.0000
13.0987 15.3118 21.8167 28.3652 27.9911 19.1064 9.9136 4.8374 2.2224 1.0942 0.5731 0.3120 0.1902 0.1280 0.0927 0.0774 0.0617 0.0504 0.0000 0.0000 0.0000 0.0000 0.0000 0.0000 0.0000 0.0000 0.0000 0.0000 0.0000 0.0000 0.0000 0.0000 0.0000 0.0000 0.0000
12.2550 14.3421 20.4416 26.5753 26.2261 17.9055 9.2935 4.5350 2.0832 1.0238 0.5370 0.2937 0.1770 0.1181 0.0858 0.0711 0.0581 0.0479 0.0000 0.0000 0.0000 0.0000 0.0000 0.0000 0.0000 0.0000 0.0000 0.0000 0.0000 0.0000 0.0000 0.0000 0.0000 0.0000 0.0000
9.4227 10.7300 15.0666 19.4866 19.2098 13.1164 6.8186 3.3483 1.5506 0.7681 0.4155 0.2286 0.1386 0.1028 0.0814 0.0679 0.0533 0.0430 0.0000 0.0000 0.0000 0.0000 0.0000 0.0000 0.0000 0.0000 0.0000 0.0000 0.0000 0.0000 0.0000 0.0000 0.0000 0.0000 0.0000
6.9949 7.9160 11.0493 14.2481 14.0414 9.5934 4.9992 2.4716 1.1537 0.5743 0.3209 0.1790 0.1064 0.0853 0.0728 0.0600 0.0469 0.0376 0.0000 0.0000 0.0000 0.0000 0.0000 0.0000 0.0000 0.0000 0.0000 0.0000 0.0000 0.0000 0.0000 0.0000 0.0000 0.0000 0.0000
99
Luxeon white 11.9667 11.1111 9.9704 9.1185 8.2630 7.4074 6.5519 5.9815 5.4148 4.8444 4.2741 3.9889 3.4185 3.1333 2.5630 2.2778 1.9926 1.7111 1.4244 1.1396 1.1396 1.1396 0.8548 0.8548 0.8548 0.5696 0.5696 0.5696 0.5696 0.2849 0.2849 0.2849 0.2849 0.0000 0.0000
Appendix II. 7 - Relative spectral power distributions of CIE illuminants
(nm) 380 385 390 395 400 405 410 415 420 425 430 435 440 445 450 455 460 465 470 475 480 485 490 495 500 505 510 515 520 525 530 535 540 545 550 555 560 565 570 575
A
D65
C
D50
D55
D75
1.3292 1.4791 1.6400 1.8122 1.9958 2.1913 2.3985 2.6177 2.8490 3.0923 3.3478 3.6153 3.8949 4.1864 4.4897 4.8046 5.1310 5.4687 5.8173 6.1766 6.5464 6.9263 7.3159 7.7150 8.1230 8.5398 8.9647 9.3974 9.8376 10.2846 10.7381 11.1977 11.6628 12.1331 12.6080 13.0870 13.5698 14.0559 14.5447 15.0358
6.9242 7.2479 7.5716 9.5187 11.4659 12.0707 12.6756 12.8104 12.9452 12.4776 12.0100 13.2696 14.5293 15.3704 16.2117 16.2674 16.3231 16.1186 15.9142 15.9878 16.0614 15.5687 15.0760 15.1135 15.1512 15.0437 14.9362 14.7275 14.5189 14.7196 14.9205 14.6930 14.4655 14.4406 14.4158 14.1355 13.8552 13.6013 13.3473 13.3095
4.5380 5.4900 6.5180 7.5870 8.7050 9.8750 11.0840 12.3120 13.4900 14.5490 15.4570 16.1920 16.7080 16.9760 17.0520 16.9970 16.9280 16.9560 17.0240 17.0640 17.0380 16.9030 16.5980 16.0760 15.4160 14.7110 14.0680 13.5880 13.3250 13.3090 13.4770 13.7430 14.0400 14.2950 14.4670 14.5310 14.4800 14.3170 14.0680 13.7720
3.4132 3.7883 4.1635 5.5180 6.8727 7.3747 7.8769 8.1222 8.3677 8.2133 8.0588 9.2440 10.4293 11.2950 12.1607 12.3953 12.6297 12.6824 12.7351 12.9957 13.2565 13.0373 12.8180 13.0801 13.3423 13.4043 13.4662 13.5021 13.5381 13.8845 14.2308 14.1372 14.0435 14.1523 14.2612 14.0998 13.9383 13.7805 13.6226 13.7051
4.5390 4.9220 5.3060 6.8980 8.4900 9.0200 9.5500 9.7600 9.9710 9.7160 9.4600 10.6930 11.9250 12.7880 13.6510 13.8230 13.9950 13.9560 13.9180 14.1150 14.3120 13.9870 13.6620 13.8440 14.0250 14.0260 14.0270 13.9780 13.9280 14.2220 14.5170 14.3700 14.2230 14.2830 14.3440 14.1370 13.9300 13.7360 13.5420 13.5790
9.1730 9.3971 9.6213 11.8192 14.0172 14.7023 15.3876 15.4498 15.5119 14.8445 14.1772 15.4221 16.6671 17.4793 18.2915 18.2464 18.2014 17.8552 17.5092 17.4734 17.4375 16.8174 16.1975 16.1154 16.0333 15.8348 15.6362 15.2895 14.9427 15.0655 15.1883 14.9026 14.6168 14.5215 14.4263 14.0891 13.7519 13.4505 13.1491 13.0525
100
Appendix II.7-Continued
(nm) 580 585 590 595 600 605 610 615 620 625 630 635 640 645 650 655 660 665 670 675 680 685 690 695 700 705 710 715 720 725 730 735 740 745 750 755 760 765 770 775 780
A 15.5287 16.0232 16.5187 17.0146 17.5109 18.0067 18.5019 18.9961 19.4887 19.9795 20.4682 20.9542 21.4374 21.9174 22.3940 22.8665 23.3351 23.7991 24.2586 24.7131 25.1624 25.6064 26.0447 26.4771 26.9036 27.3240 27.7379 28.1453 28.5461 28.9401 29.3271 29.7070 30.0798 30.4454 30.8035 31.1542 31.4976 31.8333 32.1615 32.4821 32.7948
D65 13.2716 12.7796 12.2876 12.3791 12.4706 12.4423 12.4141 12.2825 12.1508 11.8453 11.5398 11.5683 11.5967 11.3423 11.0879 11.1009 11.1139 11.2568 11.3998 11.1231 10.8464 10.2532 9.6600 9.7908 9.9216 10.1114 10.3012 9.4183 8.5354 9.1091 9.6828 10.0431 10.4035 9.6072 8.8109 7.6211 6.4313 7.8437 9.2560 9.0189 8.7818
C 13.4490 13.1230 12.8160 12.5440 12.3350 12.2160 12.1560 12.1280 12.1150 12.1100 12.1010 12.0820 12.0740 12.1000 12.1290 12.1290 12.0880 11.9940 11.8680 11.7300 11.5510 11.3050 11.0290 10.7590 10.4920 10.2260 9.9560 9.6810 9.3920 9.1170 8.8560 8.6360 8.4570 8.2780 8.1410 8.0450 7.9900 7.9760 8.0030 8.0450 8.1270
101
D50 13.7874 13.4097 13.0321 13.3240 13.6160 13.7261 13.8364 13.8205 13.8047 13.5734 13.3420 13.5605 13.7789 13.5566 13.3343 13.5102 13.6860 14.0215 14.3568 14.0871 13.8174 12.9984 12.1794 12.4736 12.7680 12.8575 12.9471 11.8297 10.7121 11.3852 12.0581 12.4811 12.9040 11.9040 10.9039 9.4726 8.0413 9.7996 11.5580 11.2341 10.9100
D55 13.6170 13.1760 12.7370 12.9450 13.1530 13.2030 13.2530 13.1890 13.1250 12.8620 12.5990 12.7310 12.8620 12.6200 12.3770 12.4790 12.5810 12.8340 13.0870 12.8090 12.5310 11.8150 11.0990 11.3190 11.5400 11.6790 11.8190 10.8010 9.7840 10.4150 11.0470 11.4430 11.8400 10.9260 10.0130 8.6840 7.3540 8.9650 10.5770 10.2900 10.0040
D75 12.9561 12.4599 11.9638 11.9796 11.9954 11.9207 11.8459 11.6700 11.4940 11.1616 10.8292 10.8072 10.7854 10.5359 10.2866 10.2537 10.2210 10.2965 10.3720 10.1075 9.8431 9.3120 8.7809 8.8651 8.9492 9.1551 9.3609 8.5614 7.7620 8.2983 8.8345 9.1721 9.5096 8.7861 8.0626 6.9616 5.8607 7.1489 8.4371 8.2289 8.0207
Appendix II. 8 -New LEDs
(nm) 380 385 390 395 400 405 410 415 420 425 430 435 440 445 450 455 460 465 470 475 480 485 490 495 500 505 510 515 520 525 530 535 540 545 550 555 560 565 570 575 580 585 590 595 600
New LED1 0.0000 0.0000 0.0000 0.0000 0.0000 0.0000 0.0000 0.0000 3.0144 8.4449 18.7000 34.3856 72.3840 81.4348 61.5305 42.2246 25.9369 24.1305 15.0797 15.6856 12.0652 13.2695 15.0797 18.7000 25.3348 34.3856 33.1775 37.7216 34.9877 24.1305 22.3203 13.2695 10.8572 9.0471 4.8246 3.6203 3.0144 1.2080 1.2080 1.2080 1.2080 3.0144 3.6203 9.0471 13.2695
New LED2 1.5138 1.5138 1.5138 1.5138 1.5138 1.5138 1.5138 1.5138 1.5138 2.1631 2.3792 3.2438 4.5414 6.9206 10.1644 16.2204 20.1134 23.7894 19.4642 17.7342 12.9758 10.8136 8.6506 6.7045 5.4068 4.7576 4.7576 5.4068 6.3215 9.5159 13.1928 17.7342 23.1410 28.1155 32.8731 32.4408 27.0340 25.3033 18.1665 12.3274 11.4620 6.9206 5.6229 4.5414 3.8930
New LED3 0.0000 0.0000 0.0000 0.0000 0.0000 0.1305 0.0000 0.2612 0.7835 1.9580 3.9175 7.0514 11.0995 14.3641 15.6698 15.4087 14.3641 12.4043 10.8383 9.7934 8.8796 8.0960 9.7934 12.4040 15.6698 17.8898 17.7587 16.9744 16.3218 15.6698 14.3638 13.9722 13.5806 13.0581 12.4053 11.7524 11.3607 11.3607 11.7524 12.4053 13.7112 15.0170 16.4534 16.9757 16.9757
605
(nm) 610 615 620 625 630 635 640 645 650 655 660 665 670 675 680 685 690 695 700 705 710 715 720 725 730 735 740 745 750 755 760 765 770 775 780
102
19.3021 New LED1 27.7471 31.3674 33.1775 30.1631 21.1123 15.0797 9.6529 6.0326 3.0144 2.4123 1.2080 0.0000 0.0000 0.0000 0.0000 0.0000 0.0000 0.0000 0.0000 0.0000 0.0000 0.0000 0.0000 0.0000 0.0000 0.0000 0.0000 0.0000 0.0000 0.0000 0.0000 0.0000 0.0000 0.0000 0.0000
3.0276 New LED2 2.8115 2.3792 2.3792 2.1631 1.9469 1.7299 1.7299 1.5138 1.5138 1.5138 1.5138 1.5138 1.5138 1.5138 1.5138 1.5138 1.5138 1.5138 1.5138 1.5138 1.5138 1.5138 1.5138 1.5138 1.5138 1.5138 1.5138 1.5138 1.5138 1.5138 1.5138 1.5138 1.5138 1.5138 1.5138
16.5840 New LED3 16.3227 15.0170 14.1029 12.4053 11.7524 10.4466 9.1408 8.4878 7.4431 6.6597 5.8761 5.2230 4.5704 4.1786 3.5247 3.0033 2.6115 2.3505 1.9587 0.0000 0.0000 0.0000 0.0000 0.0000 0.0000 0.0000 0.0000 0.0000 0.0000 0.0000 0.0000 0.0000 0.0000 0.0000 0.0000
APPENDIX III-OBSERVERS Appendix III. 1-CIE1931 Colorimetric Observer
(nm)
x (λ )
y (λ )
z (λ )
(nm)
x (λ )
y (λ )
z (λ )
380
0.001
0.000
0.001
590
1.0263
0.757
0.0021
385
0.002
0.000
0.001
595
1.0567
0.6949
0.0018
390
0.004
0.000
0.002
395
0.008
0.000
0.004
400
0.014
0.000
0.007
405
0.023
0.001
0.011
410
0.044
0.001
0.020
415
0.078
0.002
0.036
420
0.134
0.004
0.068
425
0.215
0.007
0.110
430
0.284
0.012
0.207
435
0.329
0.017
0.371
440
0.348
0.023
0.646
445
0.348
0.030
1.039
450
0.336
0.038
1.386
455
0.319
0.048
1.623
460
0.291
0.060
1.747
465
0.251
0.074
1.783
470
0.195
0.091
1.772
475
0.142
0.113
1.744
480
0.096
0.139
1.669
485
0.058
0.169
1.528
490
0.032
0.208
1.288
495
0.015
0.259
1.042
500
0.005
0.323
0.813
505
0.002
0.407
0.616
510
0.009
0.503
0.465
515
0.029
0.608
0.353
520
0.063
0.710
0.272
525
0.110
0.793
0.212
600 605 610 615 620 625 630 635 640 645 650 655 660 665 670 675 680 685 690 695 700 705 710 715 720 725 730 735 740 745 750 755 760 765 770 775 780
1.0622 1.0456 1.0026 0.9384 0.8544 0.7514 0.6424 0.5419 0.4479 0.3608 0.2835 0.2187 0.1649 0.1212 0.0874 0.0636 0.0468 0.0329 0.0227 0.0158 0.0114 0.0081 0.0058 0.0041 0.0029 0.002 0.0014 0.001 0.0007 0.0005 0.0003 0.0002 0.0002 0.0001 0.0001 0.0001 0
0.631 0.5668 0.503 0.4412 0.381 0.321 0.265 0.217 0.175 0.1382 0.107 0.0816 0.061 0.0446 0.032 0.0232 0.017 0.0119 0.0082 0.0057 0.0041 0.0029 0.0021 0.0015 0.001 0.0007 0.0005 0.0004 0.0002 0.0002 0.0001 0.0001 0.0001 0 0 0 0
0.0017 0.0014 0.0011 0.001 0.0008 0.0006 0.0003 0.0002 0.0002 0.0001 0 0 0 0 0 0 0 0 0 0 0 0 0 0 0 0 0 0 0 0 0 0 0 0 0 0 0
530
0.166
0.862
0.158
535
0.226
0.915
0.112
540
0.290
0.954
0.078
545
0.3597
0.9803
0.0573
550
0.4334
0.995
0.0422
555
0.5121
1
0.0298
560
0.5945
0.995
0.0203
565
0.6784
0.9786
0.0134
570
0.7621
0.952
0.0087
575
0.8425
0.9154
0.0057
580
0.9163
0.87
0.0039
585
0.9786
0.8163
0.0027
103
APPENDIX IV-SUBJECTIVE TEST SHEETS Appendix IV. 1- Monitor Set-up Test S1-Monitor set up test table Participant Number: ___________ Please circle your age group: 16-30
31-50
Over 50
Please keep CIED65 as the reference light source (keep on right side), and CIED65 (keep on left side) as the test light source. Please keep K1 value =1.0 and change gamma value from 1.8 to 2.8 at 0.1 interval and give a grade between -5 (poorest) and +5 to represent best. Table IV 1-Monitor Set-up gamma Gamma Reference
1.8
1.9
2
2.1
2.2
2.3
2.4
2.5
2.6
2.7
2.8
Please keep the best gamma value (which you selected above) and change K1 value from 0.8 to 1.2 at 0.1 interval and give an 11 grade, +5 to -5 which from best to poorest. Table IV 2-Monitor Set-up K1 K1 Reference
0.8
0.9
104
1.0
1.1
1.2
Appendix IV. 2-Group I Test S2 Participant Number: ___________ Please circle your age group: 16-30
31-50
Over 50
Grade scale Much better
+3
Better
+2
Slightly better
+1
Test same
0
Slightly worse
-1
Worse
-2
Much worse
-3
Adjectival method table for Group I Please keep the test light source on the left side and keep the reference light source on the right side. Please give a grade for the 14 colour samples in under 52 lamp sources. Use the 7 grade scale (+3 to -3) given above. You do not need to calculate the total score.
105
Table IV 3- Group I test Re A
D50
Test HP1 HP2 LW4BANDLED LW5BANDLED LW6BANDLED LW7BANDLED HP3 F3 F4 F12 FL3.1 FL3.2 FL3.4 FL3.7 FL3.12 FL3.13 PM3016K LED3 F2 F6 F8 F9 F10 F11 FL3.5 FL3.6 FL3.8 FL3.9 FL3.10 FL3.14
7.5R
5Y
5GY
2.5G
10B
5PB
2.5P
10P
106
4.5R
5Y8/10
4.5G
3PB
5YR
5GY4/4
DG
LG
Total
Table IV 4 continued Re D50
Test HP4 HP5 PM4000K PM4100K
D55
FL3.11 PM5500K LuxenWhiteLED
D65
F1 F5 F7 FL3.3 FL3.15 PM6500K
D75
LED1 LED2 LW3BANDLED
7.5R
5Y
5GY
2.5G
10B
5PB
2.5P
10P
107
4.5R
5Y8/10
4.5G
3PB
5YR
5GY4/4
DG
LG
Total
5YR
Appendix IV. 3-Group II Test S3 Participant Number: ___________ Please circle your age group: 16-30
31-50
Over 50
Grade scale Much better
+3
Better
+2
Slightly better
+1
Test same
0
Slightly worse
-1
Worse
-2
Much worse
-3
Adjectival method table for Group II Please keep the test image on the left side and keep the reference image on the right side Please give a grade for the 14 colour samples in test images compare with reference images. Use the 7 grade scale (+3 to -3) given above. You do not need to calculate the total score.
108
Table IV 5-Group II test Reference A
D50
D65
Test
7.5R
5Y
5GY
2.5G
10B
5PB
2.5P
10P
4-Band 5-band 6-band 7-band HP3 FL3.2 FL3.7 FL3.12 FL3.13 F12 PM3016K LED3 F8 F9 FL3.10 FL3.14 F1 F5 F7 FL3.15
109
4.5R
5Y8/10
4.5G
3PB
5YR
5GY4/4
DG
LG
Total
M
Appendix IV. 4-. Group II Test S4 Participant Number: ___________ Please circle your age group: 16-30
31-50
Over 50
Grade scale Much better
+3
Better
+2
Slightly better
+1
Test same
0
Slightly worse
-1
Worse
-2
Much worse
-3
Adjectival method table for Group II Please keep the test image on the left side and keep the reference image on the right side Please give a grade for the 14 colour samples in test images compare with reference images. Use the 7 grade scale (+3 to -3) given above. You do not need to calculate the total score.
110
Table IV 6-Group II test 2 Reference A A 5-BAND A A A A A A HP3 A D50 D50 F8 FL3.14 D50 D65 F1 D65 D65
Test 4-Band 5-band 6-band 7-band HP3 FL3.2 FL3.7 FL3.12 FL3.13 F12 PM3016K LED3 F8 F9 FL3.10 FL3.14 F1 F5 F7 FL3.15
7.5R
5Y
5GY
2.5G
10BG
5PB
2.5P
10P
111
4.5R
5Y8/10
4.5G
3PB
5YR
5GY4/4
DG
LG
Total
M
Appendix IV. 5-Group III Test S5 Participant Number: ___________ Please circle your age group:
16-30
31-50
Over 50
Grade scale Much better
+3
Better
+2
Slightly better
+1
Test same
0
Slightly worse
-1
Worse
-2
Much worse
-3
Adjectival method table for Group III
Please keep the test image on the left side and keep the reference image on the right side Please give a grade for the 14 colour samples in test images compare with reference images. Use the 7 grade scale (+3 to -3) given above. You do not need to calculate the total score.
112
Table IV 7-Group III test Reference
Test
D50
F8
7.5R
5Y
5GY
2.5G
10BG
5PB
2.5P
10P
4.5R
F10 FL3.10 D55
PM5500
D65
F7 FL3.15
F9
F7
F12
F11
F12
HP2
F12
HP3
F12
PM3016K FL3.12
PM4000
F11
PM4000
HP4
F8
Fl3.10
113
5Y8/10
4.5G
3PB
5YR
5GY4/4
DG
LG
Total
Magnitude
APPENDIX V-MATLAB CODE Appendix V. 1- Displaycolour.m
function [R,G,B]=displaycolor(SR0,SG0,SB0) if(SR0>1)&&(SG0>1)&&(01)&&(SB01)&&(01)&&(0