engineering and the study of design patterns is becoming an important feature in
... (Visual Interactive design Patterns), which consists mainly of a Java Applet ...
VIRTUAL LEARNING ENVIRONMENT FOR OBJECT-ORIENTED DESIGN PATTERNS1 Heiko Hirschmüller, Michael Callaghan and Alan O’Callaghan Department of Computer Science De Montfort University The Gateway, Leicester, UK LE1 9BH E-mail:
[email protected],
[email protected],
[email protected]
ABSTRACT Design patterns are a promising new area of software engineering and the study of design patterns is becoming an important feature in the computer science curriculum. Design patterns are usually expressed in a mixture of natural language text and diagrams. The clear communication of these patterns to aid understanding by students and software professionals is therefore central to the success of the pattern movement. This raises the question of exploring alternative forms of representation to enhance understanding. This paper describes a novel form of visualisation that makes use of a combination of virtual reality and hypertext to represent the structure and behaviour of object-oriented design patterns. The solution part of a pattern, which consists of a software fragment of interacting objects, is visualised in an animated 3-dimensional virtual environment. The virtual reality view is embedded in a rich inter-linked hyper-textual description. This represents an extension to traditional software visualisation techniques. The approach is implemented in a prototype called VIP (Visual Interactive design Patterns), which consists mainly of a Java Applet and a virtual reality plug-in, using a World Wide Web browser as a hypertext viewer and runtime environment. A description language for object-oriented design patterns (SVL, Software Visualisation Language) has been developed, which serves to separate the information content from the visualisation. The implementation of 23 patterns shows the generality of the theoretical and practical approach. 1. INTRODUCTION Design patterns are a promising new area of software engineering, in which expert design knowledge is captured and represented for use by other designers. A design pattern consists of a description of a typical software design problem and a general solution. The fundamental structure is based on the pattern approach in architecture (Alexander et al. 1977). All design patterns are extracted from practical experience and are not theoretical constructs (Coplien 1996), which makes them especially valuable as a 1
source of information that is otherwise only slowly accumulated through experience. They are founded on the assumption that there is an objective measurement of a good design (Gabriel 1993). Design patterns are expressed in natural language text and some make use of simple diagrams. The study of design patterns is becoming an important feature in the computer science curriculum, and the clear communication of these patterns to aid understanding by students and software professionals is therefore central to the success of the pattern movement. This calls for the exploration of alternative kinds of visualisation to enhance understanding. The latest advances in computer graphics and processing performance offer the possibility of creating higher dimensional visualisations using virtual reality in contrast to the two available dimensions of paper-based diagrams. Abstract information in particular can benefit from appropriate visualisation. Authors like Benedict (1991) and Wexelblat (1991) offer an analytical foundation for the visualisation of abstract data. One particular area of application is software visualisation, in which more graphical ways of communicating information about the structure and behaviour of computer programs are sought (Price et al 1993). This paper describes a form of software visualisation which focuses on software designs. The object-oriented design pattern collection from Gamma et al. (1995) is used as a basis to develop a new form of visualisation combining virtual reality and hypertext. The goal was not to replace the traditional kind of pattern presentation, but to complement it. In this paper the way in which the visualisation style was arrived at is first described by analysis of the information to be presented. The way in which the four available dimensions (including time) are utilised is then explained and illustrated, and some background on the implementation architecture is provided. The paper concludes with a critical review of the current state of the work and a discussion of proposed further development.
Published in the Conference Proceedings of Euromedia 98, 5-6 January 1998, Leicester, UK, Alexander Verbraeck and Marwan Al-Akaidi (editors), SCS Netherlands
2. THE VISUALISATION CONCEPT The creation of a new interface for communicating the information content of patterns to the user is described below in two steps. First, the information that is of interest to visualise is discussed. Then, the choice of visualisation techniques are discussed on this basis. An objective for the visualisation was to explore the possibility of visualising a part of the pattern in virtual reality and complementing this view with hypertext. This aspect is intended to combine the benefits of both techniques. On the one hand, a presentation of patterns using only interlinked hypertext is possible and has already been shown to be useful (Budinsky et al., 1996). On the other hand, a visualisation of all aspects of the patterns in virtual reality might also be useful by the provision of the extra visual and time dimensions. 2.1 Analysis - Breaking The Pattern Description Into Parts There are two levels of description in Gamma et al.’s design pattern collection. At the overview level all design patterns are presented together, whereas the pattern level is concerned with describing individual patterns in detail. 2.1.1 The Overview And Individual Pattern Level The pattern overview level provides information about the pattern’s name, its classification, brief description (intent) and its relationships to other patterns. Gamma et al. suggest the use of these overviews to search for a pattern appropriate for a particular design situation. Visualisation of the overview level was not addressed in the work discussed here, because more information would be needed to create an advanced visualisation than is already provided in the base material. The pattern level presents the information about a single pattern in a clearly structured form. The sections of a pattern can, according to Gamma et al. (page 3), be categorised into four parts. • Pattern name and intent (text) • Problem description - Motivation section (text) - Applicability section (text)
The main two parts of a pattern are its problem and solution description. The problem description is slightly under represented in contrast to the description of the solution. Alexander’s patterns emphasise the problem they address, whereas the design patterns analysed here describe the solution in more detail. This is a problem which is identified by Gamma et al. (page 356). It needs less cognitive load to match a concrete problem against problem descriptions to find a proper pattern, than thinking every solution through in order to see if a pattern is applicable. Jackson (1994) also raises the issue that software designers are working too much in the solution space and not the problem space. The Structure and Collaboration sections in the patterns book make use of traditional graphical visualisation to support the solution description; in the main, Class Hierarchy-, Object, and Interaction diagrams are used. These three kinds of diagrams are from leading objectoriented methodologies (e.g., OMT from Rumbaugh et al. (1991) or the Booch (1994) method). General short-comings with these diagrams are that several diagrams are needed to provide a whole view of the system. Each diagram contains only a part of the information. It needs some additional cognitive work to join the information of different diagrams (Koike 1993). Furthermore, it is difficult to represent time in these static diagrams, but this is needed to show the interaction dynamics of software. Object diagrams are only snapshots of important, representative moments, whereas in the interaction diagram the time aspect is so essential that it has to be mapped to a spatial dimension (usually to the vertical y-axis). The importance of showing dynamic aspects of object-oriented software was pointed out by Shilling and Stasko (1992) and De Pauw et al. (1994). 2.1.2 Analysis Of The Results Resulting from this analysis, it was identified that the problem description of a pattern is an important part which is mainly expressed in the motivation and applicability section of each pattern. This problem description is underrepresented in this pattern collection (see above) and the existing information is expressed in natural language description. The lack of concrete clear information makes an advanced graphical visualisation difficult.
• Solution description - Structure section (Class Hierarchy, Object Diagram) - Participants section (text) - Collaborations section (Interaction Diagram, text) - Implementation section (text) - Sample code section (text) - Known uses section (text)
The solution description, on the other hand, offers a rich amount of information, which is already partly graphically represented. The short-comings of traditional class or interaction diagrams suggest the exploration of higher dimensional visualisations. Thus, the remainder of this paper focuses mainly on the visualisation of the solution description of design patterns.
• Consequences (text)
2.2 Synthesis - Reassembling The Parts
The Related Patterns section is not discussed here because it is inter-pattern information and belongs therefore to the overview level.
The main concern is to visualise the Structure, Participants and Collaborations section of a pattern by building on traditional diagrams. All other sections of a pattern are
added in hypertext and links between both kinds of visualisations are built, as described later in section 0.
which they are built by showing them close together, directly behind the class.
The main approach is to use traditional diagrams and join them together in a higher dimensional visualisation so that the traditional diagrams are then special cases of the resulting view. This metaphorical use of traditional diagrams maintains familiarity, which should aid learning and enhance understanding. Koike (1993) first introduced this concept. However, he was only concerned with combining a class hierarchy with a method list in a combined three dimensional view to enhance the understanding of polymorphism in an object-oriented class library.
In this way, all three kinds of diagrams are visualised at once2, by maintaining as much familiarity with the two dimensional diagrams as possible.
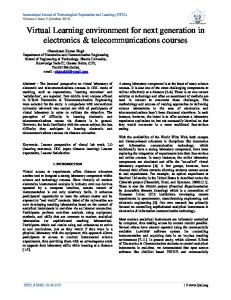
This concept is used as a starting point for the current work and further extended by combining different traditional diagrams in a different way and including the aspect of time as well. 2.2.1 Usage Of The Four Dimensions A visualisation in a virtual environment offers four dimensions (three spatial dimensions and time) in contrast to the two dimensions of paper-based diagrams. The most important diagrams were identified as the class, object and interaction diagrams (section 2.2.1). Figure 1 shows the combined view of all three kinds of diagrams, as represented in the current work.
Y Object of C
X
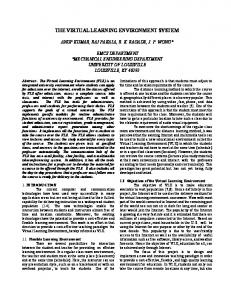
The concrete meaning of the dimensions is thus as follows. The x and y direction is used in the same way as in traditional class hierarchy diagrams. Inheritance relationships are shown mainly in the y-direction, i.e., the superclass is above the subclass. The negative z direction corresponds with the direction of message calls, as in an interaction diagram. The object to which a message is sent is shown right beside the caller. The x direction is mainly used to distinguish classes, but it can be coupled with z dimension, so that the calling direction of messages is along the x direction as well (i.e., diagonal, mainly in the xz-plane). The usage of this semantic as a design heuristic aids a consistent view and offers a beneficial viewing position from diagonal above (as used in Figure 1). From this viewpoint, all information can be seen at once. The next two sections explain the meaning of the used symbols further, as well as the interaction dynamics (i.e., the time dimension). 2.2.2 Static Representation Of Software Parts The three symbols used adopt and extend the traditionally used symbols in a metaphorical way. Figure 2 shows the definition of the symbols.
Object of B
Z
Class A
A
A
Class B
found directly behind (negative z direction) the class from which it was instantiated.
C B
class symbol
A box is the symbol for a class. The box is labeled with the class name at the front. A box with rounded corners symbolises an abstract class (declares some methods without an implementation) or an interface (provides no implementation A ball representsat anall). object. It is spatially always
A
B
The inheritance symbol connects the superclass A with its subclass B.
object symbol C
B
Interaction Diagram View Class Hierarchy View
from-object
through-class to-object The side view shows that a pointer goes from a position below an object to another object. The type of the pointer is determined by the class that the pointer touches.
from-object
interface-class to-object
Figure 1: Usage of the three spatial dimensions
The class diagram is used as the basic supporting structure. The special case of looking along the z-axis to the xy-plane shows the traditional class hierarchy. An interaction diagram is visualised in the yz-plane instead of a method list as in Koike’s proposal, because the main concern is now to incorporate interaction dynamics and not (mainly) to visualise polymorphism as outlined above. An interaction diagram usually shows the time downwards and the interactions from the left to the right. In a dynamic visualisation, time does not need to occupy one of the spatial dimensions, and so only one spatial dimension (i.e., z) needs to be used to incorporate the interaction diagram. The classes of the class hierarchy are, in contrast to Koike’s work, shifted backwards along the z-axis into the third dimension, so that a side view to the yz-plane offers the distinct position of the instances of the classes. The instances itself (balls) are assigned to the classes from
Method-Label
A method call is symbolised by two cones and a label. The first cone goes from the caller object to the class which declares the method. The second cone proceeds then to the called object.
Figure 2: Shapes and semantics of the used symbols
The representation of method calls and pointers exploits the fact that, in contrast to the traditional object or interaction diagrams, both objects and their classes are shown. The meaning of a pointer is that the object which has the pointer (the object from which the pointer starts) knows about the existence and the type of another object. The type 2
Pointer between instances as well as methods are shown as well, but discussed in the next section.
is determined by a class. This class is either the class from which the other object was instantiated or one of its base classes. This class defines the interface and thus the messages (methods) which can be sent to this object. This is visualised in the way that the pointer touches the bottom edge of the class. By looking along the pointer from the position of the object, which has the pointer (i.e., from which the pointer comes), only this class is seen and the pointed object is mainly hidden behind. This corresponds to the meaning, because the “visible” part is the class from which the pointed object was instantiated, as explained above.
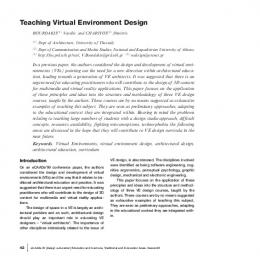
Figure 4: Normal method call (red) and a constructor call (yellow)
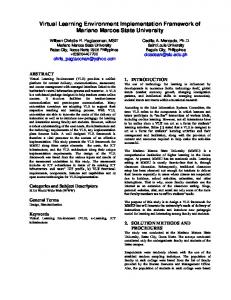
Methods can usually deliver arguments and also return a value. The only kind of variables which are visualised are pointers; an object can pass a pointer as an argument to a method call. This is visualised during the method call by animating the starting position of the pointer (i.e. the blob) being carried on the tip of the method to the called object, where the pointer then takes its position under this object again. So the called object then temporarily has access to this delivered pointer. Return values are visualised in an analogous fashion. Figure 3: Pointer (blue) and a method call (red)
Methods calls make use of the classes in the same way. A method can only be called if there is a pointer to an object, since this determines whether this object is known to the caller object. Methods are declared in a class (in the class through which the corresponding pointer goes). The method symbol visualises this by going through this class as well. This special form of visualisation shows what every object knows about other objects, which also aids the understanding of polymorphism. Additionally, colours are used to support the semantics of the shapes of the symbols and to extend the visualised information. Figure 3 shows a pointer and a method call which are using the abstract base class of an object. 2.2.3 Animating The Interactions Virtual Reality offers the possibility of visualising time in a natural way so that no artificial mappings to a spatial dimension is needed, as is the case in traditional diagrams. This results in an animation which shows the interaction of the object. Methods are visualised as described in the last section. They show the transfer of control as an animation sequence from the caller object through a class to the called object. The called object has the control as long as the method call is visible and thus can call other methods. The return of a method call is shown by reversing the animation, with the method symbol retracting into the caller object.
Two special kinds of methods exist which are differentiated visually from ‘normal’ method calls (Figure 4). The ‘new’ method is a combination between creating a new object (i.e., allocating memory) and initialising the object (i.e., constructor call) and is visualised by a method call through a class into the empty space behind the class. The object then appears at the position to which the method points (memory allocation). The object is then initialised and other methods can be called from it. The ‘new’ method always returns with a pointer to the newly constructed object. The ‘delete’ method symbolises the destructor and the subsequent deallocation of memory. It always delivers the pointer to the deleted object back as an argument. Final method calls can then be done in the destructor, since the object has the thread of control in this moment. The object then vanishes (deallocation of memory) after the deletemethod has returned. Since the control must start somewhere when the program begins, one object has to be created and defined as a starting point. This object represents the entry and exit point of the visualised software. 2.2.4 Complementing The Animated View With Hypertext Descriptions The visualisation as explained in the previous sections covers only the Structure and Collaborations sections of the patterns. The Participants section is closely related to the structure and explains the responsibility of every class briefly in natural language. This explanation can be integrated in the existing visualisation by making the onscreen class representations sensitive, so that clicking on the classes shows the corresponding description in an additional text frame.
Additionally, the interactions are explained with a synchronised textual description. The underlying assumption was that neither a graphical visualisation nor a textual description alone might be sufficient, but the right combination of both could be. So, the interactions are commented in the source code to complement the visualisation. The gap between the textual description and the graphical representation can be reduced by using the same colours for class- and method-names in the text and in the visualisation. So, class names are written in blue, while method names are red. The main concern was to show the solution that the pattern provides, but the pattern description is incomplete without incorporating other sections. They can be used as they are, by directly converting them into a hyper-textual description. 3. IMPLEMENTATION The implementation of a general solution needs to separate the information from the visualisation. The Software Visualisation Language (SVL) was developed to express the structure, interaction dynamics and all text descriptions of a pattern in a computer readable form. The implemented solution (VIP) automatically compiles or interprets the information needed from an SVL definition and generates the visualisation.
other methods that are called and objects that are created or destructed are defined every time the method call itself is defined)3. Additionally, between every interaction expression comments can be included, which are again converted into hypertext descriptions. These descriptions are automatically shown in a synchronised fashion during the simulation. 3.2 VIP -- Visual Interactive Design Patterns The VIP implementation uses Netscape as a running environment and hypertext viewer. A Cosmo Player plug-in (SGI, 1997a) serves as a virtual reality browser which is able to show VRML 2 worlds. The core of the system is the VIP Java Applet which controls the virtual reality view via the VRML External Authoring Interface (EAI) provided in Cosmo Player (SGI, 1997b). This interface enables the programmer to dynamically create, delete and manipulate all possible VRML objects at runtime. The Applet interprets a SVL specification, creates a visualisation of it and controls the animation of the scene and synchronised hypertext description, governed by the commands from the user through the user interface of the Applet. Figure 5 shows all parts and the way in which they work together.
3.1 SVL -- Software Visualisation Language The Software Visualisation Language is designed to enable the definition of the class structure and the interaction dynamics, including object creation and destruction. Additionally, hypertext descriptions can be inserted as comments. Each definition file in this language contains all information to describe exactly one pattern. The definition can be divided into three parts: • the definition of general information in natural language, i.e., Name of the pattern, Classification, Intent, Related Patterns and additional sections as needed. All descriptions are later automatically converted into an interlinked hyper-textual documentation. • the (static) class structure, including inheritance information, method declarations and short descriptions about the classes which are later shown as hypertext documents on demand if a user clicks on the corresponding class in the graphical view. The three dimensional positions of the classes in the graphical view have to be defined by the author as well. All other objects, like instances, methods and pointers, find their locations automatically, dependent to the locations of the classes. • the interactions are specified in the remainder of the file. Method calls with pointers as arguments and/or return values and the creation/destruction of objects can be specified similar to other computer languages. A peculiarity is that the methods are defined inline (i.e.,
Figure 5: Netscape with a hypertext frame (left side) a VRML 2 plug-in (top) and the VIP Applet (bottom)
The proposed use of the tools has furthermore the advantage of an open solution in which the system can be used from anwhere over the World Wide Web. The implementation consists mainly of two tools. A Java application (svl2html compiler) extracts all descriptions out of the SVL definition and converts them into separated interlinked HTML files. This has to be done in advance. The VIP Applet parses the same SVL definition as well, but extracts the information to build the virtual reality visualisation and to build hypertext links to load the
3
The reason for this is that only interactions and no algorithms can be specified in SVL. During one method call, different methods can be called dependent on the used algorithm. This can be simulated in SVL by defining the same method several times differently, which appears then as if an inherent algorithm determines this different behaviour of the method.
appropriate HTML descriptions as needed. This is done at runtime. The chosen approach has proven to be very flexible. Several changes and extensions have been made during the development with little effort. It is possible to implement a pattern in SVL in less than half an hour, which made it easy to implement all 23 patterns from Gamma et al.’s pattern collection4. This has proven the general applicability of the chosen visualisation approach to design pattern visualisation, subject to more extensive user testing. 4. CRITICAL REVIEW AND SUGGESTIONS Small-scale, informal user trials of the current VIP prototype and the implementation of 23 design patterns demonstrated the advantages of an animated threedimensional software simulation in which the user can move around without any constraints and view the objects from any position. However a number of issues arise which are discussed below. 4.1 General issues The readability of text in virtual reality is very bad. The problem arises mainly due to the fact that text is almost never visited parallel to the screen. Moving method labels were therefore implemented which rotate to give the best possible visibility. The same solution for class labels causes collision problems with other objects. As a first improvement, the class labels are shown on the back of the classes as well. The position of classes has to be set by the author of the SVL definition. Layout problems were sometimes the result. Pointers crossed classes or other objects in their way. This could easily be fixed by changing the positions of classes. The introduction of an automatic layout mechanism could free the author from manually setting the positions of classes and checking the scene of collisions.
4.2 Issues which arise from specific patterns The implementation of the 23 patterns confirmed the belief that the same visualisation technique would not necessarily be equally applicable to all patterns. For example, the Factory Method pattern uses the inheritance mechanism so that the superclass calls a method of itself, which is refined in the subclass. This leads to a confusing visualisation of overlapping method calls, because the object calls a method of itself. Other problems arise with the Singleton and Adaptor patterns, involving static methods and multiple inheritance respectively. Generally, these problems can at least be partially resolved by elaborating the textual descriptions. However, some of these issues raise interesting challenges for further development of the prototype. 4.3 Improvements Watching the animation of the visualised software prevents reading the synchronised textual descriptions. This problem is not very severe, since the user can walk through the animation stepwise, which allows the user to switch between reading the description and watching the animation. On the other hand, the usage of synchronised audio could be a very useful enhancement, exploiting the parallelism of multiple sensory channels. This requires further research. The observation that every pattern contains classes with similar responsibilities and attributes has lead to the idea of establishing a small set of shapes and/or colours for classes which would emphasise this further. Classes that are active, creating something, serve as products, etc., could in this way be made directly clear to the user and not only indirectly through the interactions and descriptions. 4.4 Summary
Instances are hidden behind classes, when looking from the front. This prevents following the interaction and decreases the usefulness of the front view position. Resizing or repositioning of classes in relation to their instances is not a perfect solution. This problem is in general not solvable since every object covers other objects behind it. If several pointers go through the same class they use the same position on this class. This leads to visual ambiguity of pointers in some cases. The usage of individual positions on the class would solve the problem. An easy solution was implemented, which associates a different pointer-handleposition on the bottom edge of the class-box with every object behind the class (i.e. instance of the class).
4
Mainly the class structure and interaction dynamics were implemented with much less emphasis on the description, in order to test the virtual reality visualisation.
Several problems can be solved easily by re-programming while others involve further research or have trade-offs. The readability of text in virtual reality and the problems with visualising calls from objects to itself are seen as particularly critical, since there is no obvious solution which can be implemented. The incorporation of synchronised audio and further visualisations of attributes of classes are seen as major improvements. 5. RELATION TO OTHER WORK The core of the visualisation approach presented in this paper is the three-dimensional and animated view of a piece of object-oriented software, which communicates the solution part of a design pattern to the user. There is some work done in the field of software visualisation in two dimensions, but very few in three dimensions (Reiss, 1995). By narrowing the field further down to the visualisation of object-oriented software, there are only a few authors that present related ideas.
De Pauw et al. (1994) came up with a similar analysis of the information of object-oriented programs. Their canonical four dimensional event space has the same information content as that identified and visualised in this work. Additionally, they propose the idea of combining static structures with dynamic information. The end result, however, is quite different from our work due to their focus on the presentation of large amounts of interaction information and their subsequent concern with the compression of information, resulting in their two dimensional chart like views. In contrast, the VIP project started with the goal of showing small object-oriented software fragments in detail.
hide unnecessary elements in the spatial or time dimensions.
Drew and Hendley (1995) developed a visualisation of complex object-oriented systems in virtual reality. Their main concern was to communicate the structure of a system. The core of their approach is the use of an abstract kind of visualisation with an associated physical behaviour, which should make the structure and relations of instances clear. This is quite different from the visualisation proposed in this work.
7. CONCLUSION
Koike (1993) proposed the novel idea of combining a traditional class diagram with a method list as special views, integrated into a three dimensional view. His assumption was that the combination of these two kinds of diagrams communicates additional information about polymorphism. This idea is in contrast to the other work discussed here, and is closer in spirit to our approach. The incorporation of the class hierarchy and the interaction diagram as a metaphor, their combination and the smooth integration of additional information (e.g., pointer) have their roots in Koike’s idea, but the implementation and the resulting visualisation goes far beyond Koike’s proposal. 6. FUTURE Formal evaluation of the benefits to learning and understanding using the proposed approach has not yet been carried out. However, the informal testing seems very promising. A full implementation of the descriptions of more patterns is needed first, in order to do a proper evaluation, and this is in progress at the time of writing. The VIP visualisation approach is not restricted to the presentation of patterns, but can be extended to visualise small object-oriented programs or program fragments for teaching purposes. Incorporation of more information in the visualisation, for example concerning user interaction at runtime, would then be required, as well as a synchronised code view similar to other software visualisation tools (Domingue and Mulholland, 1997). The VIP approach could ultimately be extended to the detailed visualisation of full programs. However, the complexity due to the increase in the number of on-screen elements would raise major usability challenges, and require special manually or automatically controlled filter mechanisms. Benedikt’s (1991) folding and unfolding of (virtual) space or Feiner and Besher’s (1992) “World within Worlds” principles can be used as a starting point to
The next logical step is to give the user the opportunity to not only view but also to manipulate the objects of interest directly in virtual reality, thus creating a program development environment meeting Hutchins et al. (1986)’s directness and engagement requirements for true direct manipulation. The user (i.e. programmer) would work directly with the objects of interest. The ‘gulfs’ between the visual representation and the perception, and between the intention of manipulation and the execution, would be drastically reduced.
The intention was to create a learning and exploration environment for pattern-driven development. The resulting prototype embodies a general mechanism to specify and visualise the static and dynamic structure of object-oriented software fragments and embed this into rich hypertext descriptions. The applicability of this approach for objectoriented design patterns has been proven due to the implementation of 23 design patterns. However, it has been confirmed that some patterns benefit more from the proposed visualisation than others. Some problems were identified and solutions suggested. The result is a promising new way to express design patterns, although it was never intended to replace the traditional expression of design patterns but to complement it. Furthermore, it has to be noted that the approach focuses only on visualising the solution part of design patterns and incorporates descriptions of the other sections of the patterns in the traditional textual manner. The novelty of the described approach to the visualisation of object-oriented software in virtual reality demands further research. It seems to be applicable to the visualisation of small object-oriented programs for teaching purposes, although further developments like incorporation of sound, a synchronised code view and a richer visualisation of more elements of the software, are required. Furthermore, extension of the approach to enable the viewing and manipulation of real, large-scale programs within virtual environments is an exciting prospect, but lies some distance in the future. 8. REFERENCES Alexander, C.; Ishikawa, S. and Silverstein, M. 1977. A Pattern Language. Oxford University Press, New York. Benedikt, M. 1991. "Cyberspace: Some Proposals" In Cyberspace: First Steps, Benedikt, M., eds. MIT Press, Cambridge (Mass.), London, 119-224. Booch, G. 1994. Object-Oriented Analysis and Design with Applications. 2nd edition, Addison-Wesley Budinsky, F. J.; Finnie, M. A.; Vlissides, J. M. and Yu, P. S. 1996. "Automatic code generation from design patterns" IBM Systems Journal, vol. 35, no. 2, 151-171. URL:
http://www.almaden.ibm.com/journal/sj/budin/budinsky.ht ml Coplien, J. O. 1996. "The Column Without a Name: After All, We Can't Ignore Efficiency" C++ Report, vol. 8, no. 7, 71-74. URL: http://www.sigs.com/publications/docs/cppr/9605/cppr960 5.c.noname.html De Pauw, W.; Kimelman, D. and Vlissides, J. 1994. "Modelling Object-Oriented Program Execution" In ECOOP'94 Conference Proceedings, Springer-Verlag, 163-182. URL: http://www.almaden.ibm.com/watson/pv/ecoop94.ps Domingue, J. and Mulholland, P. 1997. "The Internet Software Visualisation Laboratory" In PPIG97, Psychology of Programming Interest Group 9th Annual Workshop Jan. 3rd - 5th 1997 Sheffield Hallam University, Sheffield, UK. URL: http://kmi.open.ac.uk/~john/papers/ppig97.ps.gz Drew, N. and Hendley, B. 1995. "Visualising Complex Interacting Systems" In Proceedings of ACM CHI’95, vol. 2, 204-205. URL: http://www.cs.bham.ac.uk/~nsd/Research/Papers/CHI95/ns d_bdy.html Feiner, S. and Beshers, C. 1990. "Worlds within worlds: metaphors for exploring n-dimensional virtual worlds" In Proceedings of the ACM SIGGRAPH Symposium on User Interface Software and Technology (UIST 90), ACM Press, 76-83. Gabriel, R. P. 1993. "The quality without a name" Journal of Object-Oriented Programming, September 1993, vol. 6, no. 5, 86-89. Gamma, E.; Helm, R.; Johnson, R. and Vlissides, J. 1995. Design Patterns: Elements of Reusable Object-Oriented Software, Addison-Wesley Professional Computing Series. Hutchins, E. L.; Hollan, J. D. and Norman, D. A. 1986. “Direct Manipulation Interfaces” In User-Centered System Design, Norman, D. A. and Draper, S., eds. Lawrence Erlbaum Associates, 87-124. Jackson, M. 1994. "Problems, Methods and Specialisation" IEEE Software, November 1994, vol. 11, no. 6, 57-62. URL: ftp://st.cs.uiuc.edu/pub/patterns/papers/problemframes.ps.gz Koike, H. 1993. "The Role of Another Spatial Dimension in Software Visualisation" ACM Transactions on Information Systems, vol. 11, no. 3, 266-286. Price, B. A.; Baecker, R. M. and Small, I. S. 1993. "A principled taxonomy of software visualisation" Journal of Visual Languages and Computing, vol. 4, no. 3, 211-266. URL: http://www.cs.open.ac.uk/~doc/jvlc/JVLC-Body.html
Reiss, S. P. 1995. "An Engine for the 3D Visualisation of Program Information" Department of Computer Science, Brown University, URL: ftp://ftp.cs.brown.edu/pub/techreports/95/cs95-14.ps.Z Rumbaugh; Blaha; Premerlani; Eddy and Lorensen. 1991. Object-oriented Modelling and Design. Prentice Hall, Englewood Cliffs, New Jersey, USA SGI. 1997a. Silicon Graphics Cosmo Player. URL: http://cosmo.sgi.com/products/player/ SGI. 1997b. Silicon Graphics External Authoring Interface for VRML 2. URL: http://cosmo.sgi.com/products/player/developer/eai/ Shilling, J. J. and Stasko, J. T. 1992. "Animation to Design, Document and Trace Object-Oriented Systems" Technical report GIT-GVU-92-12. Graphics, Visualization, and Usability Center, Georgia Institute of Technology, Atlanta, GA. URL: ftp://ftp.cc.gatech.edu/pub/gvu/tech-reports/9212.ps.Z Wexelblat, A. 1991. "Giving Meaning to Place: Semantic Space", In Cyberspace: First Steps, Benedikt, M. eds. MIT Press, Cambridge (Mass.), London, 255-272.