Virtualization of Synchronized Phasor Measurement Units within Real-Time Simulators for Smart Grid Applications A.T. Al-Hammouri, L. Nordstr¨om, Member, IEEE, M. Chenine, Student Member, IEEE, L. Vanfretti, Member, IEEE, N. Honeth, Student Member, IEEE, and R. Leelaruji, Student Member, IEEE
Abstract—Synchronized phasor measurement units (PMUs) provide GPS-time tagged high-sampling rate positive-sequence voltage and current phasors. When placed in high-voltage substations in power networks, PMUs can provide real-time information that is necessary for the development of Smart Transmission Grid software applications for improving power system monitoring, control and protection. The development of these applications, particularly for use within control centers for on-line purposes, is limited by the availability of and access to real-time PMU data and other information. One attractive approach for application development is the use of real-time simulators to which PMUs can be interfaced as hardware-in-the-loop (HIL) devices to harvest PMU data. However, this approach has technical and economical limitations, which can be tackled by the virtualization of PMU devices. This article describes the development of an entirely software-based synchronized phasor measurement unit for use within real-time simulators that will allow the emulation of a large number of real-life PMUs, which in turn can be used for creating new phasor-based applications.
I. I NTRODUCTION Ynchronized phasor measurement units, or shortly phasor measurement units (PMUs), are digital measurement instruments that by measuring three-phase voltage and current waveforms, are capable of providing high-sampling rate positive-sequence voltage and current phasors that are timetagged by a GPS signal at the measurement source [1], [2], [3]. When placed in high-voltage substations in power networks, PMUs provide important real-time information that can be used within software applications to improve power system monitoring and control [4]. This is why synchronized phasor measurements and their supporting infrastructures are put in the front-line from the transmission system perspective as enablers of the Smart Transmission Grid [5]. This can be
S
Manuscript submitted to the IEEE PES General Meeting 2012. The bulk of this work was performed while the first author was visiting KTH Royal Institute of Technology, Stockholm, Sweden, under an Erasmus Mundus Scholarship Programme. This work was supported in part by the Swedish Power industry via ELEKTRA project 36084, and EKC2 - The Swedish Centre of Excellence in Electric Power Engineering. Luigi Vanfretti is supported by the STandUP for Energy collaboration initiative and the KTH School of Electrical Engineering. A.T. Al-Hammouri is with the Department of Network Engineering and Security, Jordan University of Science and Technology, Irbid 22110, Jordan. E-mail:
[email protected] L. Nordstr¨om, M. Chenine, and N. Honeth, are with the Industrial Information & Control Systems Division, School of Electrical Engineering, KTH Royal Institute of Technology, SE-100 44, Stockholm, Sweden. E-mail:
[email protected],
[email protected],
[email protected] L. Vanfretti and R. Leelaruji are with the Electric Power Systems Division, School of Electrical Engineering, KTH Royal Institute of Technology, Teknikringen 33, SE-100 44, Stockholm, Sweden. E-mail:
[email protected],
[email protected].
evidenced by the initiatives in North America, and elsewhere, that have created specialized systems exploiting measurements from PMUs with the aim of both enabling new PMU-data applications, and increasing the utilization of synchrophasors in power system operations and control [6]. There are different alternatives for developing new applications using synchrophasor data. First, PMU data can be harvested from PMUs installed at transmission or distribution networks through ad hoc WAMS systems [7]. This alternative has the drawback that researchers need to secure nondisclosure-agreements that allow the use of such data. In addition, researchers need to be provided with archives not only of phasor data but also of network topology and other SCADA information [8]. A second drawback of this approach is that the developed applications will be limited to off-line analysis methodologies, simply by the nature of the data. Therefore, with this approach, it is difficult to understand the impact of the supporting ICT infrastructure on power system applications. Hence, on-line applications for real-time monitoring are difficult to develop under this approach. A second alternative for the development of phasor data applications is to use a simulation environment [9], [10]. To properly generate primary data for use with PMUs, the simulation environment needs to provide high-resolution threephase data of voltage and current waveforms [9]. One suitable approach is to use real-time simulators, which can simulate three-phase with high resolution and can allow for the interfacing of hardware-in-the-loop devices. In this case, PMUs can be interfaced either through signal amplifiers or low-voltage outputs of these real-time simulators. This will at the same time allow the interfacing of the PMUs with Phasor Data Concentrators (PDCs) through a Local Access Network (LAN) or a Wide Area Network (WAN) by streaming data through their Ethernet ports using TPC/IP and the synchrophasor data protocol IEEE C37.118 [11]. The major drawbacks of this approach are both technical and economical. The technical limitations are related to the possible number of outputs that can be used to interface PMU devices, which can be very limited; and also the possible limits on small-time step computation due to high number of output signals. The economical constraints are mainly due to cost: for a research laboratory, only a limited number of units can be acquired due to budgeting issues. To overcome these difficulties, the “virtualization” [12], i.e. the development of an entirely software-based synchrophasor measurement unit, presents an attractive approach. Such unit
will be capable of delivering real-time data by harvesting the three-phase voltage and current waveforms from a real-time simulator, computing real-time phasors of voltage and current, and delivering them over a LAN or WAN.
Nyquists criterion, i.e., the cut-off frequency is less than half the sampling frequency.
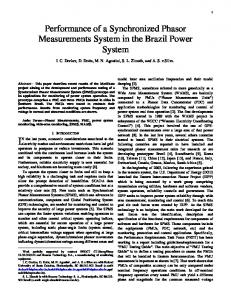
A. Purpose This article discusses the development of a software-based synchronized phasor measurement unit for use within real-time simulators. The soft PMU, is a virtualized device capable of exploiting real-time data generated by a real-time simulator, computing real-time phasors, and delivering them over a communication networks emulator. The continued improvement and development of such virtualized device will enable the development of PMU-data based applications that need large amounts of measurement devices to realize their potential. At the same time, these new devices can be used within a WideArea Monitoring System, which is part of a wider platform for “Smart Transmission Grid”. B. Outline The reminder of this paper is structured as follows. Section II presents an overview of the main characteristics of synchronized phasor-measurement units. Section III presents the overall architecture within which the soft PMU is used, while Section IV describes the implementation details of the soft PMU. In Section V, we validate the correct operation of the soft PMU and present the future planned experiments. Finally, Section VI concludes the paper. II. S YNCHRONIZED P HASOR M EASUREMENT U NITS A Phasor Measurement Unit is a digital measurement device capable of providing high-sampling rate positive-sequence voltage and current phasors that are time-tagged at the source. The time-tags associated with the measurements are calibrated by the Global Positioning System (GPS), thus allowing the synchronization of phasor measurements made across large geographical extensions of a power system. Synchronized measurements allow creates a comprehensive view of the system at the instants when the measurements are taken. A functional diagram of a generic PMU is shown in Fig. 1. Although PMUs are made by many different manufacturers with different designs, this functional diagram encapsulates the important features common to most PMUs. This functional diagram is comprised of three stages: a Measurement Stage, a Computation Stage, and a Communications Stage. In the Measurement Stage, the Analog Inputs corresponding to voltages and currents are obtained from potential transformers (PTs) and current transformers (CTs). All available three-phase voltage and currents are used to determine the positive-sequence phasors. Note that some PMUs are capable of processing current phasors for more than one line current in a single unit. Each of these analog signals is filtered using an anti-aliasing filter and sent to the Computation Stage. The sampling rate will dictate the frequency response of the antialiasing filters, which in most PMUs are analog filters. The selected cut-off frequency of each filter should satisfy the
Second of Century Counter
GPS Receiver Analog Inputs
Phase-Locked Oscillator
Anti-Aliasing Filters
A/D Conversion
Measurement Stage
Fig. 1.
To Digital Network
Phasor Processor
Computation Stage
Communications Interface Communications Stage
Functional Diagram of a Generic PMU
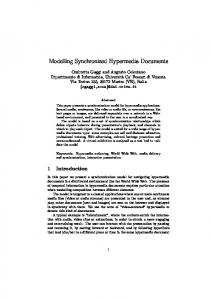
In the Computation Stage, an analog-to-digital converter (A/D) samples the data, i.e., the signals are converted into digital samples. The sampler works in phase-lock with the GPS pulses, with sampling rates ranging from the initial 12 samples per cycle of the early developed devices [13] up to 128 in contemporary ones. A microprocessor receives the sampled data and the GPS time-tags, and calculates the positive-sequence components of all the voltage and current signals using different techniques [1]. In addition to voltage and current measurements, the microprocessor calculates an estimate of the frequency, f , and the rate of change of the frequency, df /dt, using the voltage angle. Positive-sequence phasor estimates are reported at a rate of 10 to 60 samples per second (i.e., interval of 100 to 16.67 ms) Finally, at the Communications Stage, the GPS time-tagged measurements are encapsulated into packets and are transferred by the communication interface via suitable communication links [14] using the standard IEEE C37.118 protocol defined in [11]. Several PMUs also provide local storage for triggered disturbance events. Data streamed from different PMUs is collected in Phasor Data Concentrators (PDCs). It should be noted that many manufacturers are increasingly including software capable of performing PMU functions with other microprocessor based devices [15]. In the next sections, we describe how the soft PMU virtualizes the process described above. III. T HE OVERALL A RCHITECTURE The platform within which the soft PMU is to be used consists of three (sub)systems (see Fig. 2): 1) The eMEGAsim Real-Time Digital Simulator [16]. The eMEGAsim is a commercial highly accurate powersystems simulator. Being a computationally powerful simulator, it can simulate large-scale power systems in real-time. Therefore, it can be used for hardware-inthe-loop simulations (HIL), where some parts of the power system can be real-life physical components [17]. The eMEGAsim simulates power system models that are constructed with the SimPowerSystems Toolbox in R Simulink [18]. 2) Network Emulator (ModelNet) [19]. This is a widearea-network (WAN) emulator. It can be introduced
between two or more machines that are on the same local-area-network (LAN) and are connected via, say, Ethernet, to emulate the behavior of a geographically long, slow, bandwidth-limited, and lossy communication link. Therefore, it can be used to study the effect of network impairments, e.g., delays, losses, and limited bandwidth, on the performance of networked applications and protocols. 3) KTH-PowerIT [20]. This is an application-level platform (or a middleware) that collects real-time synchrophasor measurements from geographically distributed phasormeasurement-units (PMUs). The platform is capable of analyzing the aggregated data off line. This is the user front-end that arranges and presents the synchrophasor measurements in a convenient manner. These three subsystems are combined as in Fig. 2. In the figure, the Physical PMU is an actual PMU device that is connected to the eMEGAsim and is configured to obtain the phasor measurements from the simulation model and sends them out on the network. To an entity connected to the output of this PMU, the phasor measurements appear as if they are coming from an actual power system.
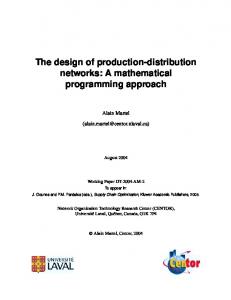
into arbitrary different ones. Nevertheless, the carried data would correspond to the same phasor quantities, and thus will be inappropriate if closed-loop feedback control is to be considered. In light of these constraints, the alternative is to construct R a soft PMU as a Simulink module that executes on the eMEGAsim. The advantage of such choice is that several PMUs can be instantiated and plugged to different parts of the power system, where each act independently of others, i.e., each can measure a different phasor quantity. Also, other protocols that are not supported by the physical PMU can be investigated. In the next section, we elaborate more on the soft PMU. IV. T HE soft PMU The high-level architecture of the soft PMU is depicted in Fig. 3. The soft PMU is divided and structured into two eMEGAsim (Simulink)
IP C37.118 ID = 1 IP = 192.168.0.2
PMU 2
WAN Emulator
IP C37.118 ID = 2 IP = 192.168.0.3
PowerIT
Physical PMU
2
Header
To/From Network
Config. IP
1
Command
PMU 1
PMU n
eMEGAsim
Soft PMU Daemon
3
Fig. 2. The overall integrated simulation-emulation platform: interconnection of three subsystems, the eMEGAsim Real-Time Digital Simulator cascaded with the real-life PMU, the Network Emulator, and the PowerIT.
This setup can be used to study different scenarios, e.g., the influence of the network parameters on the effectiveness and efficiency of the power system monitoring and control. However, there are two limitations for this setup. First, an actual power system is often equipped with tens or hundreds of PMUs. Therefore, having a single or a few PMUs connected to the eMEGAsim provides limited benefits for considering and addressing more involved and interesting scenarios, such as, the existence of multiple measurement flows, and the interaction between different traffic flows belonging to different monitoring or control paths or loops. On the other hand, it is very costly to acquire and connect tens or hundreds of PMUs to the eMEGAsim. Second, with the physical PMU(s), one will be locked-in with the protocols and capabilities supported by the respective PMU (i.e., one will be unable to experiment with other protocols because the physical PMU represents a closed system). One possibility to overcome these limitations would be to cascade the PMU with a separate machine running a program that replicates the PMU output to several streams, and thus producing the illusion of multiple traffic flows with the possibility of tunneling or translating the PMU protocol(s)
C37.118 ID = n IP = 192.168.0.n
Data
Fig. 3. The soft PMU architecture. The soft PMU is divided into two logical components: the measurement part and the communication part, where each part executes on a separate machine. Both parts making up the soft PMU correspond to subsystem 1 in Fig. 2. R different parts. First, there are the Simulink blocks that can be connected to a power system model, which measure the three-phase voltage and current, compute phasors, and estimate other quantities such as the frequency and the frequency rate of change. These blocks are part of the power system simulation model, and thus run on the eMEGAsim (they can be regarded as the Measurement and Computation stages of the generic PMU shown in Fig. 1). Second, there is the soft PMU’s outer interface daemon (i.e., the communication-related side). In this part, the measurements are wrapped into C37.118 protocol messages [11], and then inscribed within TCP or UDP packets that are ultimately put on the wire. This part executes on a separate machine. Every stream from each instance of the R Simulink measurement blocks is wrapped in IEEE C37.118 protocol with a distinct device ID (see [11]). Further, packets belonging to the same stream (i.e., coming from the same R Simulink measurement block) are forwarded with a distinct IP address, thus emulating several physical PMUs; see Fig. 3. This separation in two parts is aligned with newly yetto-be-published IEEE C37.118 protocol that separates the measurement part from that of the data transmission, i.e., the communication part. The communication part is not only responsible for outputting C37.118 data packets but it also implements the full specification of the C37.118 protocol. In essence, it also outputs configuration and header messages
[11], and is able to receive command messages [11] and takes proper actions based on such commands as is explained next.
B. Implementation of the PMU Daemon As mentioned above, this is the communication part of the PMU, i.e., the part that sends and receives C37.118 frames. This corresponds to the Communication Stage shown in the description of a generic PMU in Fig. 1. The PMU daemon obtains the calculated synchrophasor measurements—such as, phasor data (the magnitude and phase components, or the real
Execute (Main Thread) No
Valid ?
A. Implementation of the IEEE C37.118 Protocol We have implemented a library for the C37.118 Protocol [11] using the C++ programming language. There exist only some commercial libraries for the C37.118 [21] but not a single open-source one exists in C++. The only open source library for the C37.118 is the one that is part of the OpenPDC project [22], but unfortunately it was implemented using the C# programming language. The problem with C# is that the library is not portable to other platforms running non-Windows Operating Systems. Our library is tailored for PMU operations. That is, it allows crafting C37.118 messages of the following types: • Data messages carrying measurements data, e.g., current, voltage, and frequency quantities, • Configuration messages carrying meta-data context for the data messages, i.e., carrying details or information about the phasor data in the data messages, and • Header messages carrying user-defined information. Since the PMU only receives command messages (carrying commands to control the operation and configuration of the PMU), and never sends them (see Fig. 3), the library does not support crafting command messages. However, the library contains the necessary functions to check the sanity and validity of command messages. These functions, which are used by the PMU before accepting and executing a received command, allow the validation of the following specific information • The frame is well crafted, uncorrupted, and is sound. That is, the frame starts with a sync byte of 0xAA as the first byte, the frame type is indeed a command frame, the protocol number is the one that the PMU understands, the CRC code carried within the frame is identical to the computed one out from the received frame, and the carried frame size is correct. • The frame is indeed addressed to the respective PMU, i.e., the ID code carried in the frame matches with the ID code assigned to and stored in the PMU. • The intended command is a one that is supported by the PMU. Currently, the PMU understands only four commands, which are [11] – Turn OFF transmission of data, – Turn ON transmission of data, – Send the header frame, – Send the FIRST configuration frame, and – Send the SECOND configuration frame.
Yes
Start PMU Daemon (Main Thread)
Ignore Tacitly (Main Thread)
Set Configurations (Main Thread) Check its Validity (Main Thread) Create Server Socket (Main Thread)
Wait for A Connection (Main Thread)
Yes New Command Frame ? No
No Wait for A New Command Frame (Main Thread) Connection ? Yes
1
Execute (Main Thread) − If turn OFF tx −> Active = false − If turn ON tx −> Active = true − If Send HDR −> send HDR Frame − If Send CFG−1 −> send CFG−1 − If Send CFG−2 −> send CFG−2
Send Data Frames Every 1/Rate Seconds (Child Thread)
Yes Create A Separate Thread (Main Thread)
Is Active ?
2 No
Wait on Active To be True (Child Thread)
Fig. 4. The PMU daemon execution steps. After a given PMU instance accept a remote connection, two threads are executing in parallel: one to accept and execute command and the other to stream out data frames whenever the PMU is put in the active state.
and imaginary components of voltages and currents), other analog data (active and reactive power), digital data (switches’ statuses), and frequency and rate of change of frequency— R from the measurement part, i.e., the Simulink blocks (explained next). Once the daemon starts up, 1) it populates the specific configurations for each PMU from a configuration file. These configurations include the PMU ID code, the IP address and a port number the PMU waits for connection on, whether the PMU is starting active or disabled, the station name, the reporting (transmission) rate, the data format, the number of phasors quantities and their descriptive names, the number of analog quantities and their descriptive names, and the number of digital quantities and their descriptive names [11]. 2) it creates a server socket and starts listening at the given port number waiting for connections (usually coming from a PDC or a custom software designed for consuming the phasor measurements). When a connection is established from a remote entity (e.g., a PDC), • if the PMU is configured to start with an active state, the daemon streams data frames (on a different spawn thread) to the remote entity. Data frames are transmitted at the configured reporting rate. At the same time in the main thread, the daemon waits for arrival of command frames. • if the PMU is configured to start disabled, the daemon stays in standby waiting for an arrival of a command frame.
d ABC to dq0 Transformation
q Discrete High-Sample Rate Three-Phase Waveforms
t
sin (ωt)
cos (ωt)
Generation of Fundamental Frequency Reference
Extraction of Fundamental Frequency Components over a Moving Window
!
! To Comm. Interface
Decimation Filter
! f
!
Conversion to Polar Coordinates
df /dt f¯ ˜ |X|
!
df /dt Discrete Filter (f estimation)
˜ ∠X
Time Reference Set by RTOS Clock
Fig. 5.
Phasor Computations Implemented in the soft PMU
Upon receiving a valid command, the PMU executes the command accordingly, e.g., turning on or off the transmission of data frames. If the command frame is asking for the header or for either of the configuration frames (1 or 2), the PMU crafts the corresponding frame and sends it out to the requester based on the specific configurations assigned to the PMU. If the received command, however, does not pass the validation checks mentioned above, the PMU just ignores the command tacitly after logging it to a file. The logical order of execution of these steps is illustrated with the flowchart in Fig. 4. The two loops 1 and 2 keep executing until the remote entity closes the connection whereby the main thread returns to the ‘wait for a connection’ state. R C. Communication Between Simulink and the PMU Daemon
Since the two parts of the soft PMU, the measurement and communication parts, are running on separate machines, the most convenient method to relay data between them is via the network, e.g., using socket programming. For the measurement part, we utilized specialized socket-communication modules that are provided by the OPAL-RT. These are R Simulink modules that are compliant with the eMEGAsim R simulator unlike the general Simulink modules that are part of the MATLAB’s Instrument Control Toolbox [23]. The utilized modules send data in binary format. At the communication part, custom code is developed to receive and correctly interpret the data from the measurement part. The commuR nicated phasor values are sampled at the Simulink side at the same reporting rate of the PMU configuration, and are sent along with their respective sampling times to the PMU daemon. The communication process between the two parts takes place on the fly, i.e., in real-time. D. Computation of Phasor Measurements from Three-Phase Real-Time Data Up to this point the article has described how the communication end of this software-based PMU was developed and implemented. However, for this new device to properly emulate real-life PMUs, it is necessary to process the threephase waveforms generated by the real-time simulator to produce positive-sequence voltage and current phasors, and other data, which will be transmitted to the communication networks emulator.
A block diagram of the computations process carried out by the soft PMU is shown in Fig. 5. With reference to Fig. 1, this implementation can be considered as the Computation Stage. R blocks The computations are carried out using Simulink compatible with the eMEGAsim real-time simulator. In this implementation, there is no need for the Measurement Stage, which comprises anti-aliasing filters or A/D conversion, as the data is already discretized at a fixed step resolution, e.g. 100 µs time-step. The three-phase real-time simulated voltage and current waveforms are referred to the internal clock of the Real-Time Operating System (RTOS) of the real-time simulator. This same time reference is used to generate fundamental frequency reference signals, sin(ωt) and cos(ωt), which are used to transform the three-phase ABC signals to the dq0 plane. After each sample is transformed into dq0 components, the d and q components are used to generate a window of data. This moving window is used to extract the fundamental frequency component in both d and q signals, and thus generates the real (