vtk.html).Vtk is an open source C++ class library of visualization and imaging algorithms .... If the build or tests fail, the offending party is notified via email.
VIS FILES
Visualization Toolkit Extreme Testing began in 1993 as a sample implementation to illustrate the algorithms and architectures described in the textbook, The Visualization Toolkit: An Object-Oriented Approach to Computer Graphics. Since then, vtk has become a powerful, high quality project, supported by a large global user community — Bill Hibbard and software developers from the U.S., Canada, England and France. Today, vtk has more than 600 C++ classes and about Bill Lorensen, Jim Miller 100,000 executable lines of code. GE Corporate Research and Development From the start, the vtk developers recognized the need to support regression testing. Each evening, at 8 p.m. Eastern Time, a Visualization continues to be an active field computer process wakes up in a research lab of research with new techniques being introin upstate New York and initiates a night of duced yearly. And even well-designed softcompilation and testing on 11 different ware like vtk requires enhancements to its configurations of operating systems and underlying architecture. Regression testing hardware. The subject of this automated compares the results of software after build and test process is the Visualization changes have been made. The purpose is to Toolkit, vtk (http://visualizationtoolkit.org/ identify changes to software that affect the vtk.html). Vtk is an open source C++ class output of the software. The vtk regression library of visualization and imaging algorithms testing compares the images generated by for UNIX, Linux and Windows. The software the visualization algorithms with baseline images that developers of the algorithms have deemed as valid. The image comparison allows control over how well the images must match. Images created using OpenGL need not match pixel for pixel, while those produced by imaging algorithms must strictly match. Until 1998, the vtk regression tests were run manually on an ad hoc basis and prior to a major software release. Figure 1: Changes for the previous day. Each change has a link to the code The time between repository. releases was about six months and Vtk is probably the most widely used visualization system, so I asked Bill Lorensen to contribute a VisFiles column about the reasons for that success. His article describes their automated testing.
8
Computer Graphics
there were hundreds of changes made in the software, either to correct bugs or add new capabilities. Before the release, many of the regression tests would fail and it was an onerous task to determine which of the hundreds of changes had caused the differences between the generated and baseline images. In January 1998, a General Electric Company quality initiative motivated the vtk development team to increase the number of regression tests and perform the tests more frequently and automatically. By the summer of 1998, more than 14 quality procedures were added to the vtk test suite. The procedures were placed under control of a master build and test script that is run nightly at the GE Corporate Research and Development Center.At the end of the tests, the master script generates an html Dashboard that summarizes the results of the quality procedures. The automated, nightly build and test suites proceeds as follows: 1. The Master queries the source code repository to see which files have changed since the previous evening. Summaries of the changes are kept in a file that is accessible from the Dashboard (see Figure 1). 2. The Master initiates a build on each hardware/software configuration and each build stores the compiler logs in separate files. Combinations of operating systems and compilers assure the vtk remains portable every day. 3. The Master runs the regression suite on each configuration. The suite includes image based C++ and tcl/tk tests as well as C++ and tcl/tk text tests. The results are accumulated in logs for each platform. Each test reports whether it passed or failed. One of the test platforms includes a dynamic memor y analysis using a commercial tool applied to each regression test. The dynamic analysis detects memor y leaks and illegal access of memory.The memory analysis log is saved in a file for later processing and reporting. 4. After all the builds and tests complete, the Master scans the build log files for defects.
A defect in a build is either an error or warning. An html summary page is created that contains each defect with several lines before and after the defect to give the message context (see Figure 2). There are some warnings that cannot be avoided. Patterns of these warnings are kept in an exception file so that they can be removed from the summary page. The number of errors and warnings are computed and stored in an html table. 5. The test logs are scanned for defects. A defect in a test occurs when a test fails.The Master records the number of tests that pass and fail in an html table. For each failed image test, a jpeg is made of the generated image, the expected image and the difference of the two (see Figure 3). These are stored in an html page that is linked to from the main dashboard page. 6. Each test, on each platform is timed. A summary of tests that are faster or slower is created and links are made to plots that show the variation over the last 10 days and last 12 weeks (see Figure 4). 7. The test to verify that each class can print itself is run and the total numbers of defects are reported on the main dashboard. A link to the detailed results is created if there are any defects. 8. A coverage analysis of the regression tests is run and the coverage listings are parsed and summaries are created for each source file. All results are available via html links. 9. A commercial style checker is run. The checker is programmed with the vtk programming style guidelines. The results of the style checker are summarized and links placed to the details for each class. 10. The Master scans the dynamic memory analysis log and summarizes the defects.A link to the full log is available from this summary page. 11. The top level Dashboard and all of its link pages are collected and transferred to an external web site. These pages are available to anyone on the Internet (see Figure 5). 12. Documentation is generated from the C++ header files using Doxygen (see Figure 6). These pages are indexed and packaged into a compressed archive. 13. Downloadable files are created as a convenience to users: 13. • Linux RPMs that contain executables, source code and libraries. 13. • A complete installation for Windows 98/NT/2000 as a single executable. 13. • A complete source distribution for both UNIX and Windows 98/NT/2000. 14. Each morning at 9 a.m. EST, a group meets in front of a large screen that projects the nightly dashboard. These
Figure 2: Warning log. Each error or warning is presented with some surrounding context.
Figure 3: Regression test summaries show generated (left), baseline (center) and difference (right) images.
Figure 4: Test performance. Every test is checked for changes in performance over 10 days and 12 weeks.
morning “board meetings” have become a part of our daily work rhythm. The group reviews the changes for the previous day and assesses the state of the system. Simple errors are fixed right away, while more complex problems are dispatched to the appropriate developer(s). The automated nightly testing has allowed the distributed vtk development team to
continue rapid development of vtk while maintaining a high quality, robust toolkit. All developers participate and endorse the test procedures, agreeing to repair any defects within 24 hours of introduction. Each developer has access to all of the test scripts and baseline data so that they can test before they check changes into the repository.When new code is added, the author of the code is
August 2001
9
Figure 5: The vtk Nightly Dashboard.
Figure 6: Generated documentation using doxygen (www.doxygen.org).
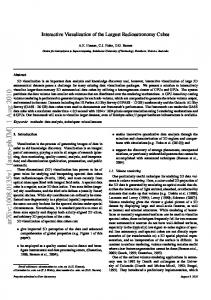
Figure 7: The Continuous Dashboard. If the build or tests fail, the offending party is notified via email.
expected to add tests to the regression suite that cover the new code. The vtk development team has come to rely on the nightly tests to uncover defects as
10
Computer Graphics
soon as they are introduced. The developers, backed by the nightly process, can enhance code written by others and make sweeping changes to the underlying architecture
without fear of breaking any tested portions of the toolkit. The loss of a single night of testing makes the whole development team uncomfortable since we expect the morning Dashboard to show the current status of the system. In September 1999, we added a continuous build/test that monitors the source code repository for changes. Once a change is detected, the continuous build compiles vtk on one operating system/hardware configuration and runs four “smoke” tests to ensure minimal functionality. If the build or any of the tests fail, the process notifies the offending individual(s) via email that they may have broken the build (see Figure 7). Except for two occasions, this extreme form of testing has prevented a compilation or load error from stopping the nightly tests. Since the summer of 1998, more than 700 nightly build/test runs have completed and nearly 4 million test measurements have been collected. Over 2,000 continuous builds have run. The current vtk testing is built on shell scripts, cron jobs and a conglomeration of UNIX tools. The system is very vtk-centric and would be difficult to duplicate outside our development environment. That’s the bad news…the good news is that we are developing a testing framework for an Open Source Project sponsored by the National Library of Medicine (NLM). The testing is for the Insight Toolkit, a C++ class library that will provide segmentation and registration software for biomedical researchers.The new testing architecture, motivated by our successful vtk experience, separates the gathering of test results from the presentation of the results in dashboards. All results are stored with XML tags. The XML (http://www.w3.org/XML/) is converted to HTML using xslt (xml stylesheet language translator, (http://www.w3.org/TR/xslt/). Figure 8 shows a sample of the Insight dashboard. Many people have contributed to the vtk nightly build. We especially thank our colleagues at GE CRD, Majeid Alyassin, Rick Avila, Dan Blezek, Rusty Blue, Jon Davis, Tim Kelliher, Annie Kelly, Steve Linthicum, Tony Pan, Matt Turek and Boris Yamrom. From GE Medical Systems, we thank Dave Deaven, Darin Okerlund, Chris Slack and Bill Stoval. External collaborators have also contributed to vtk testing. From Kitware, we thank Lisa Avila, Charles Law, Ken Martin, Bill Hoffman, Berk Geveci, Amy Henderson and Will Schroeder.The Kitware folks contributed to the testing infrastructure, reducing defects and creating many tests. From Brigham and Womens Hospital, we thank Mike Halle and Simon Warfield for running the test suite remotely. From the Robarts Institute, we
thank David Gobbi for adopting our process so quickly. From the National Center for Supercomputing Applications, we thank Randy Heiland. From the Rutherford Appleton Laboratory, we thank John Biddiscombe. From the Eastman Dental Institute, we thank Timothy Hutton. Lastly, our users have accepted our extreme testing. Some are even confident enough to download a fresh vtk release every morning...after checking the Dashboard of course! Feel free to visit the vtk Dashboards. The Nightly Dashboard at: http://public.kitware.com/vtk/quality/ MostRecentResults/index.html And the Continuous Dashboard at: http://public.kitware.com/vtk/quality/ ContinuousResults/solaris/Continuous Results.html
About the Guest Columnists
Figure 8: The Insight Dashboard. A more portable testing framework.
About the Columnist
Bill Lorensen, Jim Miller GE Corporate Research and Development Niskayuna, NY
Bill Hibbard’s research interests are interaction techniques, data models and distributed architecutures for numerical visualization. He leads the SSEC Visualization Project and is primary author of the Vis5D and VisAD systems. He has degrees in mathematics and computer science from the University of Wisconsin - Madison. Bill Hibbard Space Science and Engineering Center 1225 W. Dayton Street Madison,WI 53706 Tel: +1-608-253-4427 Fax: +1-608-263-6738 Email: hibbard@facstaff. wisc.edu Web: http://www.ssec.wisc. edu/~billh/vis.html
August 2001
11