not well suited to the visualization or analysis of such data. To address these concerns, we have ..... Such a dataset still provides a good 'big picture' of the data ...
Traffic 2004; 5: 411–417 Blackwell Munksgaard
Copyright
#
Blackwell Munksgaard 2004
doi: 10.1111/j.1600-0854.2004.00189.x
Toolbox
VisBio: A Computational Tool for Visualization of Multidimensional Biological Image Data Curtis Rueden, Kevin W. Eliceiri* and John G. White Laboratory for Optical and Computational Instrumentation, University of Wisconsin-Madison, Madison, WI, USA * Corresponding author: K. W. Eliceiri, eliceiri @wisc.edu New laser scanning microscopy techniques enable biologists to acquire larger, more complex image datasets. Emerging imaging modalities such as multispectral, harmonic, and fluorescence lifetime can generate data with six or more dimensions; however, existing software is not well suited to the visualization or analysis of such data. To address these concerns, we have developed VisBio, an application and toolkit for visualization and analysis of multidimensional, biological image data of any dimensionality. Key words: analysis software, imaging, JAVA, multidimensional, open source, VisAD, VisBio, visualization Received 27 January 2004, revised and accepted for publication 11 March 2004
focal planes and time points might be considered 5D. An instrument that reads lifetime values at multiple focal planes generates an alternative 4D data organization. Detectors currently being developed that measure both lifetime and spectral data simultaneously can produce data of six dimensions or higher. By generalizing from ‘4D’ to ‘multidimensional’ we can formulate strategies for handling a multitude of different image data organizations (11). Even so, it can be a daunting task to analyze these multidimensional image datasets. Such data may be so rich in information that repeated reanalysis, focusing on different systems and hypotheses, is necessary. Even simple visualizations of the data may not be trivial. The investigator needs to be able to browse through potentially gigabytes of information, possibly arranged in a nonintuitive fashion, and preferably in real time. In addition, some types of data may be so complex that they are not entirely representable in a three-parameter (RGB or HSV) color model on the computer screen. Special interactive tools must be employed, for example, to display the spectral profiles of a given feature and correlate them with its position within the greater image. Clearly, there is a need for software that can handle these visualization and analysis issues.
Multidimensional Imaging The VisAD Visualization Toolkit Recent advances in laser scanning microscopy techniques have enabled biologists to acquire a variety of larger, more complex image datasets than in the past. While 3D timelapse (‘4D’) recordings were once among the largest, highest-dimensionality datasets collected in microscopy – and while many tools have been developed to analyze such datasets (1–10) emerging imaging modalities such as multispectral, second and third harmonic, and fluorescence lifetime can generate data with six or more dimensions, and existing software is not well suited to the visualization or analysis of such data.
Setting out to create such a software package, we looked for a good foundation on which to build effective tools. Given the enormous variety of biological microscopy data, there are no ‘magic bullet’ algorithms for effective analyses. Rather, there must be a population of algorithms that grows and evolves through use. Investigators need software that can not only visualize the basic data and perform established analysis techniques, but also aid in the development of new analysis, visualization, refinement and distribution strategies.
Fortunately, all of these data types fit a general pattern of multidimensional image data, consisting of a group of images arranged across one or more dimensional axes such as time or focal plane. For example, a typical 4D dataset is made up of images at several focal planes, repeated across multiple time points to form an animated structure in 3D. But this structure is only one type of multidimensional image data. For instance, a detector that collects images across numerous spectral channels,
We have found that VisAD, an open source JAVA component library for interactive and collaborative visualization and analysis of numerical data, is an effective environment for handling these data analysis problems. The VisAD system supports flexible visualization using a data model that can be applied to virtually any numerical data, and that integrates a variety of metadata allowing data from different sources to be combined in visualizations and computations (12,13). VisAD also supports development 411
Rueden et al.
of portable algorithms in JAVA. When algorithms express computations in terms of the VisAD data model, unit conversions, coordinate transforms, resampling, and missing data and error estimate propagation are done implicitly as necessary, enhancing their portability. The generality of VisAD’s design allows it to be used to accomplish challenging biological visualization and analysis goals. Also, because VisAD is written in JAVA, it is compatible with many target platforms, including MAC OS X, WINDOWS and LINUX. However, because VisAD is a general-purpose programming library rather than a single end-user application, it does not fulfill the entire visualization needs of the biologist; rather, it provides a strong initial foundation on which additional tools for meeting those needs can be built. This article discusses our efforts in developing VisBio, a biological, VisAD-based application designed to address the challenges detailed above.
VisBio Core Features The VisBio software is an end-user application built from the ground up to handle visualization and analysis of multidimensional image data, regardless of size or dimensionality. By creating low-resolution thumbnail images during data import, the program conserves memory while providing fluid image browsing and animation capabilities. Other tools include flexible color mapping, semitransparent volume rendering, 3D slicing at arbitrary orientations, 3D measurements, movie capturing, and powerful data export tools. These features are discussed in detail below. Multidimensional visualization (Figure 1) Our primary concern with VisBio was to ensure its ability to comprehend image data of any dimensionality and size, of popular microscopy formats (VisBio currently supports Bio-Rad PIC, Olympus Fluoview, QuickTime movie and multipage TIFF, with other formats under development). The program conceptualizes a group of files as a collection of images distributed across one or more dimensional axes such as time, focal plane or spectra. Since there is no limit to the number of dimensional axes allowed, VisBio can handle multidimensional image data of any dimensionality. In addition, at each dimensional position, the data can possess any number of pixel values, allowing for simple intensity (one value), full RGB color (three values), or more complex configurations (many values). Once a group of files has been specified as a multidimensional dataset, VisBio examines the files and extracts important statistics, creating a ‘raw dataset’. However, since this process does not load the pixel data itself from a disk, raw datasets of any size can be formulated without requiring additional computer memory. The purpose of a raw dataset is to specify the files involved in a particular dataset, and to identify how the images they contain are organized. In doing so, VisBio uses flexible pattern matching logic to parse each 412
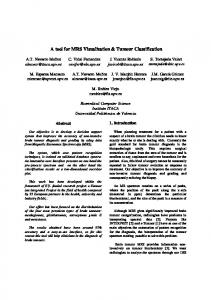
Figure 1: Three-dimensional reconstruction of human embryonic kidney cells (HEK293) transfected with a plasmid construct which expresses GFP. Cells were fixed with 3% paraformaldehyde and observed under a laser scanning confocal microscope. The GFP signal is observed throughout the cell. Dataset provided by Dr. Carrie Graveel, Mr. Lance Rodenkirch and Dr. Peggy Farnham of the University of Wisconsin-Madison.
Traffic 2004; 5: 411–417
VisBio: Visualization of Multidimensional Images
collection of files, so that the user does not have to rename them to conform to any specific naming scheme. To visualize the data, the raw dataset is sampled into a ‘screen dataset’. VisBio loads images from disk at whatever resolution the user desires, using whatever dimensional sampling the user specifies. For example, when working with a dataset with images of 1024 � 1024 pixels each, consisting of 100 time steps and 150 focal planes, it might be useful to subsample so that each image is loaded into memory at 512 � 512 resolution, taking every second time step and every third focal plane. In addition, a particular dimensional axis can be chosen as the ‘stack axis’, and mapped to the Z-axis of VisBio’s 3D display. By default, a ‘focal plane’ axis is chosen, but the user can specify a different axis instead if desired. Lastly, the program allows multiple screen datasets simultaneously, with the ability to quickly switch between them. To conserve memory, VisBio does not load every image into memory at once. Instead, the screen dataset includes a thumbnail for each image. These low-resolution (typically 96 � 96) images are kept in memory for the entire dataset at once, and are used to quickly browse through the data across the dimensional axes. When the user stops at a given dimensional position, VisBio loads the appropriate images in the background from disk, ‘burning them in’ to the display once they are in memory (e.g. in the example above, the 1024 � 1024 images on disk would be loaded, subsampled to 512 � 512, then displayed). Since no more than one image stack is ever in memory simultaneously, VisBio allows fluid browsing and animation of even the largest datasets, while maintaining a reasonable memory footprint. The only disadvantage to this strategy is that creating the thumbnails requires a longer initial loading time during screen dataset formation, since VisBio must sequentially load each image from disk and compute the associated thumbnail. To combat this problem, VisBio maintains a disk cache of thumbnails. The first time VisBio loads a particular dataset, it reads in each image sequentially and creates a thumbnail, saving it to the cache. If the data is later loaded again, VisBio can instantly retrieve the thumbnails from its cache, rather than having to recompute them. Flexible color mapping (Figure 2) As mentioned above, it is possible for there to be several color values (channels) associated with each pixel. VisBio offers several color mapping presets, including RGB and HSV color spaces, as well as composite RGB pseudocolor, including adjustable brightness and contrast. If no such preset suffices, VisBio also provides direct control over each channel’s color table. Volume rendering (Figure 1) By default, VisBio displays the data at a given time step as a stack of images in 3D. However, the program is also Traffic 2004; 5: 411–417
capable of fully reconstructing the data as a 3D structure by rendering it as a semitransparent volume, with useradjustable transparency for optimizing visibility while preserving important data aspects. Arbitrary slicing (Figure 2) Sometimes it is useful to visualize a cross-section of data at an angle contrary to what was sampled. By orienting a plane in the 3D image stack, the user can slice it at any angle and visualize the resulting interpolated data (computed with a tri-linear interpolation algorithm), displayed at an adjustable resolution. Multiple simultaneous slices are allowed, with results superimposed in the 3D window. Animation of these slices is possible at reasonable frame rates, given a fast processor. 3D measurements (Figure 3) VisBio has several tools for performing measurements on the data. Lines may be placed for measuring distances between structures, and markers can be used to flag important event locations. Measurements may lie within a single image plane, or span multiple planes, and can be colored, grouped, and tagged with comments. Results can be exported to a spreadsheet-compatible plain text file for further analysis. Movie capturing Because some multidimensional dataset features are too complex to convey effectively with a single program screenshot, VisBio allows the recording of movie files at a series of display positions in 3D. These movies are often much more effective at conveying the structure of a dataset, since the viewer sees the data from many angles and can better comprehend how things are positioned in 3D, particularly in conjunction with volume rendering. The software allows customization of the transition speed between display positions, as well as the movie’s frame rate. Movies are saved in uncompressed AVI format, since this format has a well-documented specification and is widely supported. The VisBio web site provides some sample movies in compressed QuickTime format (available online at http://www.traffic.dk/video-gallery.asp or at http://www.loci.wisc.edu/visbio/screenshots.html). Data export tools Another advantage of conceptualizing a group of files as a raw dataset is that the dataset can then be exported at a different resolution, to a new file format, or in an alternative image organization. For example, imagine a raw dataset consisting of 50 Bio-Rad PIC files, each containing thirty 512 � 512 images, with each file representing a time point and each image within a file representing a focal plane. To produce a ‘sample’ version of such a dataset, VisBio could export a series of 25 multipage TIFF files, with each file representing a specific focal plane (subsampling to every second focal plane), with each TIFF file containing 413
Rueden et al.
Figure 2: On the left, VisBio performs an arbitrary slicing of a Caenorhabditis elegans embryo undergoing cell fusion and imaged by multiphoton microscopy. The resultant slice is seen superimposed in the 3D display, as well as in the 2D display. The upper right pane shows VisBio’s color mapping tools. Dataset provided by Dr. William Mohler of the University of Connecticut-Farmington.
ten 256 � 256 images (subsampling to every fifth time step). Such a dataset still provides a good ‘big picture’ of the data, while being easier to distribute because of its smaller size and the greater portability of the ubiquitous TIFF file format.
Every aspect of VisBio has been designed with extensibility and connectivity in mind. VisBio harnesses features from both VisAD (discussed above), and from ImageJ, a widely adopted, public domain JAVA image analysis system developed by Wayne Rasband at the NIH (http:// rsb.info.nih.gov/ij/). As a result, VisBio can take advantage of improvements made to either package.
Availability and Extensibility VisBio is freely available online, including source code, from its web site (http://www.loci.wisc.edu/visbio/). Since VisBio is written with the JAVA 2 Platform (http:// java.sun.com/), it runs on any machine that supports JAVA 2. We provide installers for MAC OS X, WINDOWS, LINUX and SOLARIS/SPARC, but VisBio runs on other platforms as well, including HP-UX, IRIX, and AIX. All of these platforms have freely available implementations of both JAVA and JAVA3D, which VisBio uses for its 3D displays. The web site provides more information about which platforms are supported, and how to install the program on a given system. 414
VisBio’s architecture is divided into separate modules (‘logic managers’) that handle its various functions: data import and export, dataset visualization, color settings, measurements, etc. Because VisBio is open source and written in JAVA, scientists familiar with JAVA can take advantage of this architecture to incorporate additional logic managers into the program with ease. In addition, for biologists unfamiliar with or too busy for JAVA programming, VisAD supports a scripting language called Jython (http://www.jython.org/), a JAVA implementation of the widely used, easy to learn Python programming language, and as such Jython scripts that extend VisBio are possible (see below). Traffic 2004; 5: 411–417
VisBio: Visualization of Multidimensional Images
Figure 3: Measurements being performed on a two-photon dataset of a two-cell hamster embryo labeled with a mitochondriaspecific dye, Mitotracker-X-Rosamine. Dataset provided by Dr. Jayne Squirrell of the University of Wisconsin-Madison.
Future Directions VisBio has been in development for over two years, and we believe the current release is a useful and practical tool for multidimensional data visualization and analysis. However, there are many improvements under development. We are currently implementing additional file format support, including Zeiss, Perkin-Elmer and Leica, with Nikon and Deltavision also as eventual goals. Secondly, we recognize the need not only to visualize and analyze large quantities of multidimensional data, but also Traffic 2004; 5: 411–417
to store and organize that data in an effective manner. We have joined an initiative known as the Open Microscopy Environment (OME), an open source project to produce a database-driven system for image data storage and analysis (http://www.openmicroscopy.org/). We have created an initial link between VisBio and the OME system, and we plan to provide a complete feature set for OME connectivity from within VisBio. Moreover, we have been developing wavelet-based data compression algorithms that capitalize on the redundancy present in multidimensional image datasets, obtaining much higher degrees of compression than are available with JPEG or MPEG algorithms (14). We plan to integrate this compression scheme 415
Rueden et al.
Figure 4: Seventeen channel spectral image of a methyl green-stained section of uterus imaged with MP excitation, visualized with a proof-of-concept application written using VisAD. Image chrominance is a weighted function of spectral components in each of 17 channels. In order to maximize the discrimination of nuclei, the contribution of channel 1 (660 nm) is overweighted and channel 5 (600 nm) is negatively weighted. This scheme reveals nuclei as blue and surrounding tissue as green.
with OME and VisBio so that users can roam through large, multidimensional image datasets remotely even when bandwidth is limited. In general, if VisBio understands analysis performed with other software, and vice versa, we simplify the investigator’s job by providing a wider variety of tools for getting the job done. We are working to provide additional connectivity between VisBio and related tools not only with the OME system and our wavelet-based compression tools, but also with the Jython scripting language, and ImageJ’s own popular macro language. More specifically, we have plans to integrate these two scripting languages within VisBio, blending them into a more powerful VisBio scripting language usable by anyone familiar with either Jython or the ImageJ macro language. Lastly, to effectively analyze complex data such as those produced by combined spectral and lifetime imaging, more sophisticated tools are needed. We have several ideas in that direction in particular, we plan to augment VisBio’s color mapping functionality with additional strategies to maximize the chances of finding the most meaningful data. For example, we have had success with a collection of weighted control sliders, one for each spectral channel, which adjust the influence of each channel toward the final colored representation of the data in the screen image (Figure 4). By combining such a tool with lifetime decay exponential curve fitting and color mapping functions, we should be able to delve more deeply into the true nature of these increasingly complex datasets. 416
Acknowledgments We would like to thank Jayne Squirrell, Bill Hibbard and Bill Mohler for their contributions and support.
References 1. Robb RA, Heffernan PB, Camp JJ, Hanson DP. A workstation for multi dimensional display and analysis of biomedical images. Comput Methods Programs Biomed 1987;25:169–184. 2. Van der Voort HT, Brakenhoff GJ, Baarslag MW. Three-dimensional visualization methods for confocal microscopy. J Microsc 1989;153: 123–132. 3. Basinski M, Deatherage JF. Three-dimensional interactive graphics for displaying and modelling microscopic data. Ultramicroscopy 1990;33:167–175. 4. Hird SN, White JG. Cortical and cytoplasmic flow polarity in early embryonic cells of Caenorhabditis elegans. J Cell Biol 1993;121: 1343–1355. 5. Fire A. A four-dimensional digital image archiving system for cell lineage tracing and retrospective embryology. Comput Appl Biosci 1994;10:443–447. 6. Doolittle KW, Reddy I, McNally JG. 3D analysis of cell movement during normal and myosin-II-null cell morphogenesis in dictyostelium. Dev Biol 1995;167:118–129. 7. Chen H, Hughes DD, Chan TA, Sedat JW, Agard DA. Image Visualization Environment: a software platform for all three-dimensional microscopy applications. J Struct Biol 1996;116:56–60. 8. Thomas C, DeVries P, Hardin J, White J. Four-dimensional imaging. computer visualization of 3D movements in living specimens. Science 1996;273:603–607. 9. Mohler WA, White JG. Stereo-4-D reconstruction and animation from living fluorescent specimens. Biotechniques 1998;24: 1006–1010, 1012.
Traffic 2004; 5: 411–417
VisBio: Visualization of Multidimensional Images 10. Uttecht S, Thulborn KR. Software for efficient visualization and analysis of multiple, large, multi-dimensional data sets from magnetic resonance imaging. Comput Med Imaging Graph 2002;26:73–89. 11. Eliceiri KW, Rueden C, Mohler WA, Hibbard WL, White JG. Analysis of multidimensional biological image data. Biotechniques 2002;33: 1268–1273. 12. Hibbard W. VisAD. Connecting people to computations and people to people. Comput Graph (ACM) 1998;32:10–12.
Traffic 2004; 5: 411–417
13. Hibbard W, Emmerson S, Rueden C, Rink T, Glowacki D, Rasmussen N, Fulker D, Anderson J. Collaborative visualization and computation in the earth sciences using VisAD. Conf Interactive Information and Processing Systems for Meteorology, Oceanography, and Hydrology. Preprints. Dallas: Amer Meteor Soc., 1999: 478–480. 14. Stefansson HN, Eliceiri KW, Thomas CF, Ron A, DeVore R, Sharpley R, White JG. Wavelet compression of three-dimensional time-lapse biological image data. Microsc Microanal 2004; in press.
417