VISION-BASED TECHNIQUES FOR REFRACTION ANALYSIS IN APPLICATIONS OF TERRESTRIAL GEODESY Philipp FLACH Dipl.-Eng., Institute of Geodesy and Photogrammetry Geodetic Metrology and Engineering Geodesy Swiss Federal Institute of Technology ETH Hoenggerberg CH-8093 Zurich E-mail:
[email protected] SWITZERLAND
Hans-Gerd MAAS Dr., Faculty of Civil Engineering and Geo Sciences Section of Photogrammetry and Remote Sensing Delft University of Technology Thijsseweg 11 2629JA Delft E-mail:
[email protected] THE NETHERLANDS
KEY WORDS: Image sequences, least squares matching, refraction, air scintillation, digital levelling ABSTRACT: Imaging sensors are increasingly spread in geodetic instruments, because they enable the evaluation of digital image data for the determination of direction and height. Beyond this, the analysis of temporal changes of image data may provide additional information about the refractivity in the atmosphere. Today, the refraction is still the decisive precision limiting factor in geodesy. This paper presents a method for the simultaneous measurement of refraction influences by the analysis of image sequences of a video-theodolite. This analysis is based on the model of optical turbulence which connects the meteorological parameter Cn2 and l 0 (which are required for refraction detection) with fluctuations of the incoming waves, where these fluctuations can be measured by use of image processing techniques like least squares matching. A field experiment using a video-theodolite, a scintillometer, and a digital level is presented to show the potential of this method. ZUSAMMENFASSUNG: In Instrumenten der terrestrischen Geodäsie sind bildbasierende Techniken zunehmend verbreitet, da sie die Auswertung von Bilddaten für die Richtungs- und Höhenbestimmung ermöglichen. Darüber hinaus kann die Analyse der zeitlichen Änderungen von Bilddaten zusätzliche Informationen über die Refraktionsverhältnisse in der Atmosphäre liefern. Heutzutage ist die Refraktion immer noch der entscheidende limitierende Faktor für die Genauigkeit in der Geodäsie. Daher wird in diesem Beitrag eine Methode für das simultane Messen von Refraktionseinflüssen mittels der Analyse von Bildsequenzen vorgestellt. Diese Methode basiert auf dem Modell der optischen Turbulenz, das die meteorologischen Parameter Cn2 und l0 (welche für die Bestimmung der Refraktion nötig sind) mit Fluktuationen der eintreffenden Wellen verknüpft, wobei diese Fluktuationen mittels Bildverarbeitung wie least squares matching gemessen werden können. Ein Feldexperiment mit einem Videotheodoliten, einem Szintillometer und einem Digitalnivellier wird präsentiert, um das Potential dieser Methode aufzuzeigen.
1.
INTRODUCTION
Due to automation of tasks in terrestrial geodesy, image sensors and vision-based techniques have been increasingly spread into numerous geodetic instruments. For instance, CCD-sensors are built into tracking tacheometers and digital levels. Although image sensors and progressing instrument technology in general allow a high degree of precision and automation, the precision in the field of terrestrial measurement methods is still limited on account of atmospheric influences. The refractive influences of the atmosphere are especially crucial in consideration of direction transfer and levelling. So this contribution will focus on these fields of application in terrestrial geodesy. 1.1
Visualization of refraction influences
If optical geodetic measurements are performed in boundary air layers, the propagation of the sight beam is affected by refraction index gradients which are mainly the result of temperature gradients. These gradients simultaneously occur with the turbulent motion of air parcels. The parcels' motion causes the scintillation (i.e., rapid changes of intensity of incoming light rays) of the target image in the telescope of geodetic instruments. The scintillation of the target image can basically be visualized as an image blurring and as displacements of image structures in image sequences. Within the scope of our research work, vision-based techniques are
applied to determine appropriated parameters quantifying turbulent motions to model refraction influences and to reduce them simultaneously with the geodetic observation. 1.2
Previous work
In the field of geometric levelling, the visualization of refraction influences can be realized as the movements of scale lines of the leveling rods as seen through the level telescope. A practical experiment during 48 hours showed quite a good correlation between these movements and the temperature gradient (Kukkamäki, 1950). The fundamental theories of optical propagation in a turbulent medium were mainly developed in Russia (Tatarskii, 1971) and, for this reason, reports of the practical experiments for geodetic applications came from there as well (Vinogradov et al., 1985). Despite the simple visual methods, they achieved a reduction of the systematic distortions up to about 80%. In doing this, the theoretical formulations were not applied entirely rigorously but were partially replaced by semi-empirical modelling. Additionally, it was shown that the vertical temperature profile along the line of sight can be combined with the movements of the target as seen through the telescope (Brunner, 1980). This mostly theoretical research work showed that refraction detection is possible in principle. For the last twenty years, the potential of electronic data processing has been developed to the point that further applications in regard to the derivation of turbulence parameters from geodetic observations could also be carried
out. In doing so, several experimental setups have been developed using either a position-sensitive semiconductor diode (Huiser, Gächter, 1989) or a modified distance meter (Hennes, 1995) or a CCD camera (Casott et al., 1998).
Because polarization fluctuations can be neglected, the propagation of the electric field E (r, t) in atmospheric turbulence is described by the scalar wave equation (HELMHOLTZ equation): ∇ 2E + k 2n 2E = 0
2. 2.1
MODELLING OF REFRACTION INFLUENCES Temperature gradients and optical turbulence
The refractive influences are primarily caused by local gradients in the temperature field of the atmosphere which change the propagation of light. The modeling of these effects is rather sophisticated since the temperature field is to be parameterized in a function of the light propagation path. In the following, we assume that direct measurements of the temperature gradient field are not available because the required precision of temperature measurements lies in the range of some 1/100 °C and, thus, measurements with use of temperature sensors are fairly demanding. An alternative method to determine the vertical temperature gradient is the analysis of optical turbulence which can be detected as the scintillation of a laser beam or scintillation of image structures of targets. The correlation between temperature gradients and optical turbulence can be outlined as follows (Flach, Hennes, 1998a): The subsoil is warmed through IR radiation (sun) so that the lower strata of air have higher temperatures and, therefore, rise. The amount of rising air parcels (eddies) increases with increasing temperature gradient according to the buoyancy principle (cf. section 2.3). During this process, the air parcels behave like eddies producing smaller ones due to friction effects. This eddy formation is usually described with the three-dimensional spectrum of refractive index (Figure 1). As a consequence of the energy distribution of the spectrum of refractive index, the size of the eddies in the boundary air layers varies and this variation influences the propagation of an electro-optic wave. This phenomena can be observed as optical turbulence as follows: At the receiver point, changes in intensity are perceived as scintillation and, additionally, disturbances of the phase front of the wave front are recognized as changes in position of the target. Both effects can be measured by vision-based technologies with use of image sensors which can be built into geodetic instruments. 2.2
(2)
Structure constant Cn2 and wave equation
The changes in refractive index caused by temperature fluctuations are usually smooth random functions of both time and space. Thus, the distribution of the refractive index n (r, t) can only be determined by certain averages 2 or mean quantities, such as the structure constant Cn of the refractive index fluctuations which is defined as Cn 2 (r ) =
n(r1) − n(r2 ) r
2/3
2 -2/3
[m
]
(1)
where r = r1 - r2 and the angle brackets indicate an ensemble average of the refractive index difference at the places r1 and r2, respectively. In the following, we assume that the random process generating the changes in refractive index is isotropic, then Cn2(r) = Cn2(|r|) = Cn2(r).
To solve this equation, the refractive index n(r, t) which is a random variable must be described by use of the power spectrum density of n (turbulence spectrum). 2.3
Turbulence spectrum
The refractive index spectrum Φ n quantifies the optical turbulence in the boundary layer of the atmosphere. The spectrum is modeled by the inner scale l 0 (= smallest diameter of the occurring eddies), the outer scale L 0 (= largest diameter of the occurring eddies) and the structure constant Cn2 of refractive index fluctuations, where the function of the refractive index spectrum the is given by the following formulae (Tatarskii, 1971): Φ n (k ) = 0.033Cn 2k − 11/ 3e − (l 0 ⋅k )
2
/ 5.92 2
(3)
or more elaborated (Hill, Clifford, 1978):
(
Φ n (k ) = 0.033C n 2 k 2 + L 0 − 2
)
− 11 / 6
with k wave number
fΦ (k, l 0 )
(4)
[m-1]
k
= 2π/l
(5)
l fΦ
diameter of eddies [m] decay of refractive index fluctuations in dissipation range [-]
L0
≅ h/2
h
distance from the ground
(Hufnagel, 1978)
[m]
(6)
[m]
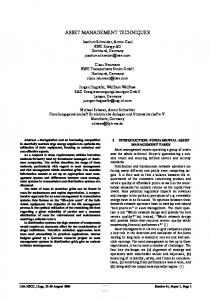
The graphs of these refractive index spectra are plotted in Figure 1. The graph shows that the so-called inertial range includes eddies with a diameter between l 0 (≅ 3 mm) and L 0 (≅ 1 m). In the inertial range, the kinetic energy associated with the larger eddies is redistributed without loss of energy to successively smaller and smaller eddies until finally the diameter is smaller than l 0 and the eddies are dissipated by viscosity. Over the inertial range, the spectrum shows a slope of –11/3 and an offset of Cn2 (logarithmic plot). If the parameters Cn2 and l 0 of the spectrum of refractive index are measured and the level of the line of sight above ground is approximately known, the amount of the turbulent energy fluxes can be determined using the Monin-Obukov-similarity relation (Hill, 1996). Since the turbulent energy fluxes are related with the temperature gradient field, the temperature gradient can be computed integrally along the line of sight and the refraction influences can be corrected (Deussen, 1998). Hereby, it is assumed that the temperature gradient field is statistically homogeneous along the line of sight.
Hill
1.E+00
Tatarskii
Dissipation range
Spektrum Φ n / Cn
2
Inertial range
1.E-04 1.E-08 1.E-12 1.E-16 1.E-20 0.1
1
2π L0
10
100
1000 2π wave number k [m ] l0
10000
Figure 1: Two models of spectrum of refractive index (Dotted line: Not yet confirmed by experiments)
3. 3.1
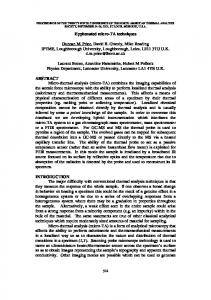
Figure 3: Video-theodolite with integrated CCD-sensor
-1
MEASUREMENT METHODS
Reference measurements
Reference measurements are required for the experiment described below (section 4) to compare the results with measurements performed with image sensors (videotheodolite). The scintillometer is a field-tested instrument to obtain reference measurements for the parameters Cn2 and l 0 of optical turbulence. The instrumental setup of the scintillometer is shown in Figure 2.
The internal reference frame coincides with the plane of the reticle (A) and appears on each video image in order to give reference points for the local coordinate system of the image. A series of 25 images of a static target pattern (e.g. levelling rod) are grabbed within one second and stored by an external field computer. The read-out frequency of 25 Hz suffices if the velocity of crosswind is lower than 0.1 m/s and the diameters of most of the eddies are larger than 8 mm (cf. Figure 1: spectrum of refractive index by Hill). These conditions are normally fulfilled on days with high temperature gradients, i.e., with high refraction influences. For each series, the first image serves as a reference image and the positions of selected image regions of the reference image are determined in the subsequent images with use of least squares matching. The small changes of the position and further parameters determined by least squares matching are the base to calculate the structure constant Cn2 and the inner scale l0. 3.3
Figure 2: Scintillometer to measure optical turbulence (distance R = 86m) The emitter of the scintillometer emits two parallel beams to the receiver. Random fluctuations of refractivity in the atmosphere cause the intensity of the received light power of the two beams to fluctuate randomly over time. The variances and covariances of the respective intensities are evaluated to derive both, the structure constant Cn2 and the inner scale l 0 (Thiermann, 1992). 3.2
Image sensor
As a geodetic field instrument, the video-theodolite Leica TM3000V enables the acquisition of image series which are the starting point for determining the structure con2 stant Cn and the inner scale l0. The video-theodolite has an integrated CCD-array sensor which is configured as shown in Figure 3.
Least squares matching
Least squares matching (LSM) is an area-based matching technique, which is often used in photogrammetry for the establishment of correspondences between images from multiple viewpoints. LSM was first presented by (Förstner, 1984) and (Grün, 1985). It has also been used for the analysis of motion between subsequent frames of sequences of two-dimensional or three-dimensional images (Papantoniou/Dracos, 1989; Maas et al., 1994). LSM tries to determine the six coefficients of an affine transformation for a chosen patch in one image to its transformed counterpart in an other image by minimizing the sum of the squares of gray value differences. Formulated as a least-squares adjustment problem, the technique converges after a few iterations, provided sufficient contrast and good approximate values. The two shift parameters of the affine transformation represent a lateral movement of the patch; the four remaining parameters represent a deformation of the patch. Due to the redundancy in the estimation process, a covariance matrix containing information on standard deviations of the parameters and correlations between parameters is determined simultaneously; this allows for an analysis of the determinability and precision of the transformation parameters. Provided a good image quality, standard deviations of the shift parameters as small as 1/50 of the pixel size can be achieved by LSM. In the application discussed here, the analysis can be reduced to a one-dimensional problem due to the characteristics of the phenomenon and the shape of the image
signal provided by a levelling rod. As a vertical scale parameter is very unlikely to be determinable over the small size of a patch, the analysis can be further reduced to the determination of one shift parameter a in vertical image direction. Hence, the model is given by: g (xi) = f(xi - a) + e(xi),
i = 1, ..., n
Since the gray value functions f and g are not linear, an approximated value for the parameter a0 is required: (8)
where da is the unknown correction to the approximated shift value. Thus, the function f is linearized around the point (xi - a0) and yields to: g ( x i ) = f ( xi − a0 ) − fx i da + e( xi )
(9)
with fx i =
df ( x ) dx
x = x i − a0
ˆ02 = σ
(7)
with f (x) function of the reference image signal g (x) function of the image signal at the corresponding position in the subsequent image xi position of the patch in the subsequent image n number of pixels involved in the matching e (x) random noise with variance σ02
a = a0 + da
If the one-dimensional model really holds and the number2 of observations n is large enough, the noise variance σ0 can be estimated from the residuals of the least squares fit:
(10)
whereby the second order terms are assumed to be negligible. For the n pixels of the patches we then obtain the following linearized equations for each pixel: ∆g ( xi ) = − fx i da + e( xi ) , i = 1, ..., n
(11)
∆g ( xi ) = g ( xi ) − f ( xi − a0 )
(12)
with
daˆ =
∑ ni=1 f xi
(13)
]2
(16)
The noise variance σ02 can also be used as a measure for intensity fluctuations of the incoming light ray since strong changes of the intensity of the light ray increase the differences g (xi ) - f (xi - â) between the reference image and the subsequence image. 3.4
Determining turbulence structure parameters
3.4.1 Amplitude and phase fluctuations To determine the turbulence structure parameters Cn2 and l0 with use of least squares matching, we first need the amplitude fluctuations and phase fluctuations of the incoming light beam. Hereby, we assume smooth perturbations of the incoming waves and neglect polarization effects, so the solution of (2) is given by E = E0 ⋅exp[ χ(r,t ) + i⋅S(r,t )]
(17)
where E0 unperturbed field of the wave log-amplitude of the intensity I of the wave (natural χ logarithm) S phase The amplitude fluctuations and phase fluctuations are expressed by the variances σS2 and σχ2 and can be derived by the results of least squares matching as follows. The variance σS2 can be obtained from small displacements of the image structures (patterns), because the inhomogenities of the refractive index field n(r, t) produce distortions of the wave front. An aperture-confined part receives the distorted incoming wave front and measures the variance of the angle-of-arrival by means of an image sensor. Thus, the following equations are given by geometrical considerations:
Using the least-squares method, the unknown correction da of the shift is given by − ∑ ni=1 f x i ∆g ( x i )
[
1 n ∑ g ( xi ) − f ( xi − aˆ) n − 1 i =1
σS 2 = K 2a 2σα 2
(18)
where
2
σα 2 =
p 2 ⋅σy 2
(19)
f2
and the estimated shift is â = a0 + dâ
As an advantage of least squares matching in general, the full covariance matrix delivered by the matching procedure is available and allows for an analysis of the determinability and precision of the unknown parameters. In the one-dimensional situation, the precision of the total shift is calculated by σaˆ2 =
σ02 ∑
n i =1
fx i
2
2
σy =
(14)
(15)
1 r ˆy , j 2 ∑ σ r j =1
(20)
and ˆy , j 2 = σ
m m 1 ∑ y i , j 2 − 1 ∑ y i , j m − 1 i =1 m i =1
2
(21)
with 2 variance of the angle-of-arrival of the incoming σα wave -1 K wave number (K = 2π/λ) [m ]
The variance σs2 is mainly influenced by eddies, their diameter l being in the range of the aperture of the videotheodolite. To determine the variance σχ2, we may think of the eddies as random lenses. The lenses are randomly distributed in space and have a random size according the turbulent spectrum. Using geometrical optics, we can calculate the amplitude variations of the incoming waves due to these lenses. This leads to deviations in the intensity level of each pixel grabbed by the CCD-sensor which can be expressed by: σχ2 =
1 ln( σ02 + 1) ⋅cRad 4
(22)
Cn 2 =
R∞
aκr σs = 8π K ∫∫κ⋅Φ n (κ )1 − J0 R 00
⋅
κ2r (R − r ) ⋅cos d κd r 2KR
(23)
2
with J0 R r κ
σS 2 = 1.05 ⋅Cn 2a 5 / 3RK 2
(24)
which is a good approximation for σS2. Using (18) and (19), it follows: σα 2 = 1.05 ⋅Cn 2a − 1 / 3R
and
2/3
m ]
12
σ χ / Cn [10
0.08 0.06 0.04 0.02 0.00 0.1
1.0
(25)
10.0 (λR)
1/2
100.0
/ l 0 [-]
Figure 4: Correlation between σχ2/Cn2 and (λR)1/2 l0-1 to determine l0 Under the realistic assumption that the inner scale l 0 is not too small (i.e. l 0 > 3 mm), the results of the integration of (27) lead to the one to one correlation plotted in Figure 4 This correlation is not sensitive to the variation of the outer scale L0 (Flach, Hennes, 1998b). Therefore, it can be stored in a look-up-table and is used to determine l 0.
4.1
Under the assumption (λR)1/2