IEEE SIGNAL PROCESSING LETTERS, VOL. 20, NO. 12, DECEMBER 2013
1253
Visual Attention Based Temporally Weighting Method for Video Hashing Xiaocui Liu, Jiande Sun, Member, IEEE, and Ju Liu, Senior Member, IEEE
Abstract—The video hash derived from the temporally representative frame (TRF) has attracted increasing interests recently. A temporally visual weighting (TVW) method based on visual attention is proposed for the generation of TRF in this paper. In the proposed TVW method, the visual attention regions of each frame are obtained by combining the dynamic and static attention models. The temporal weight for each frame is defined as the strength of temporal variation of visual attention regions and the TRF of a video segment can be generated by accumulating the frames by the proposed TVW method. The advantage of the TVW method is proved by the comparison experiments. The video hashes used for comparison are derived from the TRFs, which are generated based on the proposed TVW method and other existing weighting methods respectively. The experimental results show that the TVW method is helpful to enhance the robustness and discrimination of video hash. Index Terms—Temporal weight, video copy detection, video fingerprint, video hash, visual attention.
I. INTRODUCTION
S
PATIO-TEMPORAL VIDEO hashes have been more and more popular as they can identify a video via both the spatial and temporal features [1]–[9]. Among them, the video hashes derived from the temporal representative frames (TRF) have received increasing interests in recent years [2], [4], [7]–[9]. The so-called TRF is generated by accumulating the frames in a video segment with their corresponding weights. Yang et al. proposed to obtain the TRF through averaging the pixels’ values of each frame along time direction, which means each frame has the uniform weight [2]. Esmaeili et al. generated the TRF by accumulating the frames with decreasing weights , where is the frame order. Furthermore along time, i.e. they proved that their proposed weighting method is better than the uniform weighting method [8]. Roover et al. [4], Kim et al. [7] and Harvey et al. [9] utilized the winner-take-all (WTA) principle into the weighting method. They set the weights for Manuscript received August 29, 2013; accepted October 08, 2013. Date of publication October 23, 2013; date of current version October 25, 2013. This work was supported by the National Basic Research Program of China under Grant 2009CB320905 and by the National Natural Science Foundation of China under Grant 61001180.. The associate editor coordinating the review of this manuscript and approving it for publication was Prof. Zhu Liu. (Corresponding author: J. Sun). X. Liu is with the School of Information Science and Engineering of Shandong University, Jinan 250100, China (e-mail:
[email protected]). J. Sun and J. Liu are with the School of Information Science and Engineering of Shandong University, Jinan 250100, China and also with the Hisense State Key Laboratory of Digital-Media Technology, Qingdao 266061, China (e-mail:
[email protected];
[email protected]). Color versions of one or more of the figures in this paper are available online at http://ieeexplore.ieee.org. Digital Object Identifier 10.1109/LSP.2013.2287006
the keyframes be 1 and for the other frames be 0. That is to say, these video hashes are based on the keyframes. Though these above methods achieve good performance, only the low-level features are not enough to improve the discrimination and robustness of a video hash further. Therefore, the human visual attention is taken into account as it reflects the information of visual understanding. There have been some researches on visual attention-based video hash. Su et al. presented a robust video fingerprint algorithm based on spatial visual attention regions [10]. In this algorithm, the spatial saliency map for each frame was divided into blocks and the video hash was obtained according to the relationship between these blocks. Wang et al. fused the video hashes derived from the spatial saliency map and TRF via Exclusive-OR and the recall rate was improved distinctly [11]. Sun et al. assigned different weights to hash bits according to the spatial saliency map and this spatially weighting method improved the performance of the video hash [12]. Though only the spatial visual attention has been adopted in the study of video hash, it demonstrates that visual attention can bring promotion to the video hash. In this paper, a temporally visual weighting (TVW) method is proposed. Its contribution has two folds: 1) The temporally visual attention is adopted in video hash and the temporal variation of visual attention is utilized to weight the frames during the generation of TRF; 2) The temporally visual attention shift is defined by the variation of visual attention regions (VARs). The strength of temporally visual attention shift is calculated as the temporal weight for each frame. The advantages of the proposed TVW method are verified by the performance comparisons of the corresponding video hashes. II. TEMPORALLY VISUAL WEIGHTING METHOD A. Temporally Visual Attention VARs on each frame are represented by the saliency map, which is formed by combining the dynamic and static attention models. 1) Dynamic Attention Model: Here the dynamic attention model is obtained by detecting out the moving objects of each frame. The method of Gaussian Mixture Model (GMM)-based background modeling in [13] is adopted, which utilizes a mixture of Gaussian distributions to build the background model and detect the moving objects. The probability of the pixel at moment as background is: (1) where denotes the pixel at the moment . is the number is an estimation of Gaussian mixtures, which is from 3 to 5.
1070-9908 © 2013 IEEE
1254
IEEE SIGNAL PROCESSING LETTERS, VOL. 20, NO. 12, DECEMBER 2013
of the update weight of the th Gaussian distribution, and are the mean and the covariance matrix of the th Gaussian distribution respectively, and denotes the Gaussian probability density function. -
-
-
-
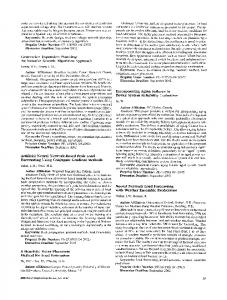
(2) The parameters of the distribution which match the new observation are updated according to the algorithm in [13]. The first distributions are chosen as the dynamic attention after the Gaussian distributions are re-ordered model by the value . is the learning rate. Fig. 1. Temporal visual attention curve of the video “Hall”.
(3) B. Temporal Attention Shift where is a measure of the minimum portion of the data that , should be accounted for the background. Here and . is a binary image. The pixel value of the moving region is 1 and that of the static region is 0. 2) Static Attention Model: The static attention model in [14] is adopted in this paper, which is constructed based on intensity, texture and color features on different scales. (4) denotes the static attention model. , and where are the three saliency maps of intensity, texture and color respectively.
is the weight and
.
3) Attention Model Fusion: The dynamic and static attention models are fused to form the final saliency map. The final saliency map, , and the weights of the dynamic and static models are calculated as in [15]: (5) where and are the fusion weights of the dynamic and static attention models. (6) (7) where
. and denote the mean and maximum functions. is set from the perspective that features with strong contrast are activated and produce high while similar features are prohib. As a result, the fusion weight of ited and generate low the dynamic model is increased and the fusion weight of the static model is suppressed [15]. When there is no motion in the whole video frame or the motion is full of the video frame, and are 0 or 1. In these two both cases, the motion contrast is the lowest, and the video saliency map depends only on the static attention model. The pixel value ranges from 0 to 1, where 1 indicates the highest attention of and 0 indicates the lowest attention.
The distribution of VARs can reflect the content of a frame as the frame is understood via visual attention. Hence the variation of VARs can reflect the change of the frame content. The VARs are located as the following steps: Step 1: Divide the saliency map into non-overlapping blocks , and calculate the mean of each block; with size of Step 2:Find the block with maximum mean and it is taken as the block, which attracts the first visual attention in this paper. Make this block as a center, and extend it to an optimal rectangular region with minimum size and maximum saliency. This extended region is a visual attention region (VAR); Step 3:When a VAR is located, the pixels in it are set to 0. Repeat Step 2 and Step 3 until there is no more VAR; If the relationship between the attention degrees of different VARs changes, it means that the visual attention shifts. Here the mean of a VAR is used as the attention degree of the VAR. Denote the means of the first two VARs of the th frame by and . A visual attention shift happens between the th and th frames if (8) Usually a new content will attract more visual attention to some extent after the previous content keeps for a longer time. Because the visual attention shift can represent the variation of video content, the attention shift should have strong strength after long duration without visual attention variation. Hence the strength of visual attention shift is defined as: (9) denotes the strength of visual attention shift in the where th frame. is the number of frames without attention shifts before the th frame. If there is no attention shift in the th frame, its strength of visual attention shift is 0. Fig. 1 shows the strength of temporally visual attention shift of the standard test video, “Hall”. Fig. 2 shows the frames, whose strength of attention shift is greater than 10 and the labels are in the format of (Frame Number,Strength of Attention Shift). We can see that the frames can represent the main
LIU et al.: VISUAL ATTENTION BASED TEMPORALLY WEIGHTING METHOD
1255
Fig. 2. Frames of the video “Hall”, whose strength of attention shift is greater than 10.
video content. It proves that the proposed strength of attention shift can reflect the importance of a frame effectively. C. Temporally Visual Weight During the calculation of temporally visual weight, the influence of the frames with visual attention shift is emphasized and that of the frames with stable content is kept. Considering stronger visual attention shift means greater video content is: change, the temporally visual weight (10) where denotes the strength of visual attention shift in the th frame. denotes the amount of frames without visual atand are tention shift in a video segment with frames. weights and . Here is set to 0.3 and is 0.7 empirically, which emphasizes the significance of visual attention shift. For the video segment without visual attention shift, we assign uniform weight to the frames. However if there is a visual attention shift in a video frame, the weight for this frame is proportional to the strength of the visual attention shift.
Fig. 3. Comparison on ROC among different weighting methods.
B. Performance Evaluation
III. EXPERIMENTAL RESULTS AND ANALYSIS In order to evaluate the proposed TVW method, we carry out comparison experiments on the video hashes, which are derived from the TRF generated based on the proposed TVW method and other existing weighting methods. A. TRF Generation The video hash algorithms in [4], [8], [11] and [12] are selected as references. In order to carry out a fair comparison between different temporal weighting methods, only the temporal weighting methods in the reference algorithms are replaced by the proposed TVW to generate the TVW-based TRF. That is to say, the video segmentation, hash generation from TRF, and hash matching in the reference algorithm are kept during the comparison experiments. In [4], the video was segmented into shots, which has no fixed length and didn’t overlap with each other. In [8], [11] and [12], each video segment contains 30 frames and the segments are overlapped by 50% with the adjacent segments. The TRF of a video segment is generated as: (11) where is the intensity of the th pixel of the th is the intensity frame in a video segment with frames. of the TRF. is the temporally visual weight.
Ten kinds of videos are selected from the dataset provided in [16]. They are 1) documentary video, 2) music television, 3) sports video, 4) cartoon video, 5) live video, 6) news video, 7) standard test video, 8) animation movie, 9) lecture video, and 10) public service video. There are about 500 videos in each kind and each video is around 3 seconds. The original video is about 4 hours totally. Thirteen kinds of spatial and temporal attacks are performed on each video, which are (a) histogram equalization, (b) Gaussian noising, (c) contrast decreased, (d) contrast increased, (e) median filtering, (f) Gaussian blur, (g) random frame exchanging, (h) speckle noising, (i) frame dropping, (j) random frame add Gaussian noising, (k) noising and contrast decreased, (l) resizing from CIF to QCIF, (m) frame cropping. During video normalization, the black box deletion is performed on each video and then every frame is normalized . to the size of In order to demonstrate the performance of the proposed TVW method, the proposed TVW method is used as temporally weighting method for the algorithms in [4], [8], [11] and [12] to replace their original weighting methods. There are two weighting methods adopted in the comparison, which are WTA in [8], [11] and [12] because Esmaeili et al. in [4] and have proved that weighting by is better than the uniform weighting. Fig. 3(a) and (b) show the comparison on ROC curves among different weighting methods. The TVW hash in Fig. 3 denotes the corresponding video hash generated from the
1256
IEEE SIGNAL PROCESSING LETTERS, VOL. 20, NO. 12, DECEMBER 2013
TABLE 1 COMPARISON ON DIFFERENT TEMPORALLY WEIGHTING METHODS
TABLE II COMPARISON ON POCS OF DIFFERENT ALGORITHMS WITH OWM AND TVW
TVW-based TRF instead of their original weighting methods in [4], [8], [11] and [12] respectively. From Fig. 3, it can be observed that each ROC performance of the TVW hash is obviously better than that of the original video hash in [4], [8], [11] and [12]. The numerical comparison is listed in Table I. In Table I, “Opt-T” denotes the threshold when the recall rate and precision rate are equal. “R&P Rate” denotes the recall rate and precision rate at the optimal threshold. “MAP” denotes the mean average precision. “Non-copy BER Mean” denotes the mean of BER when the video hash is compared with the hash of the non-copy video and it shows the discrimination of video hash. “Copy BER Mean” denotes the mean of BER when the video hash is compared with the hash of the copy video and it shows the robustness of video hash. WER is proposed by the algorithm in [12] and it is weighted error rate. The comparison on “R&P Rate” shows that TVW can achieve at least and about 13.3% higher than WTA. And 0.7% higher than TVW methods achieve higher “MAP”. The “Opt-T” and “Copy BER Mean” corresponding to TVW are lower than those corand it means that the TVW-based responding to WTA and video hashes have better robustness than the video hashes based on the other two weighting methods. Table I demonstrates that if the TRF is generated by the proposed TVW method, the “R&P Rate”, “Opt-T” and “Copy BER Mean” of the corresponding video hash can be improved with preserving “Non-copy BER Mean”. It proves the proposed TVW method brings promotion on robustness to the video hash. In order to evaluate the influence of TVW on the discrimination of video hash, we calculate the probability of collision (POC) of video hash via Gaussian distribution according to the BER mean and variance among non-copy videos in the above cases. The probability of collision between non-copy videos is calculated as following: (12) is the probability of collision. is the “Non-Copy where BER Mean” in Table I, is the corresponding standard variance and is the “Opt-T” in Table I. Given the “Op-T” and “Non-Copy BER Mean” in Table I and the corresponding in Table II, we can calculate the POCs. The comparison on POCs of different algorithms with their original weighting methods and TVW is listed in Table II, where OWM denotes original weighting method. It can be observed from Table II, the proposed TVW method can improve the col-
lision free property of the video hash up to one or two orders of magnitude. In addition, the evaluation of the proposed TVW method is also performed on the social video database, which is www. youku.com, one of the largest video blogs in China and the similar comparison results are obtained. IV. CONCLUSION A visual attention based temporally weighting method for video hashing is proposed in this paper, in which the temporal weight is calculated by the strength of visual attention shift. Experiments on the videos selected from the public video database and popular video blog show the visual attention based temporally weighting method has advantages on enhancing the robustness and discrimination of video hash. REFERENCES [1] S. Cheung and A. Zakhor, “Efficient video similarity measurement with video signature,” IEEE Trans. Circuits Syst. Video Technol., vol. 13, no. 1, pp. 59–74, 2003. [2] X. F. Yang, Q. Tian, and E-C. Chang, “A color fingerprint of video shot for content identification,” ACM Multimedia, pp. 276–279, 2004. [3] C. Kim and B. Vasudev, “Spatio-Temporal sequence matching for efficient video copy detection,” IEEE Trans. Circuits Syst. Video Technol., vol. 15, no. 1, pp. 127–132, 2005. [4] C. Roover, C. Vleeschouwer, F. Lefebvre, and B. Macq, “Robust video hashing based on radial projection of key frames,” IEEE Trans. Signal Process., vol. 53, no. 10, pp. 4020–4037, 2005. [5] B. Coskun, B. Sankur, and N. Memon, “Spatiotemporal transform based video hashing,” IEEE Trans. Multimedia, vol. 8, no. 6, pp. 1190–1208, 2006. [6] S. Lee, C. Yoo, and T. Kalker, “Robust video fingerprinting based on symmetric pairwise boosting,” IEEE Trans. Circuits Syst. Video Technol., vol. 19, no. 9, pp. 1379–1388, 2009. [7] J. Kim and J. Nam, “Content-Based video copy detection using spatiotemporal compact feature,” IEEE ICIAT, vol. 3, pp. 1667–1671, 2009. [8] M. M. Esmaeili, M. Fatourechi, and R. K. Ward, “A robust and fast video copy detection system using content-based fingerprinting,” IEEE Trans. Inf. Forensics Secur., vol. 6, no. 1, pp. 213–226, 2011. [9] R. C. Harvey and M. Hefeeda, “Spatio-Temporal video copy detection,” MM Sys’12, pp. 35–46, 2012. [10] X. Su, T. Huang, and W. Gao, “Robust video fingerprinting based on visual attention regions,” IEEE ICASSP, pp. 1525–1528, 2009. [11] J. Wang, J. D. Sun, and J. Liu et al., “A visual saliency based video hashing algorithm,” IEEE ICIP, pp. 645–648, 2012. [12] J. D. Sun, J. Wang, and J. Zhang et al., “Video hashing algorithm with weighted matching based on visual saliency,” IEEE Signal Process. Lett., vol. 19, no. 6, pp. 328–331, 2012. [13] C. Stauffer and W. E. L. Grimson, “Adaptive background mixture models for real-time tracking,” CVPR 1999, vol. II, pp. 246–252, 1999. [14] J. Zhang, J. D. Sun, and H. Yan et al., “Visual attention model with cross-layer saliency optimization,” in IEEE Int. Conf. Intelligent Information Hiding and Multimedia Signal Processing, 2011, pp. 240–243. [15] P. Jiang and X. L. Qin, “Keyframe-Based video summary using visual attention clues,” IEEE Trans. Multimedia, vol. 17, no. 2, pp. 64–73, 2010. [16] X. Wu, C. W. Ngo, and A. G. Hauptmann et al., “Real-Time nearduplicate elimination for web video search with content and context,” IEEE Trans. Multimedia, vol. 11, no. 2, pp. 196–207, 2009.