2224
IEEE PHOTONICS TECHNOLOGY LETTERS, VOL. 18, NO. 21, NOVEMBER 1, 2006
Empirical Method for Determining SOA Gain Based on ASE Characterization Benjamin A. Small, Member, IEEE, Benjamin G. Lee, Student Member, IEEE, and Keren Bergman, Member, IEEE
Abstract—Semiconductor optical amplifiers (SOAs) are often used in fiber-optic systems in which device gain must be adjusted precisely without disturbing the surrounding system. We have developed an unobtrusive technique for measuring SOA gain based on the peak wavelength of the device’s amplified spontaneous emission spectrum. This methodology also expedites gain measurements for systems in which an SOA dynamically switches ON and OFF. We further confirm the reliability and robustness of this methodology. Index Terms—Optical noise, photonic switching systems, semiconductor optical amplifiers (SOAs).
I. INTRODUCTION EMICONDUCTOR optical amplifiers (SOAs) are used in numerous fiber-optic systems both as amplifiers and as broadband switching elements [1]–[14]. In these systems, the gain delivered by an SOA often needs to be adjusted or determined precisely and accurately. However, when an SOA is part of a larger system containing other fiber-optic components and devices, isolating the gain contribution of the SOA alone can be difficult without disassembling the fiber-optic system. Similarly, in switching systems which utilize SOAs as gating elements, it is often impractical to determine the gain of an SOA when it is in the ON state, while switching occurs with high frequency (viz. MHz). We present a technique for accurately determining the operating gain of SOAs unobtrusively by taking advantage of empirical relationships between the gain and the amplified spontaneous emission (ASE) spectrum. Precisely configuring SOA gain is difficult in two types of situations in particular: 1) those in which the SOA is part of a module or subsystem such that it cannot be easily isolated; 2) configurations that contain SOAs which turn ON and OFF such that a signal state cannot be held constant for the duration of a measurement, or in which the duty cycle of the ON state is difficult to determine. Numerous real photonic systems often use SOAs as gain elements in conjunction with splitters, couplers, and other loss elements [11]–[14]; in these systems, the gain of the SOA cannot easily be isolated from the elemental losses. Setting the device gain may involve separating it from the system, adjusting the current to obtain the desired gain, and re-inserting the SOA into the system. Optical packet switching (OPS) systems have this problem as well while also utilizing the SOAs for time-domain gating and switching [1]–[11]. Because
S
Manuscript received March 22, 2006; revised August 2, 2006. This work was supported in part by the National Science Foundation under Grant ECS0532762. The authors are with the Department of Electrical Engineering, Columbia University, New York, NY 10027 USA (e-mail:
[email protected];
[email protected];
[email protected]). Digital Object Identifier 10.1109/LPT.2006.884754
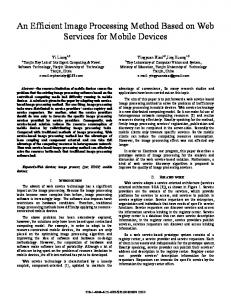
Fig. 1. Experimental plot of ASE noise spectra for an Alcatel 1901A SOA device at drive currents of 45, 55, and 75 mA.
the duty cycle in the latter case may not be well understood or may not be deterministic, the gain may be difficult to determine precisely using conventional time-averaged measurements. The authors have successfully used the following methodology to set SOA gain in a simple packet switching loop testbed, similar to [16]. Due to alterations in the carrier distribution in SOAs, the wavelength at the peak of the ASE noise spectrum varies with drive current [12]–[15], as shown in Fig. 1. For example, the peak ASE wavelength for an Alcatel 1901A (currently available from Avanex Inc.) device begins at approximately 1630 nm with zero drive current and decreases to about 1520 nm for drive current values near 200 mA, which is the highest suggested operating current. For a Kamelian OPB-10 device (now Amphotonix Ltd.), another common commercially available product, the peak ASE wavelength spans the range between approximately 1600 and 1480 nm, depending on the drive current. Salient characteristics for each of these devices are presented in Table I. Furthermore, device gain increases with increasing drive current in a consistent manner as well. Therefore, a one-to-one relationship between peak ASE wavelength and device gain can be found empirically. This relationship can be very useful in fiber-optic systems which are composed of SOAs. II. METHODOLOGY The wavelength dependence of the optical loss of some of the fiber-optic components in a system may not be precisely known, but it may be possible to isolate certain subsystems
1041-1135/$20.00 © 2006 IEEE
SMALL et al.: EMPIRICAL METHOD FOR DETERMINING SOA GAIN BASED ON ASE CHARACTERIZATION
2225
TABLE I CHARACTERISTICS OF COMMERCIAL SOA DEVICES
Fig. 3. Plots of the wavelength at the peak of the ASE spectrum and device gain for signals at 1528.8 (C61), 1552.5 (C31), and 1577.0 nm (C01), as they relate to drive current for the Kamelian OPB-10 SOA.
Fig. 2. Plots of the wavelength at the peak of the ASE spectrum and device gain for signals at 1528.8 (C61), 1552.5 (C31), and 1577.0 nm (C01), as they relate to drive current for the Alcatel A1901 SOA.
which contain wavelength-independent components within systems designed for wideband OPS, passive optical networks, or other broadband communications networks. Similarly, when an SOA switches ON and OFF, the gain during the ON state requires knowledge of the duty cycle, since generally only time-averaged spectral power can be measured; however, the ASE noise is produced only when the SOA is ON, and the peak ASE wavelength is unaffected by the device duty cycle. Thus, a methodology for indirectly determining SOA gain based on the ASE spectrum could be useful in these applications. The relationship between device gain and drive current must first be experimentally recorded; often this information is provided by the device vendor. Then, the relationship between the peak ASE wavelength and drive current is recorded. This procedure requires only a minimal measurement setup and can be done in an environment that is more experimentally accessible than the larger system experiment or final system implementation. After these two relationships are investigated (Figs. 2 and 3), a reference plot of the type given here (Fig. 4) can be generated. This plot can function as a look-up table, allowing the SOA gain to be predicted repeatedly with ease and accuracy for differing current values or duty cycles, and altered experimental setups or system configurations. In order to illustrate the universality of this relationship, both SOA models, which differ substantially in performance, are characterized. cross-correlation coefficient between the experimenThe tally measured peak ASE wavelength and the device gain over the range of interest are higher than 98% and 96%, respectively,
Fig. 4. Reference plots of the one-to-one relationship between experimentally measured peak ASE wavelength and device gain, as derived from the data illustrated in Figs. 2 and 3.
for the Alcatel and Kamelian SOA devices, for all three representative wavelengths. This statistical measure, defined as the ratio of the covariance between the data points to their respective standard deviations, describes the degree to which the data for the two device parameters are related [17], and is illustrated by the generally smooth shape of the curves in Fig. 4. To further verify the robustness of these relationships, an experimental trial is also performed. These data are taken while the SOAs operate in the linear or quasi-linear regime, where the device gain behaves in a predictable way. It may be possible to construct reference plots for devices operating in the saturation regime, although it is likely that large imprecision in the gain setting would result. In general, the reference plot should be constructed from data taken when the SOA is operating in a mode very similar to the one in the system, in order to ensure the best possible repeatability. III. TRIAL In order to verify the repeatability, experimental confidence, and robustness of this methodology, a trial is performed for each
2226
IEEE PHOTONICS TECHNOLOGY LETTERS, VOL. 18, NO. 21, NOVEMBER 1, 2006
fluctuations, are all still smaller than the inherent imprecision in setting the gain of the gated SOA. IV. CONCLUSION A methodology for determining the device gain of an SOA based upon the peak ASE wavelength is presented. Importantly, this technique does not require that the SOA be removed from the system and is effective even when the SOA is switched ON and OFF. Although the spectral characteristics of the SOA device of interest must first be quantified in order to generate the appropriate reference plot, very little is required to accurately determine gain after system implementation. Furthermore, the robustness of this technique is demonstrated with an experimental trial. REFERENCES Fig. 5. Plot of errors in the gain setting for each method, the conventional current-based approach (filled shapes) and the novel ASE-based methodology (open shapes), for both models of SOA devices, Alcatel A1901 (circles) and Kamelian OPB-10 (squares).
of the two SOA models. The SOA is gated ON and OFF at a rate of approximately 30 MHz by a signal that is irregular but has a stable experimentally confirmed average duty cycle of 48.5% ( 3.14 dB). Because the duty cycle is precisely known for this experimentally controlled trial, the gain delivered by the SOA during the ON state can be straightforwardly calculated from the time-averaged gain observed on a conventional optical spectrum analyzer. Of course, in many practical system implementations, this information is unknown. In this experimental trial, the SOA gain was set at a particular value by utilizing two different methods: one based on the average current delivered to the SOA, as would be done for a conventional current driver module; and one based on the methodology outlined in Section II which requires observation only of the peak wavelength of the ASE spectrum. Then, the gain settings obtained by each of these methods were compared to the actual gain, as calculated from the a priori knowledge of the signal duty cycle factor. The methodology presented here demonstrates significantly higher accuracy and stability (Fig. 5) for both the Alcatel and Kamelian devices for the 1552.5-nm (C31) wavelength. Whereas the conventional current-based approach had root-mean-square (rms) errors of 0.7 and 0.9 dB, respectively, for the Alcatel and Kamelian devices, the new technique exhibited rms errors of only 0.4 dB for each device. Moreover, the widest absolute error found from the novel methodology presented here is just 0.7 dB, and most error values fall below 0.3 dB. The imprecision of the novel ASE-based methodology is within the typical margin introduced by fiber connector losses and other system nonidealities as well as experimental error. Furthermore, the specified values of other variations, such as polarization-dependent gain, gain ripple, and temperature
[1] J. D. Evankow and R. A. Thompson, “Photonic switching modules designed with laser diode amplifiers,” IEEE J. Sel. Areas Commun., vol. 6, no. 7, pp. 1087–1095, Aug. 1988. [2] M. J. O’Mahony, “Semiconductor laser optical amplifiers for use in future fiber systems,” J. Lightw. Technol., vol. 6, no. 4, pp. 531–544, Jun. 1988. [3] A. Fortenberry, J. Lowery, W. L. Ha, and R. S. Tucker, “Photonic packet switching using semiconductor optical amplifier,” Electron. Lett., vol. 27, no. 14, pp. 1305–1307, Jul. 4, 1991. [4] D. J. Blumenthal, K. Y. Chen, J. Ma, R. F. Feuerstein, and J. R. Sauer, “Demonstration of a deflection routing 2 2 photonic switch for computer interconnects,” IEEE Photon. Technol. Lett., vol. 4, no. 2, pp. 169–173, Feb. 1992. [5] A. Ehrhardt, M. Eiselt, G. Grossopf, L. Kuller, R. Ludwig, W. Pieper, R. Schnabel, and H. G. Weber, “Semiconductor laser amplifier as optical switching gate,” J. Lightw. Technol., vol. 11, no. 8, pp. 1287–1295, Aug. 1993. [6] Cai, R. M. Fortenberry, and R. S. Tucker, “Demonstration of photonic packet-switched ring network with optically transparent nodes,” IEEE Photon. Technol. Lett., vol. 6, no. 9, pp. 1139–1141, Sep. 1994. [7] H. J. S. Dorren, M. T. Hill, Y. Liu, N. Calabretta, A. Srivatsa, F. M. Huijskens, H. de Waardt, and G. D. Khoe, “Optical packet switching and buffering by using all-optical signal processing methods,” J. Lightw. Technol., vol. 21, no. 1, pp. 2–12, Jan. 2003. [8] R. Hemenway, R. Grzybowski, C. Minkenberg, and R. Luijten, “Optical-packet-switched interconnect for supercomputer applications [Invited],” J. Opt. Netw., vol. 3, no. 12, pp. 900–913, Dec. 2004. [9] B. A. Small, A. Shacham, and K. Bergman, “Ultra-low latency optical packet switching node,” IEEE Photon. Technol. Lett., vol. 17, no. 7, pp. 1564–1566, Jul. 2005. [10] T. Lin, K. A. Williams, R. V. Penty, I. H. White, M. Glick, and D. McAuley, “Performance and scalability of a single-stage SOA switch for 10 10 Gb/s wavelength striped packet routing,” IEEE Photon. Technol. Lett., vol. 18, no. 5, pp. 691–693, Mar. 1, 2006. [11] I. Armstrong, I. Andonovic, and A. Kelly, “Semiconductor optical amplifiers: Performance and applications in optical packet switching [Invited],” J. Opt. Netw., vol. 3, no. 12, pp. 882–897, Dec. 2004. [12] G. P. Agrawal, Fiber-Optic Communication Systems, 3rd ed. New York: Wiley, 2002. [13] N. A. Olsson, “Lightwave systems with optical amplifiers,” J. Lightw. Technol., vol. 7, no. 7, pp. 1071–1082, Jul. 1989. [14] M. J. Connelly, Semiconductor Optical Amplifiers. London: Kluwer Academic, 2002. [15] M. J. Connelly, “Wideband semiconductor optical amplifier steadystate numerical model,” IEEE J. Quantum Electron., vol. 37, no. 3, pp. 437–447, Mar. 2001. [16] O. Liboiron-Ladouceur, B. A. Small, and K. Bergman, “Physical layer scalability of WDM optical packet interconnection networks,” J. Lightw. Technol., vol. 24, no. 1, pp. 262–270, Jan. 2006. [17] J. F. Kenney and E. S. Keeping, Mathematics of Statistics, 3rd ed. Princeton: Van Nostrand, 1962.
2
2