Mar 10, 1978 - Investigation was carried out in 40 adult cats using the method of conditioned ..... cats to discriminate figures of equal luminous flu,x. J. Comp.
ACTA NEUROBIOL. EXP. 1978, 38: 173-193
VISUAL DISCRIMINATION IN CATS: PHYSICAL PARAMETERS OF STIMULI AND EFFECTS OF VISUAL CORTEX ABLATION A. S. BATUEV and L. V. CHERENKOVA Department of Higher Nervous Activity, Leningrad State University Leningrad, USSR
Abstract. Correct reaction probability and minimum exposition time in visual form discrimination task were studied under the conditions of varying pattern parameters. The minimal exposition time depended on pattern contrast and pattern background ratio and on the number of screen position variations. However, it remained unchanged when the background luminance and pattern size varied within the suprathreshold range. The deficits of discrimination in the minimal exposition time conditions in animals with damages to the striate and parastriate cortical regions suggest that the visual cortex participates in the analysis of shortterm stimuli and is responsible for prolongation of the visual trace within the time necessary for object discrimination. INTRODUCTION
Investigations of the visual discrimination mechanisms in humans and animals showed that visual information is subjected to a multistage processing before any decision about the image under discrimination is taken. The aim of such processing is to provide a concise object description which will serve as a basis for attribution of the object to a certain image class. The process of the object classification may be divided into three subsequent stages, i.e. primary description of the image, feature discrirnination and making decision as to the presented image (11, 12). Basing on the concept of the multi-channel and multi-level nature of the sensory system organization (2, 3) we are justified to suppose
that every stage of the visual discrimination process is performed at a definite level of the visual sensory system. Functional role played by the cortical level of the visual analyzer acquires the greatest importance in the course of the study. Considering the role of the occipital cortex during visual discrimination we should point to the fact that investigators have not yet arrived at a unanimous conclusion as to the part this structure plays in the entire discrimination act. The investigations were limited, as a rule, to the study of the influence caused by the damage to the occipital cortex on the visual stimulus differentiation. Resting upon their experimental results, some authors came to a conclusion that striate cortex plays a key role (13, 24, 31). Other authors who make use of the data concerning the connections of the parastriate cortical regions and the presence of neurons with complex and hypercomplex receptive fields, maintain that these regions are of major significance in the discrimination processes, while the striate cortex area is just a relay station for the information transfer (4, 14-17, 20, 25). The third group of scientists shares the opinion that preservation of the ability to visual stimulus differentiation depends on the extent of cortical extirpation (5, 6, 18, 19, 37). Differences in the interpretation of the experimental data might also result from the variety of methodological approaches (38). Indeed, most authors limit themselves to a quantitative description of from discrimination in animals, emphasize the difference in the extent of the lesions and their localization. Thus, it seems necessary for us to determine quantitatively figure parameters influencing the discrimination process both in the intact animals and in the animals with damage to some fields of the cortical projection zone. The present research aims at the examination of the influence of the change in luminous and spatial pattern parameters on the probability and time of discrimination in the intact animals. A change in the nature of such influence after local lesions of the occipital cortex was the other purpose of the investigation. METHODS
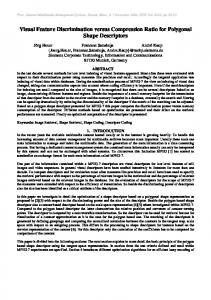
Investigation was carried out in 40 adult cats using the method of conditioned motor alimentary reflex during free running. The experiments were performed in two cages. One cage (54 X 48 X 45 cm) contained two 6 X 6 cm screens. Two panels with food boxes were fixed over the screens (Fig. 1A). Postural-tonic lifting of a hindleg and pressing the panel below the foodbox with a foreleg served as a conditioned motor reaction. Both screens of this cage were illulninated only during the stimulus presentation. The luminance was constant and equaled 20 lux. The second cage (60 X 60 X 7.5 cm contained a 50 X 50 cm screen
(Fig. 1B). A mechanically operated foodbox with a pedal was fixed under it. Pressing the pedal served as a conditioned reaction. The screen was illuminated with a lamp placed outside. The luminance of the screen free of stimulus projection was constantly maintained at 45 lux. A fixation lamp attached to the lower part of the screen was switched on 50 ms
Fig. 1. The schemes of experimental cages ( A , B) and the ray direction during the experiment ( C ) . S, screen; P, projector; PL, signal light panel; F, food-box, L; fixing lamp; B,, screen luminance, BH, pattern luminance; B,, background luminance; H,, screen size; H,, background size.
prior to the stimulus projection. Weak current was fed to the floor between the screen and the starting site during the intervals in the presentation of the stimuli. This kept the animals at the starting site until the stimulus presentation and made it possible to evaluate approximately the angle parameters of the stimuli and the screen. Both cages were equipped with the relay systems and with the signal light panel. An electric stopwatch was used to check the latency of the animal reaction. The stimuli (a six-pointed star and a circle of equal area) were projected f ~ o mthe film slides. The star was always a rewarded form. Stimuli were presented a t random. The first group of animals (14 cats) was trained to differentiate the simultaneously presented patterns. The star and the circle successively
projected on the center of the same screen were presented to the second group of 10 animals. The third group (10 cats) was given successive pattern projections on one of the ten fixed screen areas. The animals were trained to stable discrimination level during 15 to 20 sessions. Every session consisted of 24 trials. The studied pattern parameters remained unchanged during the session and varied randomly from session to session. The probability of the star and circle presentations was equal for all the trials. The screen position of the pattern varied randomly. Training criterion for differentiation of the two patterns was calculated by means of reggressions analysis. Values regression coefficient from 0.05 to 0.1 corresponded to the probability of correct reactions within the range of 0.75-88 in all the experimental series. The range of correct reaction probability was taken as the criterion of stable differentiation. A series of experiments was carried out to determine the dependence of the correct response probability and the minimum exposition time on the stimulus physical parameters after all the animals had been trained in stimulus discrimination. The following pattern parameters were evaluated: patternlbackground ratio, contrast, size of the pattern and size of the screen. Patterdbackground ratio (g) was evaluated by the ratio of the pattern density to the average square value of the background density. This parameter was constant, while the pattern density varied. The background contrast (Ks) was estimated by the ratio of the difference between the background luminance and the free screen luminance to their sum, while the ptttern contrast (Kf) was estimated by the ratio of the difference between the pattern luminance and the background luminance to their sum. The duration of stimulus exposition was determined by means of a calibrated shutter with fine setting. In all the experimental series the dependence of correct response probability and minimum exposition time on pattern parameters was evaluated. The threshold value for each parameter was determined by a reliable decrease in the correct response probability, evaluatced by the method of sign criteria, below the level of 0.5. It was impossible to plot a complete psychometric curve under our experimental conditions, as a considerable decrease caused neurotic disturbance in the animal behavior. Ablation of the occipital cortical areas was performed bilaterally under hexenal anaesthesia (70 mglkg). In seven cats striate cortex was extirpated (field 17 and partly field 21), while in six cats parastriate cortex (fields 18 and 19) was lesioned. When the investigation was over, histology analysis on the brain of the operated animals was performed to determine the size and localization of the cortical lesions, as well as the changes in the subcortical structures functionally related to the damaged cortical areas.
as -
-.-.-.-.-
-.-.-,-.-. .
300
*
500
Trns a
700
1000
$50
500
700
Trns
1000
Fig. 2. Dependence of correct reaction probability on the figure parameters. Ordinate, probability of correct reactions to positive (solid line) and negative (interrupted line) stimuli. Abscissa, pattern contrast ( A ) ; pattern size in cme (B); background contrast (C); signal background ratio (D) and exposition time (E and F). Scatter intervals are presented. C
RESULTS
Stimulus parameter changes and pattern discrimination The star and the circle were projected on the two screens simultaneously for the first group of animals, while to the second group of animals they were successively presented on the same screen. The
dependence of correct response probability on the luminance and spatial characteristics of the pattern and the background were examined. The results are presented in Figure 2. Correct response probability decreased to 0.38-0.46, when the stimulus contrast was 0.05 (Fig. 2A). A decrease in the stimulus area to Sf= 0.78 cm2 (which approximately corresponded to the angular stimulus size j = 1'50') caused a decrease in the correct response probability t o the level of 0.45-0.50 (Fig. 2B). Impairments in pattern differentiation occurred when the background contrast was reduced to 0.05, which resulted in the decrease of correct response probability to 0.45-0.48 (Fig. 2C). When the pattern/background ratio was reduced to Q = 0.95 a sharp disturbance of pattern differentation was observed in all the animals (Fig. 20). These threshold values of the pattern parameters were obtained during non-limited exposition time. Experiments with various durations of stimulus presentations showed a stable differentiation level at the exposition time of over 300 ms when the patterns were projected successively (Fig. 2E). The exposition time of over 250 rns was necessary to reach such level under the conditions of simultaneous stimulus presentation (Fig. 287. Thus, in the described experimental situation the threshold values for the examined parameters were as follows: Kf = 0.05; Sf= 0.78; K , = 0.05; T = 300 ms (for successive presentation); and Q = 0.95; T = = 250 ms (for simultaneous presentation). Peculiarities of pattern differentiation with varied location on the screen Some peculiarities of pattern differentiation were revealed through varying location of the pattern on the screen. Correct response probability remained at the stable criterion level when the number of location variations increased from 1 to 5 (Fig. 3A). An increased number of variations (more than five) caused a reduction in the correct response probability (0.45-0.50). It should b,e pointed out that the screen position of a pattern set did not affect differentiation. For example, if the patterns were projected to two upper screen sections and to the central section during an experimental sessions, the probability of correct response remained the same as in case of the pattern projection to two lower screen sections and to the central section. fie analysis of the latency periods showed that an increase in the number of pattern position variations led to an increase in the latency scattering (Fig. 3B). An increase in pattern position variations caused an increase of the minimal exposition time. The dependence of the minimal exposition time on the number of position variations was linear (Fig. 3C). It was found that the minimal exposition time did not depend on the suprathreshold
changes in pattern size and contrast and on the background contrast, but it became smaller as the screen area decreased. Figure 3 0 shows the dependence of the minimal exposition time on the screen area with position variations.
Fig. 3. Peculiarities of figure discrimination under the conditions of varied figure screen position. A, abscissa, the number of variations; ordinate, the probability of correct reactions to positive (solid line) and negative (interrupted line) stimuli. B, abscissa, the number of variations; ordinate, average quadratic value of latency scatter in seconds. C, abscissa, the number of variations, ordinate, minimum exposition time in ms. D, abscissa, screen area in cm*; ordinate, minimum exposition time (ms).
Thus, when the pattern screen position varied, the correct response probability depended on the number of spatial variations. The minimal exposition time depended only on the number of pattern position variations, but it is independent of the change in the form contrast and size, the background contrast at suprathreshold intervals. Minimal exposition time during pattern parameter variations Investigations of form differentiation under the conditions of time deficit during simultaneous and successive pattern presentations showed that the minimal exposition time did not change under suprathreshold variations of the pattern size and background contrast as in the case of pattern position variations. A decrease in pattern contrast and pattern/ /background ratio led to an increase i n the minimal exposition time.
A curve of the dependence of the minimal exposition time on pattern contrast is presented in Figure 4A. Minimal exposition time was 400 ms at the contrast value of Kf =0.05. A decrease in the patternlbackground ratio within the range of Q = 6.5. to e = 2.0 caused a gradual increase of
Fig. 4. Dependence of minimum exposition time on figure parameters. A, abscissa, pattern contrast; ordinate, minimum exposition time. B, abscissa, exposition time; ordinate, correct reaction probability; signal background ratio is given for each curve. C , abscissa, signal background ratio; ordinate, minimum exposition time (ms).
the minimal exposition time. The curves of .the dependence of correct response probability on exposition time at different patternlbackground ratio values are presented in Figure 4B. An approximated curve showing the dependence of the minimal exposition time on the patternbackground ratio was plotted on the basis of these curves (Fig. 4C, dotted curve). Having assumed that the exposition time of 250 ms is necessary for effective discrimination of the pattern on the background-free screen and that the pattern discrimination is impaired as the Q = 0.95 patternlback-
ground ratio during infinitely long exposition time, it was found that the dependence of the minimal exposition time on the patternhackround ratio is of an exponential nature. The curve of this dependence was plotted according to the formula A /
(Fig. 4B, solid curve), where x is an independent variable. This experimental series has revealed that minimal exposition time grows as the patternlbackground ratio and the pattern contrast decrease. At the same time the background contrast and the pattern size do not influence the discrimination time. Form discrimination following damages to the occipital cortex A series of experiments was carried out on one group of animals operated after they learned to differentiate the patterns and on the other P0.9
cat 17
P
.
cat 19
PO -
-
1
3
5
7
S
l
l
I
3
1 . 3
5
7
9
11
13
Preoperational tesf~ng
~ostopemrionar testing
Fig. 5. Effects of occipital cortex lesions on threshold value of signal background ratio. Abscissa, signal background ratio, ordinate, correct reaction probability. Damage location schemes are @resented.
group subjected to surgery before training. It was shown that the correct response probability as a function of patternhackground ratio did not change after the ablation of various cortical areas. Figure 5 illustrates the results obtained in two cats (No. 17 and No. 19) with striate cortex lesions. After the operation differentiation was impaired when the patternlbackground ratio was Q = 0.95 in cat No. 17 and Q = 0.83 in cat No. 19. The curves of the differentiation elaboration and those of the dependence of the correct response probability on the value of the patternlbackground ratio were identical both in the intact animals and in the animals operated before training. Other results were obtained during the examination of pattern differentiation under the condition of limited exposition time. The minimal exposition time before the surgery equaled 250 ms when the patternlbackground ratio was 13 and it amounted to 450 ms when the pattern/background ratio was 2.0, but those values increased after the surgery. When stimuli were presented with patterdbackground ratio equal to 13, the minimal exposition time increased to 450-700 ms after the operation, depending on the ablation extent (Fig. 6, upper row). The minimal exposition time amounted to 400-1,000 ms when the pattern1 /background ratio was 2.0 (Fig. 6, lower graph).
-~
k