Bernhard E. Riecke
[email protected] Max Planck Institute for Biological Cybernetics SpemannstraBe 38 72076 Tu¨bingen, Germany
Visual Homing Is Possible Without Landmarks: A Path Integration Study in Virtual Reality
Henricus A. H. C. van Veen TNO Human Factors ABSTRACT P.O. Box 23 3769 ZG Soesterberg The literature often suggests that proprioceptive and especially vestibular cues are The Netherlands AG required for navigation and spatial orientation tasks involving rotations of the observer. To test this notion, we conducted a set of experiments in virtual environHeinrich H. Bu ¨ lthoff ments in which only visual cues were provided. Participants had to execute turns, Max Planck Institute for Biological reproduce distances, or perform triangle completion tasks. Most experiments were Cybernetics performed in a simulated 3D eld of blobs, thus restricting navigation strategies to path integration based on optic ow. For our experimental set-up (half-cylindrical 180 deg. projection screen), optic ow information alone proved to be sufcient for untrained participants to perform turns and reproduce distances with negligible systematic errors, irrespective of movement velocity. Path integration by optic ow was sufcient for homing by triangle completion, but homing distances were biased towards the mean response. Additional landmarks that were only temporarily available did not improve homing performance. However, navigation by stable, reliable landmarks led to almost perfect homing performance. Mental spatial ability test scores correlated positively with homing performance, especially for the more complex triangle completion tasks—suggesting that mental spatial abilities might be a determining factor for navigation performance. In summary, visual path integration without any vestibular or kinesthetic cues can be sufcient for elementary navigation tasks like rotations, translations, and triangle completion.
1
Presence, Vol. 11, No. 5, October 2002, 443– 473 ©
2002 by the Massachusetts Institute of Technology
Introduction
Successful spatial orientation and navigation involve a number of different processes, including sensing the environment, building up a mental spatial representation, and using it (such as, to plan the next steps). During navigation, one needs to update one’s mental representation of the current position and orientation in the environment (spatial updating). Spatial updating cues can be classied by the type of information used: position (position- or recognition-based navigation) or velocity and acceleration (path integration or dead-reckoning) (Loomis et al., 1993). Position- or recognition-based navigation (also called piloting) uses exteroceptive information to determine one’s current position and orientation. Such information sources include visible, audible, or otherwise perceivable reference points—so-called “landmarks” (that is, distinct, stationary, and salient objects or cues). Many studies have demonstrated the usage and usability of different types of landmarks for navigation purposes (See Golledge (1999) and Hunt Riecke et al. 443
444
PRESENCE: VOLUME 11, NUMBER 5
and Waller (1999) for an extensive review.) Only piloting allows for correction of errors in perceived position and orientation through reference points (position xing) and is thus more suited for large-scale navigation. Path integration, on the other hand, is based on integrating the perceived velocity or acceleration over time to determine the current position and orientation with respect to some starting point. More generally speaking, path integration is navigation based on means other than position xing (landmarks) and is thus complementary to piloting (Loomis, Klatzky, Golledge, & Philbeck, 1999). Path integration is based on the perception of time, velocity, and acceleration, and is therefore susceptible to accumulation errors due to the integration process. It is well suited for small-scale navigation and connecting neighboring landmarks, but uncertainty and error increase exponentially with traveled distance. See Loomis et al. (1999) and Klatzky, Loomis, and Golledge (1997) for an overview on human and animal path integration. For navigation experiments, one might wish to distinguish between the contributions of piloting and path integration. This can be done by excluding one of the two spatial updating cues at a time: path integration can be rather easily excluded by eliminating all velocity and acceleration information, for example, through a slideshow type presentation. The elimination of recognitionbased spatial updating is more difcult and, perhaps, more critical, as landmarks play a dominant role in normal navigation. The difculty of navigating in heavy fog or snowfall illustrates this dominance. Kinesthetic and vestibular cues typically reveal no information about external landmarks, and as such are well suited for path integration studies. Visual cues provide information about the location of the objects seen, which can consequently be used for recognition-based navigation. Apart from blindfolding people, the only way to circumvent this navigation by landmarks is through displaying optic ow only (that is, removing the landmark character from the visible objects). This can be methodically achieved by presenting an abundance of indistinguishable objects that can be tracked over only a short distance. This can be easily implemented using a virtual reality set-up. The effect is simi-
lar to moving through heavy snowfall or ying through clouds that block the vision for all distant landmarks. (See gure 1.) Warren, Kay, Zosh, Duchon, and Sahuc (2001) have shown that optic ow information can indeed be used for goal-directed walking. As recognition-based strategies are known to provide sufcient information for accurate homing performance in simple navigation tasks (see section 3), we focus here on navigation tasks based solely on path integration, without the aid of external reference points (landmarks). 1.1 Outline and Motivation Vestibular and kinesthetic cues are typically thought to be indispensable for navigation and spatial tasks involving ego rotations (see subsection 1.4). The goal of this study is to test this claim and investigate human navigation and spatial orientation abilities based solely on visual path integration. In short, is visual homing without landmarks possible? More precisely, can the lack of useful vestibular and kinesthetic cues in visually based navigation be compensated for by the external reference frame and broad visual eld of view of a curved 180 deg. projection screen? In the rst experiment (“TURN&GO,” section 2), we investigated how well untrained participants can perform simple rotations and translations, given optic ow information only. If optic ow information is sufcient for performing elementary turns and translations, errors in the subsequent triangle completion tasks can be ascribed to problems in encoding the path traveled and/or in mentally computing the homeward trajectory. The second experiment (“LANDMARKS,” section 3) constitutes a baseline for the later experiments. Given an abundance of salient landmarks in a natural-looking virtual environment, how good is visually based homing? If visual cues are indeed sufcient, we expect perfect performance. In the third experiment (“TOWN&BLOBS,” section 4), we compared homing by optic ow with homing by naturalistic landmarks that were only temporarily available (town with “scene swap”). The primary issues addressed in this experiment are as follows. Is optic ow
Riecke et al.
information alone sufcient for accurate homing? If piloting is the main source for visual navigation, then the elimination of all stable landmarks (scene swap) should reduce performance to the level in the optic ow condition. If naturalism is important for navigation, optic ow performance should be inferior to scene-swap performance. The fourth experiment (“R ANDOM TRIANGLES,” section 5) was designed to investigate the inuence of the simplicity of the triangle geometry. How does the homing performance change when each triangle geometry is novel (randomized) instead of isosceles (as in TOWN&BLOBS)? To our knowledge, so far no one has investigated triangle completion for completely randomized lengths of the rst and second segment and the enclosed angle. Finally, we conducted two standard mental spatial abilities tests to investigate whether mental spatial ability might be a determining factor for this type of navigation performance. (See section 6.) 1.2 Virtual Reality Using virtual reality (VR) for experiments on orientation and navigation offers several advantages over navigation experiments performed in real environments. (See Pe´ruch and Gaunet (1998) for an overview.) Most importantly, experimental conditions can be well dened, easily controlled, and exactly reproduced (Bu¨lthoff & van Veen, 2001; Loomis, Blascovich, & Beall, 1999). Furthermore, the real-time interactivity of VR allows the study of natural behavior in a closed action-perception loop. Here, we used VR specically to disentangle the different sensory modalities and render piloting impossible. The virtual environment was presented only visually, thus excluding all spatial cues from other sensory modalities, especially kinesthetic (feedback from muscles, joints, and tendons and motor efferent commands) and vestibular cues from physical motion. To ensure that participants rely on path integration only, piloting was rendered impossible through presenting optic ow information only (in a 3D eld of blobs) or through mak-
445
ing landmarks only temporarily visible (through scene swap, see subsection 4.1.2). 1.3 Triangle Completion Studies In most of the experiments described in this paper, we used triangle completion, a paradigm that is commonly used for navigation tasks without landmarks: participants are led along two sides of a given triangle and have to nd the shortest way back to the starting position by themselves. (See Klatzky et al. (1997) and Loomis, Klatzky, et al. (1999) for a review.) Triangle completion uses the simplest nontrivial combination of translations and rotations. A simple experimental paradigm for path integration studies is blind locomotion with ears mufed. Kearns, Warren, Duchon, and Tarr (2002, exp. 3), Klatzky et al. (1990), Loomis et al. (1993), Marlinsky (1999b), and Sauve´ (1989) showed in triangle completion studies that kinesthetic and vestibular cues from blind walking allow for homing, but lead to strong systematic errors. In all ve studies, participants showed a considerable regression towards stereotyped responses, such as similar turning angles for different triangle geometries. Qualitatively similar results were found for purely visual triangle completion without salient landmarks. Presentation via head-mounted display (HMD) (Kearns, Warren, Dochon, & Tarr, 2002; Duchon, Bud, Warren, & Tarr, 1999) as well as via at projection screen (Pe´ruch, May, & Wartenberg, 1997; Wartenberg, May, & Pe´ ruch, 1998) led to larger systematic errors than in the blind walking studies. Our results showed, in contrast, smaller systematic errors than the blind walking studies. The aforementioned studies will be discussed in more detail in subsection 7.1, where they will be compared to the experiments presented in this paper. Triangle completion tasks without reliable landmarks can be modeled by three distinct, consecutive processes (Fujita, Klatzky, Loomis, & Golledge, 1993): 1. The encoding phase refers to the set of processes leading to an internal representation of the navigated area.
446
PRESENCE: VOLUME 11, NUMBER 5
2. Mental spatial reasoning is used to compute the desired homing trajectory. 3. In the execution phase, the intended trajectory (rotations and translations) is executed. Errors can potentially occur in all three phases. Several studies attributed all systematic errors to the encoding phase (Fujita et al., 1993; Klatzky et al., 1997; Klatzky, 1999; May & Klatzky, 2000; Pe´ruch et al., 1997; Wartenberg et al., 1998), following the main idea of the “encoding error model” by Fujita et al. (1993). 1.4 Differences between Updating Translations and Rotations This difculty in updating rotations from visual cues alone is consistent with observed fundamental differences between the updating of rotations and translations. For example, studies by May, Pe´ ruch, and Savoyant (1995) and Chance, Gaunet, Beall, and Loomis (1998) revealed that vestibular and kinesthetic cues are more important for updating rotations than for translations. Simulated turns presented only visually resulted in a reduced spatial orientation ability compared to physical rotations with the same visual input. Chance et al. suggest “the advisability of having subjects explore virtual environments using real rotations and translations in tasks involving spatial orientation” (p. 168). However, simply adding physical movements does not necessarily guarantee better spatial orientation performance, as was demonstrated by Kearns et al. (2002). Response variability decreased, but participants were still insensitive to angles turned. Rieser (1989) and Presson and Montello (1994) found a similar difference between rotations and translations for imagined movements: updating the location of several landmarks during imagined self-rotations (without translations) proved more difcult and error-prone than during translations (without rotations). Klatzky, Loomis, Beall, Chance, and Golledge (1998) proposed that this difculty in updating rotations is due to the lack of proprioceptive cues accompanying the selfrotation. Comparing visually presented locomotion with and without physical rotations, Klatzky et al. conclude
that “optic ow without proprioception, at least for the limited eld of view of our virtual-display system, appears not to be effective for the updating of heading” (p. 297). The rst experiment of this paper demonstrates that optic ow without proprioception can indeed be sufcient for correct updating of heading, at least if a wide eld of view and a curved projection screen is used. (See section 2.) 1.5 In uence of Field of View and External Reference Frame The studies on triangle completion by Pe´ruch et al. (1997) and Kearns et al. (2002) and turning studies by Bakker, Werkhoven, and Passenier (1999, 2001) all used a physical visual eld of view (FOV1) that was well below the natural FOV of the human eye. Locomotion was visually presented via projection screen or HMD with a horizontal eld of view of 45, 60, 24, and 48 deg., respectively, compared to more than 180 deg. for humans. These studies demonstrated that humans cannot use visual information for accurate path integration. Might this be due to the unnaturally limited FOV and/or the missing visibility of one’s own body and the physical environment, which might serve as a helpful reference frame? To address these questions, we conducted navigation experiments similar to those by Pe´ruch et al. (1997), but using a half-cylindrical 180 deg. projection screen. Furthermore, three different environments were used, providing different types of spatial information: reliable and salient landmarks, temporarily available landmarks, and no landmarks at all (that is, optic ow only). It is known that enlarging the FOV results in a more 1. The physical eld of view (FOV, sometimes referred to as absolute FOV) is a property of the physical set-up; it is dened by the angle (horizontal and vertical) under which the observer sees the simulation window. In contrast, the simulated eld of view (sFOV) generated by the computer (also referred to as geometric FOV) is a property of the simulation. It is dened by the geometry of the viewing frustrum, that is, by the angle (horizontal and vertical) under which the virtual (simulated) eyepoint sees the virtual environment. For the experiments presented in this paper and for most immersive simulations, the physical and simulated FOV are kept identical. sFOV . FOV corresponds to a wide-angle effect, sFOV , FOV corresponds to a telescope-like view.
Riecke et al.
realistic spatial perception and has a positive inuence on motion perception, sense of presence, visual recognition, lane-keeping performance, spatial orientation, spatial updating, navigation, spatial perception, and visuomotor activities (Alfano & Michel, 1990; Arthur, 2000; Hendrix & Bareld, 1996; Kappe, Erp, & Korteling, 1999; Loomis, Klatzky, & Lederman, 1991; Riecke, von der Heyde, & Bu¨lthoff, 2001; Rieser, Hill, Talor, Bradeld, & Rosen, 1992; Ruddle & Jones, 2001). On the other hand, most displays currently have a rather limited FOV (usually below 60 deg. horizontally). This is especially true for HMDs. Arthur (2000) provides an extensive review on past work as well as several experiments on the inuence of FOV in HMDs on task performance. Using a custom-built HMD, he found a signicant performance benet in walking tasks even for enlarging the horizontal FOV from 112 deg. to 176 deg., which is much wider than the FOV of commercially available HMDs. Comparisons of HMDs and curved projection systems revealed for HMDs an increased workload, fatigue ratings, and reduced visual target detection performance (Hettinger, Nelson, & Haas, 1996; Nelson et al., 1998). Moreover, HMDs exclude vision of the physical surround and oneself, which might provide an important reference frame: in visual triangle completion experiments by Riecke (1998, chap. 5.4), participants used the physical reference frame of a half-cylindrical projection screen as an external reference frame to better estimate visual turning angles.
2
Experiment 1: TURN&G O
Recent evidence suggests that optic ow is sufcient for accurate distance reproduction (Bremmer & Lappe, 1999), but insufcient for ego rotations, where training is needed to correct for systematic errors (Bakker et al., 1999, 2001; Pe´ruch et al., 1997; Sadalla & Montello, 1989). Typically, a considerable variability and compression towards stereotyped turn responses is found. The rst experiment (TURN&GO) was designed to test these claims and to investigate how well untrained
447
participants are able to perform simple visual turns and translations, given only optic ow information. Rotations and translations constitute the basis for all navigation behavior, as all movements can be decomposed into a combination of those elementary operations. Participants were asked to turn by specic angles and reproduce distances traveled using randomized velocities and a simple button-based motion model. If participants are able to execute intended turns with relatively small systematic errors and variance, we could argue that turn execution errors play only a minor role in the subsequent triangle completion experiments, too. Hence, observed turning angles would reect the intended turns and give insight in the spatial representation of the participants. Consequently, we could argue that systematic turn errors in the triangle completion experiments should be ascribed to systematic errors in encoding or mental “computation” of the homeward trajectory (encoding phase or mental spatial reasoning phase, respectively). If participants are able to reproduce traveled distances with relatively small systematic errors and variance, we could argue that encoding and execution errors are either negligible or that they cancel each other out. That would suggest that systematic distance errors in the subsequent triangle completion experiments have to be attributed to errors in the mental spatial reasoning phase. If participants are able to properly use path integration by optic ow to derive angles turned and distances traveled, we would expect no correlation between movement velocity and turns executed or distances traveled. On the other hand, a signicant correlation would suggest the usage of a timing strategy (like counting seconds to estimate distances) or general problems with path integration by optic ow. 2.1 Methods 2.1.1 Participants. For all experiments described in this paper, participants had normal or corrected-tonormal vision. Participation was always voluntary and paid at standard rates. A group of six female and three male na¨õ ve participants participated in experiment TURN&GO and later also in experiment RANDOM TRIAN-
448
PRESENCE: VOLUME 11, NUMBER 5
GLES.
Ages ranged from 20 to 36 years (mean: 26.6 years, SD: 4.4 years). A tenth participant had to be excluded from the analysis, as she misunderstood the instructions. 2.1.2 Visualization. Experiments were performed on a SGI Onyx2 three-pipe Innite Reality2 Engine. The experiment took place in a completely darkened room. Participants were seated in the center of a half-cylindrical projection screen (7 m diameter and 3.15 m high, see gure 1), with their eyes at a height of 1.25 m. Three neighboring color images of the virtual environment were rendered at an update rate of 36 Hz and projected non-stereoscopically side by side, with a small overlap of 7.5 deg. smoothed by Panomaker Softedge Blending. The resulting image had a resolution of about 350031000 pixels and subtended a physical eld of view of 180 deg. horizontally by 50 deg. vertically. Physical and simulated eld of view (used for the image rendering) were always identical. A detailed description of the set-up can be found in van Veen, Distler, Braun, and Bu ¨ lthoff (1998). 2.1.3 Interaction. Participants used the threebutton mouse as an input device to move through the virtual environment. Pressing the middle button produced forward translations that lasted as long as the button was being pressed. Releasing the button ended the motion. Similarly, the left or right button produced left or right rotations, respectively. Pressing or releasing a button resulted in a short acceleration or deceleration phase, respectively, with a constant maximum velocity in between. The button-based motion model was chosen to reduce proprioceptive cues about the motion to the absolute minimum and hence avoid motor learning. 2.1.4 Scenery. The experiment was performed in a 3D eld of blobs that consists of a ground plane and four semitransparent upper horizontal planes, all textured with randomized blob patterns. (See gure 1.) The blob environment was designed to create a compelling feeling of self-motion (vection) using optic ow. The individual, similar-looking blobs became blurred for simulated viewing distances larger than about 10 m,
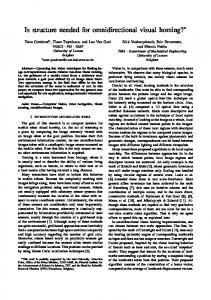
Figure 1. Virtual environments lab with 180 deg. projection screen displaying the 3D eld of blobs. The participant is seated behind the table in the center of the half-cylindrical screen. On the table are mouse and keyboard as input devices.
thus providing no salient landmarks that could be used for position-based navigation strategies. Consequently, participants had to rely on path integration. 2.1.5 Procedure. The experimental design is summarized in table 1. Each participant completed 96 trials, corresponding to a factorial combination of eight distances for six turning angles and two turning directions. The range of distances corresponds to the range of homing distances, s3, in the subsequent triangle completion experiments. The range of turning angles was considerably larger than that used in subsequent experiments. To test the inuence of velocity, translational and rotational velocities were randomized independently for each trial and each segment, within an interval centered around the velocity used in the subsequent experiments. (See table 1.) Before the actual experiment, a handout with a graphical representation of the turning angles was shown to the participants. To ensure that they understood the turning instruction properly, participants were asked to turn physically by angles indicated by the experimenter. Each trial consisted of three phases:
Riecke et al.
449
Table 1. Experimental design for the TURN&GO experiment
translations
rotations
Independent variable
Levels
Values
distance s1 velocity vs1 5 gains1 z v0 velocity vs2 5 gains2 z v0 turning angle a c
8 (equally spaced) randomly selected from a continuous range randomly selected from a continuous range 6 (equally spaced in 45 deg. steps) 2 randomly selected from a continuous range
s1 [ {20, 28.29, . . . , 78} 0.75 # gains1 # 1.5
turning direction rotational vel. a Ç 5 gaina z a Ç 0
a
0.75 # c
[
gains2 #
1.5
{45, 90, . . . , 270 deg.}
left and right 0.5 # gaina #
2
v0 5 5 m/s and a Ç 0 5 40 deg./sec. are the movement velocities used in the subsequent experiments. Further explanations in the text.
1. Distance encoding phase: Participants were positioned randomly within the 3D eld of blobs, facing a yellow “light beam” at a given distance, s1. By pressing the middle mouse button, they moved to the light beam where they stopped automatically upon contact. Turning was disabled during phase 1 and 3. 2. Turn execution phase: Participants were requested to turn using mouse buttons by an angle, a c, and in the direction specied by written instructions displayed in the lower part of the screen (such as “turn left by 225 deg.”). Translation was disabled during this phase. 3. Distance reproduction phase: Participants were asked to reproduce the distance, s1, from the rst phase by traveling that distance in the current direction. Before the actual experiment, participants performed six practice trials to get accustomed with the interface and the task requirements. Participants were never given any feedback about their performance or accuracy. Just as for the other experiments, there was no time limit for fullling the task. The experiment generally lasted about one hour.
2.1.6 Elimination of Outliers. On a few trials, participants accidentally pressed the conrm button before completing the trial or turned in the wrong direction. To reliably eliminate those outliers for all participants, we used the following criterion: a trial was removed if the participant either didn’t turn at all or if the turning error was larger than four standard deviations. A total of fteen trials or 1.7% of the trials were eliminated due to this criterion.
2.2 Results 2.2.1 Errors and Gain Factors. The typical distance reproduction and turn execution performance is displayed in gure 2 for one representative participant. (The general results are summarized in gure 12 and 13 for comparison with the other experiments.) As for all participants, a linear regression line ts well to the data and captures its main aspects: the slope (“gain factor”) for distances (gure 2 (a)) is less than 1, implying that the range of observed mean reproduced distances is smaller than for the distances to be reproduced. The distance gain factor in this example is 0.9 (0.91 6 0.05 for all subjects), indicating a slight compression of the
450
PRESENCE: VOLUME 11, NUMBER 5
Figure 2. Typical distance reproduction (a) and turn execution performance (b) from one participant. The left and right graphs show the executed distance and turning angle, respectively, plotted versus their corresponding correct values. The distance and angular gain factors are 0.9 and 0.99, respectively, as is indicated in the top inset of each gure. The enlargements in (b) illustrate the extremely small within-subject variability and error for turns, indicating the ease with which the task was performed.
response range, whereas perfect performance (no compression) would result in a gain factor of 1. The y-intercept above zero indicates a regression (compression) towards distances larger than zero, and not just an overall scaling between stimulus and response. The angular gain factor (gure 2 (b)) is 0.99 for this subject and 0.97 6 0.01 for all subjects, indicating negligible systematic errors. There was no signicant undershoot or overshoot for distances or turns. (See gure 12.) The absolute error for turns and distances is displayed in gure 13 to give an estimate of homing accuracy on a trial-to-trial basis and for comparison with the
literature. The absolute error for distances was 10.6 m 6 1.7 m, or 23.0% of the distance to be reproduced, whereas the absolute error for turns was merely 5.2%. 2.2.2 Correlation Analysis. To investigate the inuence of the independent variables individually, we performed pairwise correlation tests between the signed and absolute errors for distances (s3m 2 s3c) and turns (a m 2 a c) and the independent variables. (See table 2.) The Fisher r-to-Z transformed values of the coefcients of correlation were tested against zero using a twotailed t-test. The results are summarized in table 2. Re-
Riecke et al.
451
Table 2. Results from the correlation analysis for the TURN&GO experiment. Explanations in text Independent variable
Correlated with dependent variable
distance s1
signed error s2 2 s1 abs. error u s2 2 s1u distance s2 n.s. n.s. n.s.
translational velocity vs1 translational velocity vs2 translational velocity ratio vs2/vs1 5 gains2/gains1 turning angle a c
turning direction rotational velocity a Ç 5 gaina z a Ç 0
signed error a m 2 a abs. error u a m 2 a cu turning angle a m n.s. n.s.
c
sponses were uncorrelated to both translational and rotational velocity. Thus, we can exclude simple timingbased strategies. The signed distance error was negatively correlated to the correct distance (s1), indicating a compression of the response range. The same was true for turns, but with a much smaller compression. (See gure 12.) Absolute error increased for both distances and turns with their corresponding correct values. The absolute distance error can be modeled by a linear regression, revealing a constant absolute error of b 5 3.2 m and a linear contribution with a 5 0.151: ~u s 2 2 s 1 u (s 1) 5 a z s 1 1 b 5 0.151 z s 1 1 3.2 m). The corresponding linear regression for the absolute turning error reveals a much smaller linear contribution of a 5 0.024: ~u a
m
2 a cu (a c) 5 a z a
c
1 b 5 0.024 z a
c
1 3.4 deg).
To test how well the correct distance or turning angle predict the observed distance and turning angle, respectively, we performed a similar correlation analysis on them. As expected, the correlation was highly signicant for both distances and turns. (See table 2.) A r2 value of
r 5 20.16 r 5 0.31 r 5 0.82
r 2 5 0.025 r 2 5 0.097 r 2 5 0.667
t(8) 5 2.4, p 5 0.04 t(8) 5 5.5, p 5 0.0005 t(8) 5 8.9, p , 0.0001
r 5 20.30 r 5 0.17 r 5 0.999
r 2 5 0.088 r 2 5 0.029 r 2 5 0.998
t(8) 5 6.7, p 5 0.0002 t(8) 5 3.0, p 5 0.017 t(8) 5 9.6, p , 0.0001
0.67 for distances implies that 67% of the variance in the distance traveled (s2) can be explained by the distance to reproduce (s1). For the turning angles, almost the whole variance (99.8%) in angles turned (a m) can be explained by the angle to turn (a c), indicating an excellent turning response and a negligible execution error.
2.3 Discussio n 2.3.1 Turning Errors. Contrary to the predictions derived from the literature, participants were able to accurately update rotations (and translations, albeit with reduced accuracy) from optic ow presented on a curved 180 deg. projection screen. Participants had no prior training or explicit feedback whatsoever, but they were nevertheless able to accomplish the task relatively well, compared to the literature. In comparable visual turning experiments using an HMD, Bakker et al. (1999, 2001) reported turning errors that were more than ten times larger than in the current experiment (for signed error, absolute error, and between-subject variability). Only within-subject variability was at a comparable level. Directly after feedback
452
PRESENCE: VOLUME 11, NUMBER 5
training, errors in the Bakker et al. (2001) study were reduced, but still about three times larger than in the TURN&GO experiment (and increased on the following day). The reasons for the observed huge performance differences are not fully understood yet. The main difference between our experiments and the literature is the display set-up used, that is, the half-cylindrical projection screen. Hence, we suggest that the display set-up and reference frame provided play a mayor role that needs to be investigated in future studies. This hypothesized inuence of the FOV is corroborated by comparing the two studies by Bakker et al. (1999, 2001): a horizontal FOV of 48 deg. led to systematic overshooting or underestimation of the turns (Bakker et al., 2001), whereas a smaller horizontal FOV of 24 deg. led to systematic undershooting, which was about twice as large (Bakker et al., 1999). However, merely using a projection screen instead of an HMD does not necessarily get rid of systematic errors: using a at projection screen with a FOV of 45 deg., Pe´ruch et al. (1997) found a signicant undershoot of 16% for rotations. 2.3.2 Distance Errors. As predicted by the literature, participants were able to integrate velocity and acceleration information derived from optic ow to estimate distances traveled, without any training and irrespective of movement velocity. There was no signicant undershoot or overshoot for distances. (See gure 12.) However, distances showed a considerable absolute error, which was about four times higher than for the turning task. Furthermore, distances were slightly but insignicantly compressed towards stereotyped responses. Compared to the results by Bremmer and Lappe (1999), we found a slight compression but no general overshoot. The differences might be explained by differences in the experimental paradigm: Bremmer and Lappe did not use an intervening turning task, and participants could actively control their velocity in the reproduction task and had previously accomplished a distance discrimination task. 2.3.3 Conclusions and Predictions. We conclude that participants did not use a simple, time-based
strategy to estimate angles turned or distances traveled. Turn execution errors and variability were negligible, implying that any potential turning errors in the subsequent triangle completion experiments have to be ascribed to either the encoding process or problems with the mental “computation” of the homing trajectory. If the participant had no problems in mental spatial reasoning, distance responses in the subsequent triangle completion tasks should be similar to experiment TURN&GO (no overall signed error, gain 5 0.91, and considerable variability). Larger systematic errors, on the other hand, would indicate problems in mental “computation” of the homing trajectory.
3
Experiment 2 : LANDMARKS
The second experiment was designed to establish a baseline performance for visual homing, for comparison with the subsequent experiments, which investigated visual navigation performance without any stable, salient landmarks. The question here was what is the accuracy of visually based homing when an abundance of salient landmarks in a natural-looking virtual environment are available to be used as navigation aids. If visual cues are sufcient, we would expect perfect performance (that is, negligible systematic errors and variability). 3.1 Methods 3.1.1 Participants. Five male and two female participants participated in the LANDMARKS experiment. All of them had earlier completed the TOWN&BLOBS experiment. Ages ranged from 23 to 30 years (mean: 26.5 years, SD: 2.6 years). 3.1.2 Interaction. Participants could freely move through the virtual environment using mouse buttons as in the previous experiment. The maximum velocity was 0 5 5 m/s for translations and a Ç 0 5 40 deg./s for rotations. These motion parameters were chosen to help reduce the incidence of simulator sickness. Combined rotations and translations were possible, but hardly used by the participants.
Riecke et al.
453
upon contact. Then the second goal (the second corner of the triangle) appeared, which was symbolized by a blue light beam. As the second goal could be outside the current visual eld, the proper turning direction was indicated at the bottom of the projection screen. Participants turned towards the second goal and moved there. Like the rst goal, it disappeared upon contact.
Figure 3. View of the town environment. The yellow cylinder (light beam) represents the rst goal, that is, the rst corner of the triangle to be traveled.
(2) Homing Task. After reaching the second goal, the whole scene faded out into darkness for 2 sec. for compatibility with experiment TOWN&BLOBS. After that brief dark interval, the actual task was to turn and move directly to the unmarked starting point as accurately as possible. Pressing a designated button recorded the homing endpoint and initiated the next trial. 3.2 Results and Discussion
3.1.4 Procedure. A repeated-measures, withinsubject design was used. (See table 3.) Each participant was presented with sixty isosceles triangles in random order, corresponding to a factorial combination of six repetitions for ve different angles of the rst turn and two turning directions. There was no time limit for completing the tasks and no feedback about performance accuracy during the whole experiment. The nomenclature used for the triangle is depicted in gure 4. Each subject performed one experimental block with sixty trials, lasting about one hour. For each trial, participants had the following task.
Homing errors were analyzed using two separate repeated-measures, two-way ANOVAs (ve angles and two turning directions) for the signed error of the two dependent variables (turning angle and distances traveled, respectively). None of the factors or any of the interactions were signicant ( p . 0.24 in all cases). For further analysis, the data were consequently pooled over left and right turns. The pooled data are graphically represented in gure 5, providing a rst impression of the homing results.2 Homing performance was excellent, with negligible systematic errors and small betweensubject variability. To quantify that behavior, we again used the gain factor and the signed and absolute error for both measurands. (See gure 12 and 13.) Participants slightly undershot the correct homing distance by 1.9 m. Turning error, as well as the gain factor for turns and distances, were negligible and did not differ signicantly from their correct value. (See gure 12.) The absolute
(1) Excursion. At the beginning of each trial, participants were positioned and oriented randomly in the virtual environment, facing the rst goal (the rst corner of the triangle), which was symbolized by a semitransparent yellow ‘light beam’. (See gure 3.) Participants moved to the yellow light beam, which disappeared
2. The 95% condence ellipse is a 2D analog of the condence interval (mean 6 two standard errors of the mean). It covers the population center with a probability of 95% and decreases with 1/ N with sample size N. The standard ellipse is a 2D analog of the standard interval (mean 6 one standard deviation). It is used to describe the variability of the data and covers roughly 40% of the data (Batschelet, 1981, p. 141).
3.1.3 Scenery. The experimental landscape was a green open square in a photorealistic 3D model of a small town. (See gure 3.) The square was surrounded by an abundance of distinct landmarks (such as streets, trees, and houses).
454
PRESENCE: VOLUME 11, NUMBER 5
Table 3. Experimental design for the LANDMARKS experiment Independent variable
Levels
Values
a 5 turning angle at 1st corner turning direction
5 2
a [ {30, 60, 90, 120, 150 deg.} left or right
The isosceles triangles had a constant segment length of s1 5 s2 5 40 m. The different values for a correspond to correct homing distances s3c [ {20.71, 40, 56.57, 69.28, 77.27 m} and correct turning angles at the second corner b c [ {105, 120, 135, 150, 165 deg.}.
(See gure 12 and 13.) This performance improvement indicates that participants did indeed take advantage of the landmarks to perform the task. This is corroborated by the questioning after the experiment: when asked about strategies used for homing, all participants reported using congurations of landmarks (scene matching). Some participants even used snapshot matching as a homing strategy: they approached the assumed starting point from “behind” and moved north until the current view matched the initial view from the starting point. (See gure 6 for an example.) We conclude that piloting and especially scene matching led to almost perfect homing performance, and played the dominant role in navigation. However, homing performance was not quite perfect, which might be due to the lack of salient objects close enough to be able to identify the starting position uniquely. We assume that homing accuracy would have improved further had we provided more salient, nearby landmarks like a location-specic ground texture, and added visibility of the virtual oor directly beneath the participants via a oor display. Figure 4. Nomenclature of a triangle to be traveled. The asterisks denote the homing trajectory end points for each participant, pooled over turning direction (left/right).
error was quite small. (See gure 13.) It was only 3.3% and 7.2% of the correct turning angle and homing distance, respectively, which is smaller than in experiment TURN&GO (5.2% and 23.0%, respectively). Moreover, between-subject distance variability was largely reduced.
4
Experiment 3: “TOWN&B LOBS”
In this experiment, we investigated triangle completion performance without reliable landmarks in two different environments: a 3D eld of blobs allowing only path integration via optic ow (see gure 1) and the naturalistic town environment used in the previous experiment, but with landmarks that were only temporarily available (town with scene swap).
Riecke et al.
455
Figure 5. Homing performance in the LANDMARKS experiment. The data is pooled over the turning direction (left/right) as it had no signicant inuence on homing performance. Plotted are the mean (centroid), the 95% condence ellipse2 (outer ellipse with thick line), and the standard ellipse (inner ellipse with thin line) for the homing endpoints.
Figure 6. Examples of trajectories for one participant indicating snapshot matching. For the homing task, the participant drove south of the assumed starting point, then turned north and approached it “from behind,” until the current view matched the original view from the starting spot. The non-straight trajectories further suggest that piloting is the dominant navigation mechanism, whereas path integration played only a minor role.
There are three primary questions here. First, can optic ow information alone be sufcient for accurate homing, given a large FOV and the physical reference
frame of a curved projection screen, or will we observe the strong regression towards stereotyped responses found in other studies (Kearns et al., 2002; Klatzky et al., 1990; Loomis et al., 1993; Marlinsky, 1999b; Pe´ ruch et al., 1997)? Second, where do the to-be-expected performance differences between navigation by optic ow and navigation by landmarks (experiment LANDMARKS) stem from? To disambiguate between the effect of landmarks (salient reference points) and naturalism of the scene, we included an intermediate condition (town with scene swap); it provides naturalism and photo realism of the scene, size cues, and so on, but it removes the landmark character from the objects by rearranging them before the return path (scene swapping). If piloting is the main source for visual navigation, scene swap should reduce performance to the level in the optic ow condition. If, on the other hand, naturalism, familiarity of the environment, or absolute size cues are important for navigation, optic ow performance should be inferior to scene-swap performance. Third, at what part of the navigation process do systematic errors occur? Experiment TURN&GO demonstrated negligible turn execution errors and small errors
456
PRESENCE: VOLUME 11, NUMBER 5
Table 4. Experimental design for the TOWN&BLOBS experiment Independent variable
Levels
Varied
Values
a 5 turning angle at rst corner turning direction scene
5 2 2
within block within block between blocks
a [ {30, 60, 90, 120, 150 deg.} left or right 3D eld of blobs or town environment
The isosceles triangles had a constant segment length of s1 5 s2 5 40 m. The different values for a correspond to correct homing distances s3c [ {20.71, 40, 56.57, 69.28, 77.27 m} and correct turning angles at the second corner b c [ {105, 120, 135, 150, 165 deg.}.
for distances reproduction (slight compression and considerable variability, but no general over- or undershooting). If mental spatial reasoning is easy and error free, navigation performance should be comparable to the TURN&GO experiment. Conversely, large systematic errors or variability would suggest difculties in the mental “computation” of the homing trajectory or in the perception and encoding of angles. 4.1 Methods 4.1.1 Participants. Ten female and ten male na¨õ ve participants, seventeen to thirty years old (mean: 24.2 years, SD: 3.4 years), participated in this experiment. Four participants had to be replaced, because they had extreme difculties with the experiment. Their behavior showed no correlation with the requirements of the particular trials; for instance, angular and/or distance responses were not correlated with the triangle geometry. Additionally, they had problems understanding the instructions and took much longer to complete the training phase. Only one participant experienced symptoms of simulation sickness and preferred not to nish the experiment. 4.1.2 Scenery. The experiment was performed in two different virtual environments: the simple 3D eld of blobs from the rst experiment (T URN&GO) and the more complex town environment from the second experiment (LANDMARKS). To exclude object recognition and scene matching as a possible homing strategy in the
town environment, all landmarks (such as houses and streets) in the scene were repositioned or replaced by others during the brief dark interval just before the onset of the return path (the scene swap condition). The changed landmarks were arranged to form a differentlooking green square of about twice the original size, with the participant located at its center. After a few training trials, participants reported no longer being confused or disoriented by the scene-swap procedure. In the eld of blobs environment, all blobs were randomly repositioned before the return path. Using scene swap in the town environment, participants could use piloting during the excursion (to build up a mental spatial representation) but not for the homing task, as there were no objects left to indicate where the starting point was. 4.1.3 Procedure. A repeated-measures, withinsubject design was used. (See table 4.) For each block, each participant was presented with sixty isosceles triangles in random order, corresponding to a factorial combination of six repetitions for ve different angles of the rst turn and two turning directions varied within a block, and two scenes varied across blocks. The order of the within-block conditions (angles and turning direction) was randomized, and the order of the betweenblock conditions (scenes) was counterbalanced across participants. There was no time limit for completing the tasks and no feedback about performance accuracy during the test phase. Typically, the test phase lasted about one hour.
Riecke et al.
457
4.1.3.1 Elimination of Outliers. Some participants reported not having paid attention for some trials or having accidentally terminated a trial too early. To reliably eliminate those outliers for all participants, we developed the following criterion: there were always six repetitions per experimental condition (triangle geometry). If one of the six endpoints of those trajectories came to lie outside of a 4.5 s standard ellipse around the ve remaining endpoints, it was eliminated from the further analysis. A total of 132 trials (or 5.5% of the trials) were eliminated due to this criterion. 4.1.3.2 Training Phase. After reading the experimental instructions, participants participated in a twophase training session that lasted about 40 min. The training phases were similar to the actual experiment, but they used additional feedback about the current position and orientation of the observer. Furthermore, triangle geometries were different from the test phase to ensure that there was no simple direct transfer (such as rote learning) or motor learning. Both training phases consisted of ten homing trials each. In the rst training phase, compass directions (N, S, E, W) were overlaid on the display to provide a global orientation aid, where “north” was dened by the initial heading for each trial. Additionally, a top-down (orthographic) view of the scene was presented on an extra monitor placed next to the participant. (See gure 7.) The current position and orientation of the participant was displayed (symbolized by a white arrow) as well as the triangle corner currently visible (goal symbolized by the vertical light beams). In the second training phase, the orientation aids were switched off during the navigation phase. After completing each trial, the orthographic view was briey presented (for 2 sec.) to provide feedback. The training phase was designed to help inexperienced participants overcome initial disorientation, to ensure a comparable level of prociency in virtual environments navigation, and to avoid the inuence of initial learning effects. In pilot experiments, we found that some participants initially had orientation problems in virtual environments without these additional orientation aids. This is consistent with Darken and Sibert
Figure 7. Top-down, orthographic view (here of the town environment) displayed on an auxiliary screen during training phase 1.
(1996) and Ruddle, Payne, and Jones (1997), who showed that disorientation in virtual environments can be overcome by additional orientation aids. 4.1.3.3 Test Phase. Each subject performed two experimental blocks (one block for each scene, sixty trials per block), in separate sessions on different days. The rst block began directly after the training session as just described, and the second block was preceded by an identical training session, but only 235 instead of 2310 trials long. Apart from that, the test phase was identical to experiment LANDMARKS. 4.2 Results and Discussion 4.2.1 Systematic Errors. Homing errors were analyzed using two separate repeated-measures, threeway ANOVAs (ve angles for two turning directions and two scenes) for the signed error of the two dependent variables (turning angle and distances traveled, respectively). The ANOVAs revealed a highly signicant main effect of the triangle geometry (angle a ) on distance error (F(4,76) 5 32.5, p , 0.0005), but not on turning error (F(4,76) 5 0.61, p . 0.6). None of the other factors or any of the interactions came close to
458
PRESENCE: VOLUME 11, NUMBER 5
Figure 8. Homing performance in experiment TOWN&BLOBS (larger ellipses with dashed lines) as compared to experiment LANDMARKS (smaller ellipses with solid line). The data is pooled over the independent variables turning direction (left/right) and scenery (town/blobs), as they had no signicant inuence on homing performance. Plotted are the mean (centroid), the 95% condence ellipse (inner ellipse with thick dashed line), and the standard ellipse (outer ellipse with thin dashed line) for the homing endpoints. The ellipses for the LANDMARKS experiment are smaller and include the origin, indicating less variability and more-accurate homing performance than in experiment TOWN&BLOBS without reliable landmarks. Nonoverlapping 95% condence ellipses indicate signicant performance differences (Batschelet, 1981).
signicance ( p . 0.25 in all other cases). In other words, neither the turning direction nor the scenery used had a signicant inuence on homing performance. For the further analysis, the data were pooled over both left and right turns and over the two scenes unless indicated differently. The pooled data are presented in gure 8, providing a rst impression of the homing results. The mean turning error is small, whereas the main effect of triangle geometry on distance error is obvious: the shortest homing distance is typically overshot (left plot), whereas larger homing distances are undershot (right plots), indicating a compressed range of responses. To quantify that behavior, the data are plotted differently in gure 9. It shows one representative experimental block by one participant for the town environment. The homing distance actually traveled is plotted against its corresponding correct value. As for all participants, a linear regression line ts well to the data and summarizes its main aspects: the slope (“gain factor”) is less
than 1, implying that the range of observed mean homing distances is smaller than the range of correct homing distances. The gain factor in this example is 0.57, indicating a compression of the response range, whereas perfect performance (no compression) would result in a gain factor of 1, indicated by the dashed line going straight through the origin. The y intercept well above zero indicates a regression (compression) towards mean homing distances larger than zero, and not just an overall scaling between stimulus and response. The general results are summarized in gure 12 and 13. Averaged over all participants, the distance gain was 0.60 6 0.07 (standard error of the mean, SE), indicating a general tendency to overshoot short distances and undershoot long distances. (See gure 12.) This tendency proved highly signicant (two-tailed t-test: t(19) 5 5.6, p , 0.0005). The gain factor for turning angles was 0.91 6 0.08, which is not signicantly below the correct value of 1 (t(19) 5 1.0, p . 0.3). This indicates that, on average, there was no systematic over- or
Riecke et al.
459
tance, respectively. The absolute turning error was more than three times larger than in both experiment TURN&GO and LANDMARKS (t(27) 5 3.77, p , 0.0008 and t(25) 5 4.03 p , 0.0005, respectively). The absolute distance error was comparable to experiment TURN&GO, and about four times larger than in experiment LANDMARKS (t(27) 5 1.10, p . 0.2, and t(25) 5 4.90, p , 0.0005, respectively). Thus, absolute distance error could be explained by the lack of reliable landmarks.
Figure 9. Behavioral response of one representative participant for the town environment. Actual values for distance traveled to complete the triangle (s3m, see gure 4) is plotted over its corresponding correct values (s3c ): left for left turns, right for right turns. The symmetry of the plot illustrates the similarity of the response for left and right turns. The mean values over the six repetitions are plotted for each of the ten triangle geometries (symbolized by the little icons). The boxes refer to the standard error of the mean; the whiskers depict one standard deviation.
undershooting of turning angles. The signed errors for turns and distances are 22.8 deg. 6 3.0 deg. and 20.9 m 6 1.6 m, respectively, indicating a slight but insignificant tendency to undershoot both turns and distances (t(19) 5 0.96, p . 0.3 and t(19) 5 0.56, p . 0.5, respectively). Compared to experiment LANDMARKS , the only signicant difference between sample means was in terms of distance gain (t(25) 5 23.42, p , 0.002). This indicates that the lack of reliable landmarks caused the tendency towards stereotyped homing distances in experiment TOWN&BLOBS. It further gave rise to a substantial increase in between-subject variability (F(19,6) 5 59.9, p , 0.0001 for turning error, F(19,6) 5 19.9, p , 0.002 for distance error, F(19,6) 5 25.4, p , 0.0007 for angular gain, and F(19,6) 5 188.8, p , 0.0001 for distance gain). 4.2.2 Absolute Errors. The absolute errors were rather pronounced (see gure 13), with 14.6% and 30.7% of the correct turning angle and homing dis-
4.2.3 Discussion. The lack of performance differences between the blobs and town environment suggests that participants were not able to take advantage of natural-looking landmarks that are only temporarily available. Hence, naturalism, familiarity of the scene, and absolute size cues did not play a signicant role, and piloting was the main source for visual navigation whenever possible. Path integration based solely on optic ow proved to be sufcient for correct mean turn responses and negligible turn compression for almost all participants. As was also found in the TURN&GO experiment, we did not nd the strong compression towards stereotyped turn responses typically found in the literature (Bakker et al., 1999, 2001; Kearns et al., 2002; Klatzky et al., 1990, 1997; Loomis et al., 1993; Pe´ruch et al., 1997; Sadalla & Montello, 1989; Wartenberg et al., 1998). A detailed comparison to the literature and discussion of potential origins of the observed performance differences will be provided in the general discussion (section 7). On the other hand, homing distance showed a considerable compression towards stereotyped responses. Most participants had a tendency to overshoot short distances and undershoot long distances, which is a phenomenon commonly found in the literature (Klatzky et al., 1997; Loomis, Klatzky, et al., 1999). The variability between participants was rather pronounced, though, which might be due to different navigation strategies used. We found no signicant learning effect between the rst and second block ( p . 0.05 for two-sided paired t-tests for all six dependent variables), indicating that further learning and task exposure did not improve performance.
460
PRESENCE: VOLUME 11, NUMBER 5
We know from experiment TURN&GO that turn execution errors are negligible. This suggests that, for all four experiments, the observed turning angle directly reects the turning angle intended by the participant. The same is true for distances traveled,3 but with a reduced precision. Hence, we can use the observed navigation behavior to infer about the intended navigation behavior and the underlying mental representation. Given the negligible turn execution error, the considerable absolute turn error and between-subject turn variability in experiment TOWN&BLOBS indicates that, without reliable landmarks, many participants had either problems in correctly encoding the turned angle or in mentally computing the desired homing angle. There is, however, some rather anecdotal evidence suggesting that encoding errors for turns are negligible, too. In general, participants were able to estimate turns well even when not actively controlling the motion, such as when the experimenter initiated the turn for demonstration purposes before the rst training phase, and they just observed. Most participants were even able to pinpoint the exact angles a turned in experiment TOWN&BLOBS or during the training phases, indicating a negligible encoding error for turns. Hence, the observed turning errors should be attributed to problems in mental spatial reasoning. There is no direct evidence on systematic encoding errors for distances traveled, as distances cannot be queried without referring to an absolute or relative scale. However, experiment TURN&GO presented evidence that participants can reproduce distances fairly well, suggesting that the distance traveled gives a rough estimate of the distance mentally represented and intended to travel. Potential scaling errors in distance encoding and execution were shown to cancel each other out and are thus irrelevant for our reasoning. 3. This is true if one assumes that participants cannot only intend and execute the same distances as traveled before (as demonstrated in experiment TURN&GO), but also intend and execute different, scaled distances. Results from experiment TOWN&BLOBS corroborate this assumption: for isosceles triangles with a c 5 90 deg., most participants knew that the correct homing distance was s3 5 2 z s2, or roughly 1.4 times the distance just traveled. Participants were indeed able to execute this intended distance quite accurately.
We can use this information to understand the origin of the strong distance compression (gain factor of 0.60 6 0.07) observed in experiment TOWN&BLOBS. Most participants realized after a few trials that s1 and s2 were equal and held constant. This suggests that s1 and s2 were encoded to the same, constant value, irrespective of a , and participants knew they were traveling isosceles triangles. This is corroborated by participants’ verbal statements. Given that systematic encoding errors for turns are negligible, we can conclude that participants had an essentially correct mental representation of the triangle geometry. The question arising now is where the observed errors in experiment TOWN&BLOBS (especially the rather pronounced distance compression) stems from, given that the mental representation was an isosceles triangle with approximately the correct angle a . An explanation we favor is that participants experienced problems in determining the correct homing response from the mental representation, even though they had all the information needed. Most participants, then, seem to be unable to mentally compute or somehow infer the correct homing distance from a known triangle geometry. This is also the main difference between the distance reproduction task in experiment TURN&GO and the triangle completion task in experiment TOWN&BLOBS: for the latter, participants had to use nontrivial mental geometric or spatial reasoning.
5
Experiment 4: “RANDOM TRIANGLES”
Experiment TOWN&BLOBS demonstrated that homing by optic ow or transient landmarks is possible and allows for decent homing performance, apart from a rather pronounced distance compression. A question that remains unanswered is how the simplicity of the triangle geometry (only isosceles triangles with angles a in 30 deg. steps) might have inuenced homing performance. To address this question, we used the triangle completion paradigm with the 3D eld of blobs again, but with novel triangles of completely randomized geometry for each trial. To our knowledge, navigating randomized triangle geometries has never been addressed in the literature. If participants had been able to
Riecke et al.
461
Table 5. Experimental design for the RANDOM TRIANGLES experiment Independent variable
Levels
Values
s1 5 length of segment 1 s2 5 length of segment 2 a 5 turning angle at 1st corner turning direction
60 (equally spaced) 60 (equally spaced) 60 (equally spaced) 2
s1 [ {20, 20.90, . . . , 73 m} s2 [ {20, 20.90, . . . , 73 m} a [ {20, 24.82 . . . , 160 deg.} left or right
take advantage of a simple, repetitive, isosceles triangle geometry in experiment TOWN&BLOBS, we would now expect a clear deterioration in homing performance: participants should be less certain about the correct homing response and therefore be more conservative in their response, leading to a more pronounced response compression as well as an increased variability and absolute error. 5.1 Methods 5.1.1 Participants. Participants were the same ten participants as in experiment TURN&GO. There was no reason to expect potential benets or direct learning transfer, as experiment TURN&GO did not provide any explicit performance feedback. Furthermore, comparing performance between the rst and the second block of experiment TOWN&BLOBS demonstrated that even exposure to the same task did not improve performance. Hence, different amounts of exposure to VR and VR experiments do not seem to be a critical issue, indicating that comparisons between the experiments presented in this paper are legitimate. 5.1.2 Procedure. The experimental procedure was the same as in experiment TOWN&BLOBS using the 3D eld of blobs but using different triangle geometries for each trial. As before, triangle geometries in the training phase were different from the test phase to ensure that there was no simple direct transfer (such as rote learning) or motor learning possible. The experimental design is summarized in table 5. Each participant completed sixty trials. For each trial, values for the length of the rst segment, the second
segment, and the enclosed turning angle were drawn independently, randomly, and without replacement from a set of sixty equally spaced values each. Additionally, the turning direction was chosen randomly. There was no repetition of conditions, which ensured that participants could not memorize individual triangle geometries and utilize them directly in a later trial, as might have been possible in experiment TOWN&BLOBS. 5.2 Results 5.2.1 Signed Errors. Results are summarized in gure 12 and 13. Mean turning error and distance error were remarkably small and did not differ signicantly from zero or from the results from experiment TOWN&BLOBS. However, the between-subject variance of the distance error was signicantly increased, compared to experiment TOWN&BLOBS (F(9,19) 5 5.0, p , 0.004), whereas the variance of the angular error remained unchanged (F(19,9) 5 1.7, p . 0.4). 5.2.2 Gain Factors. Both angular and distance response showed an obvious compression with gain factors of 0.76 and 0.85, respectively, which was signicantly below the correct value of 1 (t(9) 5 5.0, p , 0.0008 and t(9) 5 3.9, p , 0.004, respectively). The angular compression was slightly but insignicantly more pronounced than in experiment TOWN&BLOBS (t(28) 5 1.3, p . 0.2). In contrast, distance compression was signicantly reduced (t(28) 5 2.6, p , 0.02). Interestingly enough, the variance of both angular and distance gain was signicantly reduced, compared to experiment TOWN&BLOBS (F(19,9) 5 6.0, p , 0.009 and F(19,9) 5 6.5, p , 0.007, respectively).
462
PRESENCE: VOLUME 11, NUMBER 5
Table 6. Results of the correlation analysis for experiment RANDOM TRIANGLES between the error for distances and turns (rst column) and the parameters in the second column Correlation between dist. error dist. error dist. error dist. error dist. error dist. error dist. error turn error turn error turn error turn error turn error turn error turn error turn error
s1 s2
a
b
s2/s1 s2 2 s1 s3c c
s1 s2
a
b
s2/s1 s2 2 s1 s3c c
dist. err.
r
r2
t(8)
p
20.310 20.176 20.007 0.095 0.086 20.256 0.015 0.263 20.224 20.030 20.290 20.338 20.044 0.357 0.126
0.096 0.031 0.0 0.009 0.007 0.066 0.0 0.069 0.050 0.001 0.084 0.114 0.002 0.128 0.016
5.9 4.4 0.28 2.0 2.0 4.0 0.25 5.8 3.9 1.3 5.5 5.4 0.74 4.3 1.9
0.00027 0.0017 0.78 0.073 0.080 0.0031 0.80 0.00027 0.0037 0.21 0.00039 0.00045 0.48 0.0020 0.087
The Pearson correlation coefcient, r, and r2, the coefcient of determination, were computed by performing a correlation for each participant’s data individually, transforming the resulting r-values (via a Fisher r-to-Z transformation) into Z-values, taking their mean, and transforming the mean back via the inverse transformation (Fisher Z-to-r transformation) into mean r-values. To test whether the correlation coefcients differ signicantly from zero (“not correlated”), a two-tailed t-test was calculated for the r-to-Z transformed r-values of the individual participant’s data. The resulting signicance level is displayed in the last column.
5.2.3 Correlation Analysis. The details and results of pairwise correlation analyses are summarized in table 6. The analyses revealed a strong correlation between the independent variables s1, s2, and s3c and the observed distance error. For increasing values of s1, s2, and s3c, the distance response shifted from an overshoot to an undershoot, indicating a tendency of the participants to produce medium-sized triangles. The inuence of s1 and s2 on turning error is best understood by looking at the inuence of their ratio (s2/s1) or difference (s2 2 s1): for triangles with a shorter second segment (s2 , s1), turning angles are increasingly overshot. Conversely, turning angles are increasingly undershot for triangles with a longer second segment (s2 . s1). This highly signicant correlation explains about r 2 5 11.4% of the variance in homing errors.
However, distance and turning errors were not independent from each other: distance error increased with increasing turning error. Interestingly enough, the turning angle a between the rst and second segment did not show any systematic inuence on the pattern of homing errors. The strong correlation between distance error and correct homing distance, s3c , and between turning error and correct homing angle, b c , expresses the distance and turn compression previously described. 5.2.4 Absolute Errors. Mean absolute errors for turns and distances did not differ signicantly from experiment TOWN&BLOBS (t(28) 5 0.28, p . 0.7 and t(28) 5 21.53, p . 0.1, respectively). Between-subject variability was, however, slightly decreased for turns and
Riecke et al.
463
increased for distances (F(19,9) 5 2.9, p 5 0.053 and F(9,19) 5 3.5, p , 0.01, respectively). 5.3 Discussion The most striking results from this experiment are the relatively small variability of gain factors and the less pronounced distance compression, compared to experiment TOWN&BLOBS. This is all the more astonishing, as the variability in signed as well as absolute distance error was signicantly increased. The correlation analyses revealed a regression towards stereotyped responses: for “extreme” triangles (extreme values of s1, s2, s3c, s2 2 s1, and a c), participants responded as if those values weren’t as extreme. This could be interpreted as a tendency to opt for the “safe bet” for difcult triangle geometries. However, there was no overall performance deterioration as compared to experiment TOWN&BLOBS. This suggests that neither motor learning, direct learning transfer between trials, nor the simplicity of isosceles triangles was a determining factor for homing accuracy in experiment TOWN&BLOBS. Participants were apparently unable to take advantage of the relatively simple and repetitive triangle geometry in experiment TOWN&BLOBS.
6
Experiment 5: Spatial Imagination Abilities Tests
To investigate whether mental spatial abilities might be a determining factor for homing accuracy, we performed two standard, paper-and-pencil spatial imagination abilities tests with the participants from experiment TOWN&BLOBS and RANDOM TRIANGLES and correlated the results with the homing performance. Test 1 was a “Schlauchguren-Test,” (Stumpf & Fay, 1983), in which participants saw in each trial one picture of a tube folded inside a transparent cube, and had to decide from which viewpoint a second picture of the same object was taken (gure 10, top pictures). Participants were asked to complete 21 trials in 12 min. The second test was a “Wu¨ rfel Erkennen Test,” part six of the “In-
Figure 10. Sample stimulus from spatial imagination abilities test 1 (top) and test 2 (bottom).
telligenz Struktur Analyse Test” (ISA, 1998), in which participants had to judge the identity of cubes seen from different directions. (See gure 10, bottom picture.) Participants were asked to complete seventeen trials in 18 min. Responses for both tests were given in a multiple-choice type manner. A correlation analysis was conducted between the test results (percentage of correct responses) and the absolute error and absolute value of the signed error for turns, distances, angular gain factor, and distance gain factor. We used fourteen of the twenty participants from experiment TOWN&BLOBS and all ten participants from experiment R ANDOM TRIANGLES. If the mental spatial reasoning phase was indeed the main cause for the observed systematic errors as we proposed in subsection 4.2.3, at least one of the error measures should be negatively correlated with the test performance and none positively. Additionally, we expect a higher correlation for experiment RANDOM TRIANGLES, which required more-complex spatial reasoning. To test these hypotheses, one-sided t-tests were conducted. The results for p , 0.15 are summarized in table 7. Five error measures were signicantly correlated ( p , 0.05) and ve more approached signicance ( p , 0.1).
464
PRESENCE: VOLUME 11, NUMBER 5
Table 7. Results of the correlation analysis between homing performance in experiments TOWN&BLOBS and RANDOM TRIANGLES and the number of correct trials in two mental spatial abilities test. Only correlations that were signicant on at least a p 5 0.15 level are displayed Measurand
Spatial imagination test
r
r2
t
p
0.17 0.13 0.30
t(12) 5 1.6 t(12) 5 1.3 t(12) 5 2.3
0.070 0.10 0.021
0.45 0.23 0.62 0.23 0.43 0.29 0.49
t(8) 5 t(8) 5 t(8) 5 t(8) 5 t(8) 5 t(8) 5 t(8) 5
0.016 0.081 0.0035 0.080 0.019 0.0532 0.012
TOWN&BLOBS abs. turn. error abs. dist. error u signed turn. erroru
test 2 test 2 test 2
20.42 20.36 20.55 RANDOM TRIANGLES
abs. dist. error abs. turn. error abs. dist. error u signed turn. erroru u signed dist. erroru u signed turn. erroru u signed dist. erroru
test test test test test test test
1 2 2 1 1 2 2
All correlations were either negative or negligible ( p . 0.15), indicating that a good test result coincided with a small error measure and hence a good homing performance. For experiment RANDOM TRIANGLES, which required more complex mental spatial reasoning, both test results correlated nicely, especially with the distance error measures, and were able to explain up to 62% of the rather large variance. (See table 7.) We conclude that mental spatial ability, as assessed by both tests, correlates positively with homing performance, especially for the more complex task in experiment RANDOM TRIANGLES. This suggests that mental spatial ability might be a determining factor for homing performance in triangle completion experiments based on path integration. This nding agrees well with our explanation of the homing errors proposed earlier. However, further experiments are needed to corroborate this hypothesis, as the number of participants in this study was rather limited and we did not test to what degree general intelligence and nonspatial abilities might be a contributing factor.
20.67 20.48 20.79 20.48 20.66 20.54 20.70
7
2.6 1.5 3.6 1.6 2.5 1.8 2.8
General Discussion 7.1 Comparison with Previous Work
7.1.1 Nonvisual Navigation Experiments Based on Path Integration. To test simple path integration performance, Klatzky et al. (1990) and Loomis et al. (1993) asked participants to reproduce walked distances and turns while blindfolded. (See Klatzky et al. (1997) for a comparison.) Turn performance was comparable to experiment TURN&GO when turns were made within a circular hoop surrounding the participant (gain factor 5 0.99) (Klatzky et al., 1990), but decreased for turns performed without the hoop (gain factor 5 0.82) (Loomis et al., 1993). Distance reproduction showed a slightly increased compression towards stereotyped responses compared to experiment TURN&GO (gain factors 5 0.75 and 0.81, respectively). This suggests that, at least for elementary rotations and translations, visual path integration performance is by no means inferior to path integration by kinesthetic and vestibular cues from blind walking.
Riecke et al.
465
Figure 11. Homing performance under different conditions, plotted as in gure 5 and 8. Dotted lines represent results for visual triangle completion within a circle of equal cylinders (reanalysis of data from Pe´ruch et al. (1997), data from experiment 1 and 2 pooled) and dashdotted lines for blind walking (reanalysis of data from Loomis et al. (1993), experiment 1, triangles with s1 5 s2 5 4 m). Data from Pe´ruch et al. and Loomis et al. is scaled to t the triangles used in our experiments.
For triangle completion tasks, vestibular and proprioceptive cues from blind walking do not seem to allow for homing without considerable systematic errors (Kearns et al., 2002; Klatzky et al., 1990; Loomis et al., 1993; Marlinsky, 1999b; Sauve´, 1989). Participants typically overturned for small correct turning angles (, 90 deg.) and underturned for large turning angles (. 90 deg.). The same compression towards stereotyped re-
sponses was found for distances traveled: short distances were overshot, and large distances were undershot. This bias is a commonly found trend in psychophysical experiments (Poulton, 1979; Stevens & Greenbaum, 1966). Loomis et al. (1993), in accordance with Klatzky et al. (1990) concluded that “not only were there signicant signed errors for the average of all subjects but also no single subject came close to exhibiting negligible errors
Figure 12. Comparison of navigation performance for the different experimental conditions. At the top of each plot, the experimental conditions are displayed (from left to right): Exp. 1 (TURN&GO); Exp. 2 (LANDMARKS ) with reliable landmarks; Exp. 3, using the 3D eld of blobs (BLOBS), the town environment (TOWN) and data from both blocks pooled together (TOWN&BLOBS); Exp. 4 (RANDOM TRIANGLES); reanalysis of data from Pe´ruch et al. (1997) on visual triangle completion within a circle of equal cylinders for isosceles triangles only (PERUCH97 ISOSC.) and for all triangles (PERUCH97 ALL); reanalysis of data from Loomis et al. (1993) on blind walking triangle completion, again for isosceles triangles with s2 5 4 m only (LOOMIS93 ISOSC.) and for all triangles (LOOMIS93 ALL). Data from Pe´ruch and Loomis is scaled to match the triangle size used in our experiments. Following are the plots of the four measures, the center indicating the arithmetic mean. Boxes represent intervals of one standard error of the mean; whiskers represent one standard deviation. The gain factor was dened as the slope of the linear regression t. At the bottom of each plot, the numeric values of the mean, standard error, and standard deviation are displayed. The asterisks indicate whether the mean differs signicantly (on a 5%, 0.5%, or 0.05% signicance level, using a two-tailed t-test) from the corresponding correct value, depicted as a thick horizontal line.
466
PRESENCE: VOLUME 11, NUMBER 5
Riecke et al.
467
Figure 13. Absolute error for the different experimental conditions, plotted as in gure 12. The absolute value is taken for each individual trial before taking the mean.
over the 27 triangles. It appears that even for the short paths over which participants were passively guided here [2, 4, and 6 m segment length, remark by the authors], the proprioceptive and vestibular cues were inadequate for accurate path integration” (p. 83– 84). For comparison to our results, data from Loomis et al. (1993) were reanalyzed and plotted in gure 11, 12, and 13. Mean turning errors were close to zero, but showed a rather large variance that was signicantly larger than for experiment TOWN&BLOBS (F(36,19) 5 3.6, p , 0.004 for isosceles triangles). All other measures were substantially below their correct value, indicating general undershooting and biases towards stereotyped responses (response compression). Path integration accuracy for blind walking decreases further when proprioceptive cues are reduced to mainly vestibular cues from wheelchair transportation (Marlin-
sky, 1999b; Sholl, 1989). Several additional factors inuence path integration performance, including stimulus context and task specicities (Klatzky et al., 1997; Loomis, Klatzky, et al., 1999). For return-to-origin task, the number of linear segments and turns increase both response time and error, especially when segments cross each other (Klatzky et al., 1990; Loomis et al., 1993). Blind triangle completion experiments by Mittelstaedt and Glasauer (1991) revealed an inuence of the walking speed: participants overshot distances for walking speeds that were faster than normal and undershot distances for slow walking speeds. This relation reversed polarity for passive (wheelchair) transportation. 7.1.2 Triangle Completion Experiments with HMD. Kearns et al. (2002) and Duchon et al. (1999) conducted triangle completion experiments in a virtual
468
PRESENCE: VOLUME 11, NUMBER 5
environment consisting of a large round room with uniformly textured walls and oor. In one condition, ego motion was controlled using a joystick and visually presented via a non-headtracked HMD with a FOV of 40360 deg. Participants’ homing performance was sensitive to changes in segment length of the triangle, suggesting that they were able to integrate optic ow from translations to yield the distance traveled. In contrast, participants’ mean homing response reected no sensitivity to variations in turning angle a : for isosceles triangles with angles a {60 deg., 90 deg., 120 deg.}, participants produced the same mean response regardless of actual triangle geometry, acting as if traveling an equilateral triangle. Without the external reference frame of the physical surround, participants seemed to be unable to use the rotational optic ow to extract the turning angle. This effect was not found in the present experiments or the experiments by Pe´ruch et al. (1997), all of which used projection screens. This suggests that the type of display (HMD versus projection screen) and hence the external reference frame available might inuence the sensitivity to angles turned. In another condition (Kearns et al., 2002, exp. 3), participants wore a headtracked HMD and physically walked triangles, with the triangle corners being indicated visually as before. Homing results showed a reduced variability, reecting a higher subjective condence. However, participants still gave the same stereotyped response irrespective of the turning angle a . Compared to the tendency to underturn by 7.1 deg. (SD: 35.9 deg.) for purely visual navigation in the rst condition, physical walking led to a general overturning by 19.9 deg. (SD: 27.1 deg.). Removing all visual information except the poles denoting the triangle corners hardly altered participants’ responses, indicating that the proprioceptive cues from walking dominated over optic ow information. This overturning and lack of stimulus response for physical rotations was not found for blind walking experiments (Klatzky et al., 1990; Loomis et al., 1993; Marlinsky, 1999b) and can hence not be simply attributed to proprioceptive cues from walking. Consequently, the effect seems to be caused by the visual display presenting the triangle to be traveled. (See subsection 7.2.)
7.1.3 Triangle Completion Experiments with Projection Screens. Loomis et al. (1993) and Klatzky et al. (1990) have shown that kinesthetic and vestibular cues from blind walking are inadequate for accurate path integration as assessed by triangle completion experiments. Pe´ruch et al. (1997) conducted comparable triangle completion experiments in virtual reality to investigate human path integration ability based on visual information (optic ow). Participants used a joystick to move within an area surrounded by sixteen identical cylinders equally spaced on a circle of 60 m diameter. The simulated ego motion was displayed on a planar projection screen subtending a physical FOV of 45 deg. horizontal and 38 deg. vertical. Participants had to complete 27 triangles corresponding to a factorial combination of three values for the simulated eld of view (horizontal sFOV 5 40, 60, and 80 deg.) with nine triangle geometries (three angles and three lengths of the second segment). Interestingly enough, the sFOV had no signicant effect on homing performance. For comparison to our results, data from Pe´ ruch et al. (1997) were reanalyzed and plotted in gure 11, 12, and 13. Participants showed a general undershoot for both turning angles and distances traveled. Results also revealed a strong regression towards stereotyped values for turning angles and distances traveled, especially for isosceles triangles. (See gure 12.) All those effects were stronger than in the blind walking studies by Loomis et al. (1993) and Klatzky et al. (1990), suggesting that path integration by optic ow is inferior to path integration by kinesthetic and vestibular cues. The experiments presented in this paper contradict this notion. They demonstrated equal or superior performance compared to nonvisual path integration. The most obvious difference in homing results between experiments by Pe´ruch et al. (1997) and all other experiments in gure 12 is the strong general undershooting of turning angles. This might be related to the turn execution error observed by Pe´ruch et al. When asked to turn around by 180 deg., participants responded by turning only 150.4 deg. 6 0.9 deg., corresponding to a underturn by 16%. A similar general underturning of 15% (or 20.3 deg.) was observed for isosceles triangles. Could this execution error of under-
Riecke et al.
turning by 16% explain the underturn of 15% observed for triangle completion, rather than an encoding error as proposed by the authors? Compared to experiment TOWN&BLOBS, visual homing performance for isosceles triangles by Pe´ ruch et al. yielded signicantly reduced homing performance for all performance measures displayed in gure 12 and 13 (u t(44)u . 2.1, p , 0.05). The question arises as to where the obvious performance difference between experiment TOWN&BLOBS and experiments by Pe´ruch et al. stem from. The execution error of underturning observed by Pe´ruch et al. can explain only the differences in signed turning errors. The remaining performance differences might be caused by the different experimental procedures (training phase, number of triangles). They might, however, also be due to differences in the VR set-up: Pe´ruch et al. used a joystick and a planar projection screen with nonmatched simulated and physical FOV, whereas mouse button-based navigation and a half-cylindrical projection screen with matched simulated and physical FOV was used for experiment TOWN&BLOBS. Technical limitations in the study by Pe´ruch et al. might also have reduced overall performance. Further experiments might provide a more denitive answer to this question. 7.1.4 Origin of Systematic Homing Errors. To analyze potential origins of the systematic homing errors, Loomis et al. (1993) and Pe´ruch et al. (1997) applied an “encoding error model.” This model was initially proposed by Fujita et al. (1993) to explain their blind walking data, and it attributes all systematic homing errors to errors in mentally encoding the distances walked and angles turned. It assumes that the internal representation of the triangle satises Euclidean geometry (axiom 1), that distances are coded by just one function (that is, equal distances or turning angles are encoded as equal (axiom 2 and 3)), and that there is no systematic error in either the computation of the homeward trajectory or its execution (axiom 4). Loomis et al. (1993) and Pe´ruch et al. (1997) concluded that a compression in the encoding of turns and distances is the only source of the observed systematic errors. Pe´ruch et al. argued for a nonlinear compression according to a power function with exponents below 1,
469
whereas Fujita et al. and Loomis et al. used a simple linear compression. For the study by Pe´ruch et al., there is, however, some evidence that the assumption of no execution error (axiom 4) are not met: Pe´ruch et al. reported a signicant systematic undershooting by 16% (29.4 deg. 6 0.9 deg.) for requested simple 180 deg. turns. This indicates a turn execution error, which in turn violates axiom 4 of the encoding error model. This implies that we cannot simply ascribe all systematic errors to encoding errors. In our studies, systematic encoding and execution errors were negligible for turns and small or irrelevant for distances, and could by no means explain the observed systematic homing errors. We thus argue that participants in our studies mainly had problems with mentally determining the correct homing response. (See subsection 4.2.3.) This was conrmed by experiment 5, which showed that participants with good mental spatial abilities had fewer problems determining the correct homing response from the information available. Furthermore, we found evidence that the mental determination of the homeward trajectory was not void of systematic errors: axiom 2 predicts that participants knew in experiment TOWN&BLOBS that they were traveling isosceles triangles. This is also corroborated by our questionnaires: almost all participants consciously knew they were traveling isosceles triangles. Geometry tells us that, for all isosceles triangles, the nal turn has to be between 90 deg. and 180 deg., and cannot be less than 90 deg. (or the path would not be closed). Five out of twenty participants, however, showed mean nal turning angles of less than 90 deg. (for isosceles triangles with a 5 630 deg.), which contradicts axiom 4 or axiom 1. Hence, we have to reject the encoding error model for our data, as at least one axiom is clearly not satised. Attempts to nevertheless apply this encoding error model to our data produced nonsensical results that violated trigonometry (negative values for encoded angles or distances). It remains to be seen whether those systematic errors in the mental spatial reasoning phase also occur in the absence of vision (such as blind walking). A lack of generalization to blind walking would have far-reaching
470
PRESENCE: VOLUME 11, NUMBER 5
implications for the understanding of human spatial reasoning and the design of human– computer interfaces. 7.2 General Conclusion The experiments reported here were designed to investigate human navigation ability based solely on visual path integration. The literature indicates that “humans are incapable of navigating precisely by path integration alone” (See Loomis, Klatzky, et al. (1999) (p. 143) and Klatzky et al. (1997) for a review.) We found, however, that untrained participants were able to reproduce distances and perform turns with relatively small systematic errors, irrespective of movement velocity (experiment TURN&GO). Especially for rotations, the systematic errors and variance both within- and between-subject were strikingly small, much smaller than for nonvisual turning (Bakker et al., 1999, 2001; Klatzky et al., 1990; Loomis et al., 1993; Marlinsky, 1999a). This nding is in sharp contrast with results from turning experiments by Bakker et al. (1999, 2001): without feedback training, visual information displayed via an HMD led to turning errors that were more than ten times larger than in experiment TURN&GO (for signed error, absolute error, and between-subject variability). Using a at projection screen with a small FOV, Pe´ruch et al. (1997) found an undershoot of purely visually displayed rotations by 16%. This suggests that the half-cylindrical projection screen used in the present study is the determining factor for the excellent turning performance observed there. However, the large FOV of 180 deg. does not seem to be the sole determining factor for turning accuracy, even though increasing the FOV has been shown to facilitate navigation (Alfano & Michel, 1990; Arthur, 2000; Ruddle & Jones, 2001). In a study comparable to experiment TOWN&BLOBS, we found that systematically reducing the FOV while leaving the reference frame of the half-cylindrical projection screen visible only slightly decreased homing performance (Riecke, 1998, exp. 4). This suggests that the half-cylindrical reference frame provided by the projection screen and the visibility of one’s own body plays a critical role for navigation performance. Most participants experienced few difculties
determining egocentric angles between objects presented on the screen. The half-cylindrical reference frame might facilitate the estimation of egocentric angles by suggesting a polar coordinate system. This hypothesis is corroborated by the fact that we did not nd the strong bias towards stereotyped turn responses that are typically observed for triangle completion experiments (Kearns et al., 2002; Klatzky et al., 1990; Loomis et al., 1993; Pe´ruch et al., 1997). On the other hand, at projection screens or displays in noncircular rooms typically lead to systematic distortions in the judgment of egocentric angles. HMDs appear to produce even more-extreme distortions: participants showed no sensitivity to turning angles and produced the same response regardless of actual triangle geometry (Kearns et al., 2002). This was found for purely visual navigation as well as head-tracked walking. Further experiments are planned to disentangle the individual contributions of display geometry, FOV, spatial reference frames, and visibility of one’s body for spatial orientation in virtual environments. Contrary to our expectation, most participants were not able to take advantage of natural-looking landmarks if they were only temporarily visible, indicating that naturalism of the scene did not play an important role (experiment TOWN&BLOBS). The reasons for this remain unclear. Longer exposure to virtual environments and the experimental procedures might allow participants to develop more efcient strategies, as was demonstrated by Riecke (1998, exp. 4). Conversely, triangle completion experiments with stable, reliable landmarks demonstrated that piloting by salient landmarks and visual scene matching plays a dominant role in visual navigation, is used whenever possible, and leads to almost perfect homing performance (experiment LANDMARKS ). It is often claimed that kinesthetic and vestibular cues are necessary for spatial orientation tasks involving rotations of the observer (Bakker et al., 1999; Chance et al., 1998; Klatzky et al., 1998; May et al., 1995). (See subsection 1.4.) It might well be that purely visually displayed movements do not allow for the rapid, obligatory spatial updating found for physical movements (Farrell & Robertson, 1998; May & Klatzky, 2000; Rieser, 1989; Wang & Simons, 1999). However, the
Riecke et al.
lack of all nonvisual cues in the present experiments did not prevent participants from executing turns, reproducing distances, and performing triangle completion tasks with rather small systematic errors. Extended exposure to virtual environments, unlimited response time, and the spatial reference frame and large FOV provided by the half-cylindrical projection screen might all contribute to the relatively good overall navigation performance. For the triangle completion experiments, initial feedback training might also have improved performance and inuenced navigation strategies. Optic ow, presented via a half-cylindrical projection screen, provided nevertheless sufcient information to solve the tasks. For visual turning experiments, Bakker et al. (2001) found that feedback training does improve performance, but they conclude that this improvement can “especially be attributed to a reduction in bias and not to a reduction of the variability of participants’ performance” (p. 222). In experiment TURN&GO, negligible turning bias was found without any training, indicating that there was simply no need to calibrate turns. Distance responses and especially mental spatial reasoning, however, might indeed have improved due to the training. Further experiments are needed to determine what (if any) inuences prior training has on spatial orientation in virtual and real environments. We can only speculate how our results would transfer to more general navigation tasks. If navigation of morecomplex, multisegment, or continuous routes is based on the same underlying processes, we would expect that mental spatial abilities are again the determining factor for navigation performance. This would in turn predict that each additional segment or turn increases the cognitive load and thus the navigation error, especially for path congurations that are mentally more difcult to picture. For pure path integration (such as when participants continuously update some kind of homing vector), response time for homing should not depend on path complexity. Only if participants build up some form of mental representation of the whole path would we predict that the response time also increases with path complexity. Klatzky et al. (1990) and Loomis et al. (1993) found that additional path segments increase
471
homing error as well as response time. This is incompatible with the homing vector hypothesis and suggests that participants build up some mental representation of the whole path, which is in turn used to determine the homing response. The performance decrease was stronger for segments crossing each other, which might be explained by an increased difculty in representing the route. It should, however, be remembered that any salient landmark potentially leads to a piloting-based navigation strategy and dominates navigation performance. Using a virtual reality setup proved to be a powerful method to investigate human navigation abilities and investigate the underlying mental spatial processes. The scene swap paradigm and the 3D eld of blobs allowed us to reduce possible navigation mechanisms to purely visual path integration without any landmarks. Using this paradigm, we were able to demonstrate that purely visual path integration is indeed sufcient for basic navigation tasks like rotations, translations, and homing by triangle completion. Furthermore, display geometry, the reference frame provided by the display boundaries, and the visibility of one’s own body seem to inuence navigation strategies and performance and should be carefully considered in designing virtual reality interfaces.
Acknowledgments We thank Loomis et al. (1993) and Pe´ruch et al. (1997) for letting us use their raw data. We especially thank Jack M. Loomis, Patrick Pe´ruch, Douglas W. Cunningham, and Markus von der Heyde for interesting and helpful discussions and comments on earlier versions of this manuscript. While in Tu¨bingen, Henricus A. H. C. van Veen was funded by the Max Planck Society and the Deutsche Forschungsgemeinschaft (MA 1038/6-1, 1038/7-1).
References Alfano, P. L., & Michel, G. F. (1990). Restricting the eld of view: Perceptual and performance effects. Perceptual and Motor Skills, 70, 35– 45. Arthur, K. W. (2000). Effects of eld of view on performance
472
PRESENCE: VOLUME 11, NUMBER 5
with head-mounted displays. Unpublished doctoral dissertation, Department of Computer Science, University of North Carolina, Chapel Hill. (Available online: http://www. cs.unc.edu/ arthur/diss/) Bakker, N. H., Werkhoven, P. J., & Passenier, P. O. (1999). The effects of proprioceptive and visual feedback on geographical orientation in virtual environments. Presence: Teleoperators and Virtual Environments, 8(1), 36 –53. ———. (2001). Calibrating visual path integration in VEs. Presence: Teleoperators and Virtual Environments, 10(2), 216 –224. Batschelet, E. (1981). Circular statistics in biology. London: Academic Press. Bremmer, F., & Lappe, M. (1999). The use of optical velocities for distance discrimination and reproduction during visually simulated self motion. Exp. Brain Res., 127(1), 33– 42. Bu¨lthoff, H. H., & van Veen, H. A. H. C. (2001). Vision and action in virtual environments: Modern psychophysics in spatial cognition research. In L. R. Harris & M. Jenkin (Eds.), Vision and attention. New York: Springer. Chance, S. S., Gaunet, F., Beall, A. C., & Loomis, J. M. (1998). Locomotion mode affects the updating of objects encountered during travel: The contribution of vestibular and proprioceptive inputs to path integration. Presence: Teleoperators and Virtual Environments, 7(2), 168 –178. Darken, R. P., & Sibert, J. L. (1996). Navigating large virtual spaces. International Journal of Human-Computer Interaction, 8(1), 49 –71. Duchon, A., Bud, M., Warren, W. H., & Tarr, M. J. (1999). The role of optic ow in human path integration. Proceedings of the 40th Annual Meeting of the Psychonomic Society, p. 48. Farrell, M. J., & Robertson, I. H. (1998). Mental rotation and the automatic updating of body-centered spatial relationships. J. Exp. Psychol.-Learn. Mem. Cogn., 24(1), 227– 233. Fujita, N., Klatzky, R. L., Loomis, J. M., & Golledge, R. G. (1993). The encoding-error model of pathway completion without vision. Geographical Analysis, 25(4), 295–314. Golledge, R. G. (Ed.). (1999). Waynding behavior: Cognitive mapping and other spatial processes. Baltimore: Johns Hopkins. Hendrix, C., & Bareld, W. (1996). Presence within virtual environments as a function of visual display parameters. Presence: Teleoperators and Virtual Environments, 5(3), 274 –289.
Hettinger, L. J., Nelson, W. T., & Haas, M. W. (1996). Target detection performance in helmet-mounted and conventional dome displays. International Journal of Aviation Psychology, 6(4), 321–334. Hunt, E., & Waller, D. (1999). Orientation and waynding: A review. (Available online: http://depts.washington.edu/ huntlab/vr/pubs/huntreview.pdf) ISA. (1998). Intelligenz-Struktur-Analyse. Frankfurt: Sweets & Zeitlinger B. V., Sweets Test Services. (ITB Institut fu¨r Test- und Begabungsforschung GmbH, Bonn). Kappe, B., van Erp, J., & Korteling, J. E. H. (1999). Effects of head-slaved and peripheral displays on lane-keeping performance and spatial orientation. Human Factors, 41(3), 453– 466. Kearns, M. J., Warren, W. H., Duchon, A. P., & Tarr, M. J. (2002). Path integration from optic ow and body senses in a homing task. Perception, 31(3), 349 –374. Klatzky, R. L. (1999). Path completion after haptic exploration without vision: Implications for haptic spatial representations. Perception & Psychophysics, 61(2), 220 –235. Klatzky, R. L., Loomis, J. M., Beall, A. C., Chance, S. S., & Golledge, R. G. (1998). Spatial updating of self-position and orientation during real, imagined, and virtual locomotion. Psychol. Sci., 9(4), 293–298. Klatzky, R. L., Loomis, J. M., & Golledge, R. G. (1997). Encoding spatial reresentations through nonvisually guided locomotion: Test of human path integration. In D. Medin (Ed.), The psychology of learning and motivation (vol. 37, p. 41– 84). San Diego: Academic Press. Klatzky, R. L., Loomis, J. M., Golledge, R. G., Cicinelli, J. G., Pellegrino, J. W., & Fry, P. A. (1990). Acquisition of route and survey knowledge in the absence of vision. J. Mot. Behav., 22(1), 19 – 43. Loomis, J. M., Blascovich, J. J., & Beall, A. C. (1999). Immersive virtual environment technology as a basic research tool in psychology. Behav. Res. Methods Instr. Comput., 31(4), 557–564. Loomis, J. M., Klatzky, R. L., Golledge, R. G., Cicinelli, J. G., Pellegrino, J. W., & Fry, P. A. (1993). Nonvisual navigation by blind and sighted: assessment of path integration ability. J. Exp. Psychol. Gen., 122(1), 73–91. Loomis, J. M., Klatzky, R. L., Golledge, R. G., & Philbeck, J. W. (1999). Human navigation by path integration. In R. G. Golledge (Ed.), Waynding behavior: Cognitive mapping and other spatial processes (pp. 125–151). Baltimore: Johns Hopkins. Loomis, J. M., Klatzky, R. L., & Lederman, S. J. (1991). Sim-
Riecke et al.
ilarity of tactual and visual picture recognition with limited eld of view. Perception; 1991 20(2), 167–177. Marlinsky, V. V. (1999a). Vestibular and vestibulo-proprioceptive perception of motion in the horizontal plane in blindfolded man: II. Estimations of rotations about the earth-vertical axis. Neuroscience, 90(2), 395– 401. ———. (1999b). Vestibular and vestibulo-proprioceptive perception of motion in the horizontal plane in blindfolded man: III. Route inference. Neuroscience, 90(2), 403– 411. May, M., & Klatzky, R. L. (2000). Path integration while ignoring irrelevant movement. J. Exp. Psychol.-Learn. Mem. Cogn., 26(1), 169 –186. May, M., Pe´ruch, P., & Savoyant, A. (1995). Navigating in a virtual environment with map-acquired knowledge: Encoding and alignment effects. Ecol. Psychol., 7(1), 21–36. Mittelstaedt, M.-L., & Glasauer, S. (1991). Idiothetic navigation in gerbils and humans. Zool. Jb. Physiol., 95, 427– 435. Nelson, W. T., Hettinger, L. J., Cunningham, J. A., Brickman, B. J., Haas, M. W., & McKinley, R. L. (1998). Effects of localized auditory information on visual target detection performance using a helmet-mounted display. Human Factors, 40(3), 452– 460. Pe´ruch, P., & Gaunet, F. (1998). Virtual environments as a promising tool for investigating human spatial cognition. Cah. Psychol. Cogn.-Curr. Psychol. Cogn., 17(4 –5), 881– 899. Pe´ruch, P., May, M., & Wartenberg, F. (1997). Homing in virtual environments: Effects of eld of view and path layout. Perception, 26(3), 301–311. Poulton, E. C. (1979). Models for biases in judging sensory magnitude. Psychol. Bull., 86(4), 777– 803. Presson, C. C., & Montello, D. R. (1994). Updating after rotational and translational body movements: Coordinate structure of perspective space. Perception, 23(12), 1447– 1455. Riecke, B. E. (1998). Untersuchung des menschlichen Navigationsverhaltens anhand von Heimndeexperimenten in virtuellen Umgebungen. Unpublished master’s thesis, Eberhard-Karls-Universita¨t Tu¨bingen, Fakulta¨t fu ¨ r Physik. (Available online: http://www.kyb.tuebingen.mpg.de/bu/ people/bernie/diplomaThesis.pdf) Riecke, B. E., von der Heyde, M., & Bu¨lthoff, H. H. (2001). How real is virtual reality really? Comparing spatial updating using pointing tasks in real and virtual environments. Journal of Vision, 1(3), 321a. (Available online: http:// www.journalofvision.org/1/3/321/)
473
Rieser, J. J. (1989). Access to knowledge of spatial structure at novel points of observation. J. Exp. Psychol.-Learn. Mem. Cogn., 15(6), 1157–1165. Rieser, J. J., Hill, E. W., Talor, C. R., Bradeld, A., & Rosen., S. (1992). Visual experience, visual eld size, and the development of nonvisual sensitivity to the spatial structure of outdoor neighborhoods explored by walking. Journal of Experimental Psychology: General, 121(2), 210 –221. Ruddle, R. A., & Jones, D. M. (2001). Movement in cluttered virtual environments. Presence: Teleoperators and Virtual Environments, 10(5), 511–524. Ruddle, R. A., Payne, S. J., & Jones, D. M. (1997). Navigating buildings in ‘desk-top’ virtual environments: Experimental investigations using extended navigational experience. J. Exp. Psychol.-Appl., 3(2), 143–159. Sadalla, E. K., & Montello, D. R. (1989). Remembering changes in direction. Environ. Behav., 21(3), 346 –363. Sauve´, J. P. (1989). L’orientation spatiale: formalisation d’un mode`le de me´morisation e´gocentre´ e et expe´rimentation chez l’homme. Unpublished doctoral dissertation, Universite´ d’Aix-Marseille II. Sholl, M. J. (1989). The relation between horizontality and rod-and-frame and vestibular navigational performance. J. Exp. Psychol.-Learn. Mem. Cogn., 15(1), 110 –125. Stevens, S. S., & Greenbaum, H. B. (1966). Regression effect in psychophysical judgement. Percept. Psychophys., 1, 439 – 446. Stumpf, H., & Fay, E. (1983). Schlauchguren—Ein Test zur Beurteilung des ra¨umlichen Vorstellungsvermo¨gens. Go ¨ ttingen: Hogrefe. van Veen, H. A. H. C., Distler, H. K., Braun, S. J., & Bu ¨ lthoff, H. H. (1998). Navigating through a virtual city: Using virtual reality technology to study human action and perception. Future Generations Computer Systems, 14(3– 4), 231–242. Wang, R. X. F., & Simons, D. J. (1999). Active and passive scene recognition across views. Cognition, 70(2), 191–210. Warren, W. H., Kay, B. A., Zosh, W. D., Duchon, A. P., & Sahuc, S. (2001). Optic ow is used to control human walking. Nat. Neurosci., 4(2), 213–216. Wartenberg, F., May, M., & Pe´ruch, P. (1998). Spatial orientation in virtual environments: Background considerations and experiments. In C. Freska, C. Habel, & K. F. Wender (Eds.), Spatial cognition: an interdisciplinary approach to representing and processing spatial knowledge (vol. 1404, pp. 469 – 489). Berlin: Springer.