by the National Adult Reading Test and the Alice Heim 4. Test (standard tests ...... Taylor M, Creelman T. PEST: efficient estimate on probability function. J Acoust ...
Brain (1996), 119, 1277-1287
Visual information processing during controlled hypoglycaemia in humans R. J. McCrimmon,1 I. J. Deary,2 B. J. P. Huntly,1 K. J. MacLeod1 and B. M. Frier1 1
Royal Infirmary of Edinburgh National Health Sendee Trust, Edinburgh, and 2Department of Psychology, University of Edinburgh, UK
Correspondence to: Dr R. J. McCrimmon, Department of Diabetes, Royal Infirmary of Edinburgh NHS Trust, Lauriston Place, Edinburgh EH3 9YW, UK
Summary hypoglycaemia (P < 0.005). In contrast, no significant effect of hypoglycaemia was demonstrated on standard clinical measures of visual acuity or stereoscopic vision. Thus, although hypoglycaemia caused no detectable deterioration in visual acuity as measured by Snellen-type tests, a marked deterioration occurred in the speed of visual information processing and in contrast sensitivity. As many decisions are made under conditions of limited perceptual time and low visual contrast (e.g. when driving), the disruptive effect of moderate insulin-induced hypoglycaemia on visual perception will have important practical implications in diabetic humans exposed to this metabolic stress. The present results are congruent with other evidence which shows that the early stages of visual information processing are susceptible to deterioration by general cerebral insults.
Keywords: hypoglycaemia; cognition; visual perception; visual contrast sensitivity; visual acuity Abbreviations: IT = inspection time; LED = light-emitting diodes; VCD = visual change detection; VMD = visual movement detection
Introduction Cognitive effects of hypoglycaemia The human brain is almost entirely dependent on glucose as its energy source and, because of this, significant neuroglycopenia will cause an impairment of brain functioning in humans. This has been demonstrated and quantified in studies using a variety of neuropsychological (Holmes et al., 1983, 1984, 1986: Pramming et al., 1986; Heller et al., 1987; Hoffman et al., 1989; Stevens et al., 1989; Blackman et al., 1990; Widom and Simonson 1990; Mitrakou et al., 1991; Cox et al., 1993a; Gonder-Frederick et al., 1994; Mellman et al., 1994) and neurophysiological tests (Pramming et al., 1988; Tamburrano et al., 1988; Blackman et al., 1990; Jones et al., 1990; Talroth et al., 1990; Ziegler et al., 1991). Tasks which primarily involve higher cognitive processes are thought to be more sensitive © Oxford University Press 1996
to neuroglycopenia than motor tasks (Cox et al., 1993a). Moreover, tasks that involve rapid responses and those which are more cognitively complex and attention demanding tend to show substantial impairment during neuroglycopenia, whereas ability on simple motor and cognitive tasks such as finger-tapping, digit span and simple reaction times are relatively well preserved (Deary, 1993). The pattern of cognitive dysfunction that occurs during neuroglycopenia is of practical and theoretical interest but has remained largely uninvestigated. Most studies of cognitive dysfunction during acute insulin-induced hypoglycaemia have employed measures of general cognitive performance. A problem with this approach lies in our limited knowledge of the brain processes involved in most psychometric tests (Anastasi, 1988). The fundamental information processing
Downloaded from brain.oxfordjournals.org by guest on July 15, 2011
A general impairment of cognitive performance occurs during acute insulin-induced hypoglycaemia, but little objective evidence is available for disruption of more specific cognitive processes. The effect of controlled hypoglycaemia on the early stages of visual information processing and contrast sensitivity was examined in a homogeneous group of 20 nondiabetic human subjects. Hypoglycaemia caused a significant disruption in general cognitive performance as assessed by a digit symbol task (P < 0.001) and the trail making B task (P < 0.05). Hypoglycaemia also produced a highly significant deterioration in performance on all of the visual information processing tasks, namely inspection time (IT) (P = 0.01), visual change detection (VCD) (P < 0.005) and visual movement detection (VIVID) (P < 0.005). A significant deterioration in contrast sensitivity was observed during
1278
R. J. McCrimmon et al.
functions affected by hypoglycaemia therefore remain obscure because most standard tests cannot be reduced reliably to a specific set of psychological processes. In addition, it is not clear to what extent a significant disruption in general cognitive performance tests provides a useful index of abilities that are important in everyday cognitive functioning (Anastasi, 1988). Thus, very little detailed information is available on the effects of controlled hypoglycaemia upon specific information processing abilities.
Hypoglycaemia and vision
Inspection time (Vickers et al., 1972), and VCD and VMD (Philips, 1974), are psychophysical measures of the efficiency of the early stages of visual information processing for high-contrast stimuli. There is now a considerable body of research in which the early stages of visual information processing, involving the extraction of visual information from sensory stores and its passage to decision-making processes, has been examined. Deficits in such 'iconic' processing have been found in pre-senile Alzheimer's disease (Deary et al., 1991), multiple sclerosis (Kujala et al., 1994), alcoholism (Wilson et al., 1988), head injury (Mattson et al., 1994), following recovery from general anaesthetic (Chittleborough et al., 1992) and in major behavioural disorders such as schizophrenia and mania (Green et al., 1994). Mental processing speed can also be affected by various pharmacological agents such as scopolamine (Brandeis et al., 1992), anti-epileptics (Gillham et al., 1988), noradrenergics (Halliday et al., 1994), dopaminergics (Halliday et al., 1987) and anaesthetic agents (Chittleborough et al., 1992). Inspection time is known to deteriorate with age (Nettelbeck, 1987), and ability on the inspection time task correlates with psychometric intelligence (Nettelbeck, 1987), and perhaps more specifically with fluid-type intelligence tasks (Deary et al., 1991). This suggests that
Methods Subjects Twenty (18 male, two female) healthy, non-diabetic human subjects were studied. All subjects had a visual acuity (measured by a Snellen chart) of 6/6 or better. The mean age of the subjects was 26 years (range 23-30) and they had a mean body mass index of 23 kg m~2 (range 19-26). All of the subjects had above average intellectual ability as assessed by the National Adult Reading Test and the Alice Heim 4 Test (standard tests of general intellectual ability). None of the subjects had any previous medical history or a family history of diabetes, and none were taking any regular medication. Subjects were recruited by advertisement and were not paid for their participation in this study. Each subject was informed that they would be required to attend the department on three separate occasions. On two of these occasions they would undergo the experimental procedure during which they would either be kept at euglycaemia or rendered hypoglycaemic. Subjects were made aware that they would undergo both study conditions but would not be informed as to which condition was being performed on each study day. The study was approved by the local medical ethics advisory committee, and written consent was obtained from all subjects.
Experimental procedure The subjects were studied on three separate occasions, each at least 2 weeks apart. The initial visit was to familiarize the subjects with the tests that would be used during the experimental condition. During familiarization subjects completed all of the psychometric tests, the order and duration of which were the same as that of the experimental condition. Familiarization was used to help minimize any practice
Downloaded from brain.oxfordjournals.org by guest on July 15, 2011
Acute controlled hypoglycaemia does have an effect upon the eye with documented changes in intra-ocular pressure (Frier et al., 1987) and anterior chamber dimensions (Hepburn et al., 1993) but it is not known whether these physical changes translate into clinically relevant abnormalities of vision. Blurring of vision and diplopia are recognized features of acute hypoglycaemia (Hepburn, 1993). When symptom profiles reported during acute insulin-induced hypoglycaemia are analysed, blurring of vision clusters together with the neuroglycopenic symptoms of hypoglycaemia (Hepburn et al., 1991). Corrected visual acuity does not appear to deteriorate during insulin-induced hypoglycaemia (Harrad et al., 1985), nor is there evidence of a significant change in colour vision (Hardy et al., 1995). These results are inconclusive and afford data of limited practical relevance because real-world visual perception involves making decisions about transitory and low contrast stimuli. An important example of such a task is driving, and the deleterious effects of hypoglycaemia on driving ability have been found using a driving simulator (Cox et al., 1993/J).
mental processing speed is an important aspect of general mental ability, and also that it is sensitive to mild cognitive impairment. Contrast sensitivity provides a more subtle measure of speed-independent visual function (Di Leo et al., 1992) than standard acuity tasks, and is more relevant to everyday human visual perception. Contrast sensitivity provides a measure of the amount of contrast required to detect a visual target. Subclinical visual dysfunction is more likely to be detected by degrading the stimulus (visual target) intensity when this more demanding visual assessment is used (Di Leo et al., 1992). The aim of the present study was, therefore, to examine two important aspects of visual perception during controlled hypoglycaemia, namely speed of iconic processing and contrast sensitivity. Standard tests of general cognitive performance gave a measure of the degree of general cognitive disruption during hypoglycaemia. Simultaneous standard measurements of visual acuity were recorded.
Visual information processing and hypoglycaemia SQ 1
1279
TEST BATTERY CF VA IP
G BASELINE -'
CONTROL
' TEST BATTERY
EUGLYCAEMIA
-Study 1
TEST BATTERY
CONDITION HYPOGLYCAEMIA 5
10
50
20
60
Minutes
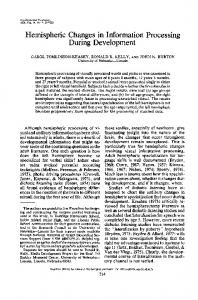
Fig. 1 This shows the study design. Each subject completed both Studies 1 and 2, which were arranged in a counterbalanced manner. I = insulin; G = glucose; SQ = hypoglycaemia symptom questionnaire, CF = tests of general cognitive function, VA = measures of visual acuity, IP = information processing tasks.
During each phase of the study (each baseline, euglycaemia and hypoglycaemia) the subjects underwent tests of (i) visual information processing, (ii) general cognitive function and (iii) visual acuity and contrast sensitivity, and a hypoglycaemia symptom questionnaire was administered (Fig. 1). During each study phase the blood glucose was stabilized for 10 min at the target glycaemic level before the assessment of information processing. The subjects underwent the experimental conditions in a counterbalanced fashion (i.e. half the subjects underwent hypoglycaemia first followed by the euglycaemic control condition, and half the reverse).
Symptom questionnaire A symptom questionnaire was completed by the subject at each phase [baseline(s), euglycaemia and hypoglycaemia] of the study. Hypoglycaemia symptoms were classified as autonomic (palpitations, sweating, shaking and hunger), neuroglycopenic (confusion, drowsiness, odd behaviour, speech difficulty and inco-ordination) or non-specific (nausea and headache) (Edinburgh Hypoglycaemia Scale; Deary etal., 1993a). Each symptom was graded on a scale of 1-7 (1 = not present; 7 = very intense). The total for each sub-group of hypoglycaemic symptoms was calculated.
Psychometric tests of general cognitive function Two tests of general cognitive performance, known to be affected by moderate hypoglycaemia (Hoffman et al., 1989; Stevens et al., 1989; Kerr et al., 1991; Deary 1993), were included in the test battery. Both the digit symbol task and the trail making test B have a closer relationship to 'fluid' than to 'crystallized' (vocabulary-oriented) cognitive ability. These tests were included to provide an indication of general brain functioning in our study group during controlled hypoglycaemia.
Downloaded from brain.oxfordjournals.org by guest on July 15, 2011
effects that might occur. The results from this session for each individual subject were discarded. In the two subsequent visits to the laboratory, subjects underwent a glucose clamp procedure as follows. Following a light breakfast at 07.000, subjects were asked to attend the department at midday, and a Teflon cannula was inserted into an antecubital vein in the non-dominant arm under local anaesthetic (lignocaine 1%). This was used to infuse human soluble insulin (Humulin S, Eli Lilly, Indianapolis, Ind., USA) and a variable infusion of 10% dextrose. A second cannula was inserted in a retrograde direction into a vein on the back of the hand. The cannulae were flushed regularly with heparinized 0.9% saline. The hand was placed in a heated Plexiglas box (60°C) to arterialize venous blood. A modified hyperinsulinaemic glucose clamp technique (De Fronzo et ai, 1979) was used to maintain the blood glucose at predetermined levels. Insulin was infused at a constant rate of 60 mil m~2 min~' using an IMED Gemini PCI pump; the rate of glucose infusion was adjusted according to the blood glucose concentration measured at the bed-side (Yellow Springs Instrument 2300 Stat, Yellow Springs, Ohio, USA). Glucose was infused using an IVAC Site Saver pump. Arterialized venous blood samples were initially obtained at 3 min intervals, then at 5 min intervals once a stable blood glucose concentration had been achieved. Each subject underwent two laboratory sessions (Fig. 1). On each occasion the arterialized whole blood glucose concentration was initially stabilized at 4.5 mmol I"1 (baseline phase) for 1 h. In one study session hypoglycaemia (2.5 mmol I"1) was then induced and maintained for 1 h and in the other the blood glucose concentration was maintained throughout at 4.5 mmol I"1 (euglycaemia). An interval of 20 min was interposed between baseline and the hypoglycaemic or euglycaemic phases to allow achievement of the new glycaemic level. Subjects were not informed of their blood glucose level at any time during the laboratory sessions.
1280
R. J. McCrimmon et al.
Digit symbol task. This is a performance sub-test of the Wechsler Adult Intelligence Scale Revised (Wechsler and Stone, 1981). Nine digits are represented by nine different symbols, and subjects are required to write down the appropriate symbol for each in a given array of numbers over a fixed time period. Trail making test B. This is a divided attention task from the Halsted-Reitan Neuropsychological Battery (Reitan and Davison, 1974). The subject has to connect correctly an alternating series of numbers (1-13) and letters (A-L) in their respective orders as quickly as possible.
Visual acuity, stereoscopic vision and contrast sensitivity tests Visual acuity was examined using a series of standard clinical tests. An assessment of static contrast sensitivity was also taken to provide evidence for any subtle changes in peripheral vision.
Stereoscopic vision. The ability of subjects to judge the relative distances of objects by means of binocular vision, was assessed using Stereo-test Circles (Stereo-Optical Company Limited, Chicago, 111., USA). Contrast sensitivity. Static contrast sensitivity was measured using the Cambridge Low Contrast Gratings (Clement Clarke International Ltd). In each item of this test the subject views two adjacent pages of a booklet positioned at a distance of 6 m, only one page of which contains horizontal lines (a grating). Each 'line' in the grating is composed of small black dots on a white background separated from each other by equal distances. Viewed from a distance the subjective impression is of grey lines with white spaces between them. The opposite page of the booklet has the same number of dots evenly dispersed (i.e. not as lines). Here the subjective impression, when viewed from 6 m, is of a blank page. The subject's task is to identify the page that contains the lines (the grating). The task is very difficult when the lines are composed of few, widely spaced black dots, where the impression is of very faint grey lines on the page. Therefore, by varying the number of dots, and the distance between them, a series of gratings are produced with different levels of contrast. The gratings have 11 levels of difficulty, all with the same spatial frequency of 4 cycles per degree. In this study, the subject was presented with a block of 50 presentations (10 trials of each of the five most difficult gratings; contrast was 0.37, 0.27, 0.19, 0.14
Visual information processing tests The test battery so far has involved an assessment of vision and of cognitive function according to standard clinical measures. The next section of our test battery provided a more detailed examination of visual information processing, the tests of which are described below.
Inspection time The visual inspection time test used in this study was a simple two-choice discrimination task. It is a measure of the speed of the early stages of visual information processing (Vickers et al., 1972). The object of the test is to determine the stimulus duration required by a subject in order to reach a given level of correct responding in a very simple discrimination task. In the IT task used here the subject is required to indicate which of two parallel vertical lines, of markedly different lengths, is the longer. During the test the experimenter varies the stimulus duration, with briefer durations being more difficult. Only the correctness of responses at different stimulus durations is examined. Response speed is not recorded and the subject is instructed and encouraged to respond at leisure to achieve maximum accuracy. The IT stimuli and backward masks have been described in detail by Deary et al. (1993/?). A mask is designed to prevent the further processing of information from a briefly presented stimulus. The stimulus presentation unit was a box which carried a 16X16 array of circular red light-emitting diodes (LEDs). This display area (61 mm2) was built up from four Siemens PD 1165 display modules, each of which had an 8X8 grid of LEDs of 0.11 inch diameter on 0.15 inch centres. All stimuli were created with these LEDs. The cue which preceded the IT stimulus, was an inverted U-shape; it was 16 mm across and 14 mm high and shared the same cross-bar as the IT stimulus. In the IT stimulus the long line (29 mm) and short line (14 mm) were joined at the top by a crossbar (16 mm). Thus the vertical lines were aligned at the top. The backward mask was formed by lines 40 mm long and 10 mm wide, i.e. the masking lines were wider and longer that the stimulus lines and completely covered them (Fig. 2). The stimulus presentation unit was controlled by a BBC computer which also collated the response data. Each subject carried out all the IT test sessions under the same lighting conditions and in the same room to ensure that stimulus contrast remained stable. A 300 ms warning cue was presented at the start of each trial. The IT stimulus was presented 1000 ms after onset of the cue for the appropriate duration (range 1—400 ms). The backward mask was presented
Downloaded from brain.oxfordjournals.org by guest on July 15, 2011
Visual acuity. Distance vision for each eye was assessed using a standard Snellen chart positioned 6 m from the subject. Visual near-point acuity (binocular) and reading acuity (monocular) were assessed using a Royal Air Force Metre (Clement Clarke International Ltd, Essex, UK).
and