Visual Interaction for Spatiotemporal Content using Zoom and Pan with Level-of-Detail Daeil Seo* University of Science and Technology
Byounghyun Yoo†
Heedong Ko‡
Korea Institute of Science and Technology
Korea Institute of Science and Technology
Index Terms: I.3.6 [Computer Graphics]: Methodology and techniques—Interaction Techniques; H.5.2 [Information Interfaces and Presentation]: User Interfaces—Graphical User Interfaces (GUI)
radial navigation for selecting spatiotemporal information of content. But content visualization using temporal information was not covered. VisGets [3] provides visual filters for construction of dynamic search queries that combine a temporal, spatial, and topical dimension to allow the exploration of datasets. Users are able to change their spatial range by zooming and panning the map. ScatterBlogs2 [4] is a task-tailored filter for the interactive visual monitoring and analyzing of geo-located microblog posts. ImgWordle [5] focuses on analyzing and visualizing images and text in microblogs using spatiotemporal data and keywords. Krueger [6] proposed a method that enriched the context filling of the user trajectory using data on the Web and showed a visual analysis of user movement behavior based on spatiotemporal criteria. Previous works have considered visualization contents to find meaningful information using spatiotemporal metadata, but they have lacked interaction and visualization to maintain the overall context.
1
3
ABSTRACT It is easy to get lost while browsing and navigating spatiotemporal content, and the problem is exacerbated by the exponential growth of geospatial data with mobile phones and tablets. In this paper, we propose a continuous method of transition visualization with zooming and panning interaction of the maps and timelines on touch-based devices that maintains the spatial and temporal context of spatiotemporal content. Keywords: Spatiotemporal content, level-of-detail, zoom and pan, immersive visual interaction.
INTRODUCTION
With the increase in mobile devices, the production of content that contains spatiotemporal metadata has also increased. Because the mobile-logged content in its original suffers from information overload, it is difficult to give users meaningful information. Hanqi [1] proposed interactive visual analytic methods for spatiotemporal content with a spatial or temporal perspective. These perspectives are tightly coupled and respectively represented. However, the existing systems that use spatiotemporal metadata with content are the limited in terms of interaction and visualization. Although mobile-logged content contains time-dependent spatial information, it is hard to browse content within the overall context. In order to provide spatiotemporal information without overlooking the context, respective content abstraction from the perspective of the overall spatial and temporal context in each level of detail (LOD) is required. This enables dynamic abstraction preventing the user from getting lost while browsing and navigating the spatiotemporal content. A continuous method of transition visualization is also required to understand the relation between previous and present selected content and perspectives. In this paper, we propose a visual interaction method for spatiotemporal content with zooming and panning of maps and timelines. We also discuss a continuous process of transition visualization for changing the focus of content by user selection. 2
RELATED WORK
Lee [2] proposed a zooming and panning interface in a multitouch environment, multiple linked time sliders and dynamic *
[email protected] [email protected] ‡
[email protected] †
SYSTEM OVERVIEW
3.1 Processing for Content with Level of Detail (LOD) Geo-referenced logged content requires processing to provide meaningful information to users. In this paper, we use the LOD concept from the field of traditional computer graphics to define the interest degree of a perspective for the content. We declare abstraction levels of spatial and temporal perspective and show the content based on these perspectives. To explain this process, we use photo collections created on a trip as an example of georeferenced logged content.
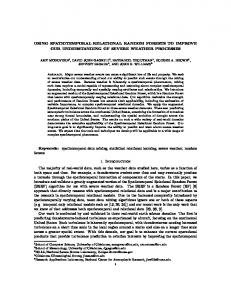
Figure 1: Data process for geospatial and temporal logged content. Content is organized with the event unit based on spatiotemporal metadata and abstracted events according to each perspective and levels with LOD.
Although geo-tagged photos contain information on the location with the latitude and the longitude, we use Foursquare service, one of the most famous location-based social networking services, to configure spatial LOD by obtaining the information about a Point of Interest (POI) that contains the position of a photo. Fig. 1 shows the data process for the configuration of LOD. We extract an event, at the lowest abstraction level, from geotagged photos by POI criteria that change according to time. Abstraction levels are created by each spatiotemporal criterion. An address structure of POI (including country, state, and city levels) is an example of a spatial LOD. An example of a temporal LOD is a time structure (including year, month, and day levels based on the Gregorian calendar). Because the upper-level is represented and aggregated with lower-level events, the upper level uses spatial boundaries encompassing the spatial extent of
lower-level events while their temporal intervals are shown in the timeline. 3.2 Interaction and Visualization for Content with LOD To maintain the overall context of the content and provide immersive visualization in this paper, we use the zooming user interface (ZUI) [7]. With this, users can change the scale of the viewed area, navigate content to see more or less detail within 2.5D or parallax 3D space, and pan to change focus on the content. Fig. 2 is an example implementation using iPad in the Web environment that shows a visualization of geo-tagged photos based on user selection of spatial and temporal LOD. Users are able to express their intentions through touch interaction. As example has two types of perspectives, spatial and temporal, the user uses the scale and boundary of the map for the spatial perspective and changes the scale and interval of the timeline for the temporal perspective. The primary perspective determines the visualization level of the content with LOD given in Fig. 1. The content is represented by the marker on the map and recode in the timeline based on LOD criteria such as spatial or temporal abstraction levels. The content visualization on the map and the timeline at the POI level of Fig. 1, which is the first abstraction level of spatial LOD, is depicted in Fig. 2(a). Fig. 2(b) shows the day level of Fig. 1, which is the first abstraction level of temporal LOD. There are three interaction types in the map and timeline interface: changing the LOD level in each perspective, diving into detailed content, and altering the primary perspective. Transitional visualization is used to zoom in, zoom out, and pan by LOD level relation between the previous and present LOD level selection. Double tapping a marker on the map or a recode in the timeline changes LOD level selection. For instance, zooming in on the animation to transition from the current level to the lower level leads to the LOD level transition from Fig. 2(a) to Fig. 2(c), and the markers are scattered to lower-level markers in the spatial perspective. If a user taps on the marker or recode, thumbnails of photos in this marker or recode are shown, as in Fig. 2(e). If the user double taps on the map with no marker or the timeline with no recode, the visualization level is changed to the level that is one step higher while zooming out to Fig. 2(a) from Fig. 2(c), and the markers are assembled to the location of the higher-level marker. In order to access detailed content, the user needs to tap the thumbnail of the content shown by tapping on a marker or a recode. The scale of the thumbnail is expanded to provide more detail while zooming in for the transition from Fig. 2(e) to Fig. 2(f). If the user taps on a thumbnail, the tapped thumbnail is further expanded to a single photo, as shown in Fig. 2(d) from Fig. 2(f). The reverse process scales the thumbnail down to provide less content, as depicted in Fig. 2. We use a toggle interface to alter the primary perspective between spatial and temporal LOD. For instance, if the perspective is changed from spatial (as in Fig. 2(a)) to temporal (as in Fig. 2(b)), the criteria for visualizing content changes from
the scale and boundary of a map to the scale and interval of a timeline. After that, the temporal LOD level must be determined. To keep the overall context as similar as possible during the transition of perspective, the relation between the markers must be mapped on the spatial perspective and the time information of the marker must be recode on the temporal perspective. If the time interval of the marker belongs to multiple recodes, the marker moves to scatter the animation for a smooth transition without getting lost in between different perspectives. If the recode on the timeline is covered with multiple time intervals of the markers, the markers move with the animation to assemble to the markers of temporal LOD. 4
CONCLUSION
In this paper, we proposed a continuous method of transition visualization with zooming and panning interaction of maps and timelines. Our method was useful for exploring content based on spatiotemporal perspectives and levels while maintaining the overall context of the contents. For future work, we plan to evaluate the proposed method using a various types of geospatial and temporal content. ACKNOWLEDGEMENTS This research is supported in part by Ministry of Culture, Sports and Tourism (MCST) and Korea Creative Content Agency (KOCCA) in the Culture Technology (CT) Research & Development Program 2014 and by the Korea Institute of Science and Technology (KIST) Institutional Program (Project No. 2E24790). REFERENCES [1] G. Hanqi, et al., “Tripvista: Triple Perspective Visual Trajectory Analytics and Its Application on Microscopic Traffic Data at a Road Intersection,” In IEEE Conf. Pacific Visualization Symposium (PacificVis), pp. 163-170, 2011. [2] C. Lee, et al., “Navigating Spatio-Temporal Data with Temporal Zoom and Pan in a Multi-Touch Environment,” Int. J. Geogr. Inf. Sci., 28(5):1128-1148, 2013. [3] M. Dörk, et al., “Visgets: Coordinated Visualizations for Web-Based Information Exploration and Discovery,” IEEE Trans. Vis. Comput. Graph., 14(6):1205-1212, 2008. [4] H. Bosc, et al., “Scatterblogs2: Real-Time Monitoring of Microblog Messages through User-Guided Filtering,” IEEE Trans. Vis. Comput. Graph., 19(12):2022-2031, 2013. [5] C. Kuang, et al., “Imgwordle: Image and Text Visualization for Events in Microblogging Services,” In Proc. International Working Conference on Advanced Visual Interfaces (AVI), pp. 371-372, 2014. [6] R. Krueger, et al., “Visual Analysis of Movement Behavior Using Web Data for Context Enrichment,” In IEEE Conf. Pacific Visualization Symposium (PacificVis), pp. 1-8, 2014. [7] B.B. Bederson and J.D. Hollan, “Pad++: A Zooming Graphical Interface for Exploring Alternate Interface Physics,” In Proc. ACM Symposium on User Interface Software and Technology (UIST), pp. 17-26, 1994.
Figure 2: Continuous method of transition visualization with zooming and panning animation: (a) spatial POI level, (b) temporal day level, (c) spatial event level, (d) photo selection, (e) event selection, and (f) thumbnails in the selected event.