VISUAL NAVIGATION OF COMPLEX INFORMATION SPACES Sarah M. North, Max M. North, and Nazir A. Warsi Human-Computer Interaction Group & Virtual Display Systems Laboratory Computer and Information Science Department Clark Atlanta University, Atlanta GA, 30314 E-Mail:
[email protected],
[email protected],
[email protected]
ABSTRACT The authors lay the foundation for the introduction of visual navigation aid to assist computer users in direct manipulation of the complex information spaces. By exploring present research on scientific data visualisation and creating a case for improved information visualisation tools, they introduce the design of an improved information visualisation interface utilizing dynamic slider, called Visual-X, incorporating icons with bindable attributes (glyphs). Exploring the improvement that these data visualisations, make to a computing environment, the authors conduct an experiment to compare the performance of subjects who use traditional interfaces and Visual-X. Methodology is presented and conclusions reveal that the use of Visual-X appears to be a promising approach in providing users with a navigation tool that does not overload their cognitive processes. INTRODUCTION Data visualisation has received a great deal of attention recently, and the need for better information visualisation tools is widely recognized (Beard & Walker 1991, Chimera 1992, Mclnlay et al 1991, North & North 1993, North et al 1994, North & North 1993b). One of the main reasons for better information visualisation tools is the characteristic of the human cognitive process (Gardiner & Hitch 1987, Johnson 1992). Specifically, humans have difficulty recognizing specified objects among many homogenous objects even with the aid of semantic attributes (e.g., a directory listing just by words) (Byrne 1993, North et al 1994, North & North 1993b). Consequently, icons are commonly used to facilitate the information visualisation and assist users referencing, locating, and selecting objects. Although the graphical user interfaces (GUIs) extensively use icons to represent objects such as files and directories, there exists little systematic empirical research to support the foundation of the interaction process between humans and icons (Byrne 1993, North et al 1994). Furthermore, there exists almost no empirical data or guidelines to assist interface designers in the graphical presentation of object's attributes (e.g., in file directory, size of file, generation time) (North et al 1994, North & North 1993b). Theoretically, factors such as size, color, form, etc. seem to be useful in locating objects; they are not commonly used in most computer displays or generally are ignored (Byrne 1993, Chimera 1992). In some instances, unfortunately, user interface designers have exaggerated the hypothetical guidelines of icon usage and employed complex icons that seem to overwhelm users. Byrne (1993) reports, "In general, simple icons (those discriminable based on a few features) seem to help users, while complex icons are no better than simple rectangles." Surprisingly, several other researchers have shown that most of the visual factors have little or no effect on users's ability to locate objects. Jones, et al have expressed concern regarding the difficulty many computer users experience in locating objects (documents) through "spatial filing". Moreover, Byrne (1993) reports that pictorial icons do not effect the users' efficiency in locating objects (documents). Consequently, it appears that there exists no unified theories about underlying interaction between human and icons. A systematic investigation of all the proceeding factors and theories is needed in order to develop guidelines for assisting users in the creation of more effective and efficient mental model of objects and object searching. NEED FOR INFORMATION VISUALISATION TOOLS Modern resource discovery systems, and even more so those of the future, will need visual displays (including icons and text) that will effectively and efficiently convey directory structure, organization, and contents. These systems (WAIS (Kahle & Medlar 1991), Gopher (McCahill 1992), WWW (Berners-Lee 1992), etc., and their interfaces) often construct "virtual directories" (Berners-Lee 1992) in the user's work space that may contain subdirectories and files from distant servers. Thus the user may have little knowledge of the directories's contents other than they are the result of particular keyword or textual searches. If we add the fact that future searches will be much more extensive, involve many more servers, and glean many more files, the need for information visualisation tools that convey this information becomes paramount. The expansion in the types of data is an important instance where information visualisation tools will be needed. Whereas now resource discovery searches yield mostly text files, in the future they will also yield image files in
46
AJIS
various formats (e.g., postscript, TIFF, SGI RGB, etc.), executables, animation sequences, program source codes, make or build files, more complicated file structures such as hypertexts containing multimedia components, and results from observations, experiments, or computer simulations. The observation results from the Earth Observing System provide a useful case in point. By the end of the decade, this system of satellites will be pouring observations about the earth's atmosphere, climate, ocean currents, pollutants, and their interrelationship into archives at the rate of one trillion bytes per day. NASA will make this data, and correlated data such as the results of comparative computer simulations, available to researchers world-wide. The advent of the federal initiative in high performance computing and networking and several government-backed "grand challenge" investigations in the sciences and engineering mean that there will be the infrastructure (e.g., distributed databases and servers), the delivery system (e.g., ubiquitous high bandwidth networks) and the uses (e.g., by researchers who must retrieve and compare massive amounts of data from many sources) requiring information visualisation tools in many different fields. CONCEPTUAL FRAMEWORK AND DESIGN This research project supports the following theories reported by Gardiner and Hitch (1987) concerning the human cognitive processes, specifically the Short Term Memory (STM) and Long Term Memory (LTM) characteristics. STM is a memory buffer with an extremely low capacity (7±2 units) and only moderate trace duration (a matter of seconds). Gardiner and Hitch (1987) postulate that the characteristics of human STM and LTM as follows: (i) Letters or words that rhyme are particularly difficult to differentiate in STM (directory file names that rhyme visually such as xy.012, xy.015, etc.). (ii) Small, manageable amounts of information will be lost from STM in a matter of seconds if that interval is filled with distracting information or activity, (iii) STM recall of item names is usually better when names are presented as pictures (visual), rather than words (semantic), (iv) The probability of retrieval of information from LTM increases as a function of the match between the cues and context present at the time of storage and the cues and context available at the time of recall, (v) The greater the compatibility between the operations carried out to store information and the operations carried out to retrieve it, the greater the probability of successful recall, (vi) The more distinct and unique the information stored in LTM, the greater the probability that it will be successfully recalled. Cha and Wiederhold [4] independently agree with Gardiner and Hitch,"... the knowledge in human long-term memory is imprecise, incomplete, and often incorrect." By adhering to the proceeding postulates, Visual-X enables users to visualize and browse through different attributes of an object using low cognitive load. The Visual-X is a collaborative tool that will extract some of the attributes of objects automatically while allowing the user to fill in additional attributes. Some of the important features of Visual-X are: (i) It enables the user to see in one view different attributes of the object (North et al 1994, North & North 1993b), (ii) It provides low cognitive load for the user, (iii) It assists the user in extracting meaning about objects, and (iv) It provides a global view of the distribution of attributes of the object (Johnson 1992). The design of Visual-X is based on the concept of direct manipulation (Schneiderman 1993). The direct manipulation is achieved by utilizing a novel widget called dynamic slider (North & North 1993, North et al 1994) and other widgets. The direct manipulation and dynamic slider are briefly described below: Direct Manipulation Basic Philosophy The distinguishing feature of direct manipulation interfaces is that their structures corresponds to the structure of the domain. Direct manipulation allows the user to observe the results while directly manipulating the domain structure. Shneiderman reports a direct correlation between objects presentation and innate human capabilities. Shneiderman (1986) writes: "Dealing with representations of objects may be more "natural" and closer to innate human capabilities: action and visual skills emerged well before language in human evolution. Psychologists have long known that spatial relationships and actions are grasped more quickly with visual rather than linguistic representations. Furthermore, intuition and discovery are often promoted by suitable visual representations of formal mathematical systems." The direct manipulation architecture provides the following: (i) continuous graphical representation of information, and information exploration outcome; (ii) visible range of the object by utilizing dynamic sliders and other widgets (Shneiderman 1993); and (iii) immediate feedback as the user physically manipulates the sliders, selection buttons, etc.
September 1995
47
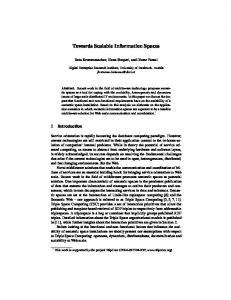
Dynamic Slider as a Novel Multiattributes Widget Traditionally, sliders have been used as a metaphor to assist the user in entering either a single value or a single range value anchored to minimum or maximum points of a field. A dynamic slider is a slider with two drag boxes which represent dynamic range(s) rather than a single or anchored value to provide the mechanism for assisting user in direct manipulation of the complex information spaces. The detailed description of the dynamic slider can be find in the article by North and North (1993) and North, et al (1994). DESIGN APPROACH We have extended this work in a unique way by adding techniques that have proved quite successful in scientific and engineering data visualisation. The idea is to generalize the usual iconographic display in, for example, a directory window. The generalized icons would have attributes that are bound by the user to data variables causing a mapping of that variable onto changes in the iconic attribute. Thus in this view, the icons would have attributes that in this case are bound to file size. The essential point here is that the object attributes need not be bound only to file size (or any single property); at the user's discretion it could be bound to another property such as the number of times a keyword appears in the file's text. Icons with bindable attributes are commonly called "glyphs". Glyphs are 2- or 3-D graphical objects whose elements (e.g., position, size, shape, color, orientation, intensity, etc.) are bound to data. They have proven quite useful in depicting spatially complex, multivariate data such as is found in current calculations and experiments. As we have pointed out, the size, complexity, and number of variables in this type of data will only increase in the future. Glyphs have been effective in depicting macromolecular structure and interactions, variables such as wind speed and direction in atmospheric dynamics simulations and observations (Treinish 1993), complex 3-D structure and several variables simultaneously from molecular dynamics simulations (Ribarsky et al), plastic flow in injection molding processes (Elson & Cox 1988), and many other types of data. Based on ideas originally presented by Foley & McMath (1986), Ribarsky and colleagues have recently extended the power and scope of the glyph concept by developing tools to allow the user to make and change bindings of glyph attributes to sets of related data variables (Ribarsky et al 1993, Ribarsky et al). This approach implies that we have a set of data objects and separately have a set of graphical objects, and we can delay decisions about how they are interactively joined together until those decisions need to be made-as the data is being viewed and explored. This is the most flexible way to create data visualisations. Ribarsky and colleagues have made an easy-to-use, programmerless environment, called Glyphmaker, (Ribarsky et al 1993) that allows the creation of glyphs and their subsequent binding to data variables by direct manipulation. VISUAL-X CAPABILITIES AND CHARACTERISTICS Visual-X enables users to visualize and browse different attributes of objects using low cognitive load. VisualX is a collaborative tool that extracts some of the attributes of objects automatically while allowing the user to fill in additional attributes. Some of the important features of Visual-X: (i) enable the user to see in one view different attributes of the objects, (ii) provide low cognitive load for the user, (iii) assist the user in extracting meaning about objects, and (iv) provide a global view of the distribution of attributes of the objects (Johnson 1992). Specifically, Visual-X interface possesses the following capabilities and characteristics: (i) objects and graphical widgets of interest are continuously visible to the user (Schneiderman 1993); (ii) the outcome of the information exploration is produced by physical actions such as manipulation of the dynamic sliders and other widgets; (iii) the provision for incremental, rapid, and reversible actions that will be immediately displayed for users; and (iv) a minimal learning curve to aid naive as well as expert users in the exploration of information. In essence, Visual-X interface enables the users to visualize and explore information similar to human cognitive information processing using minimal cognitive load. In addition, Visual-X interface enables the user to see in one view objects, actions, and results, and Visual-X interface assists the user in extracting the meaning and relationship of objects (Sarkar & Brown 1992). Visual-X Interface at Work (An Application) In many instances, users list the directory contents of a computer system and cannot recognize or extract meaningful information by looking at the file names (using Unix Is command). Consider a Unix directory listing using Visual-X tool (Figure 1).
48
AJIS
Visual-X does not only depicts file name, creation time, and size. It also provides other attributes such as volume of modification, last date of modification, frequency of use, number of key words appearing in the file, etc. Each of these attributes are presented with the dynamic slider. The user can select any range of the attributes by just manipulating the dynamic slider. For example, file size between 10K and 100K bytes may be chosen. Each attribute also corresponds with a series of visualisation primitives. Visualisation primitives assign the attributes of the object (icon) in the view window. For simplicity, we have used only four visualisation primitives for our prototype. However, these visualisation primitives could be extended or rearranged as the user desired. The visualisation primitive of Visual-X prototype is size, color, intensity, and depth. The user can select one of these primitives by clicking and binding it to object attributes. For example, the intensity primitive is binded with creation time. Attributes may be classified as primary or secondary. Two primary attributes are allowed in our prototype to represent the x and y axis of the view windows. For example, "size of file" and "frequency of use" are selected as primary attributes. The user may bind different attributes to different visualisation primitives with the limitation of the two primary bounding. This selection allows users to customize the icons in the view window In turn, users can explore the objects attributes and visually extract meaning about the objects and their relationship to each other. THE EXPERIMENT This experiment compared Visual-X interface with traditional interface (i.e., Unix interface). The major hypotheses was that there would be a significant difference between the performance of subjects who use Visual-X interface and the subjects who use the traditional unix interface. The independent variables in this experiment were the interfaces that subjects utilized for referencing, locating, and selecting objects: (i) VisualX interface; and (ii) traditional Unix interface. The dependent variables were: (i) time to reference, locate, and select an object or group of objects; and (ii) usefulness, effectiveness, learnability, and attitudes. The prior data collected from the users revealed that users' skills vary from novice to expert with expert users dominating the population. The research subjects were forty individuals (n=40) who were randomly selected for this project. Twenty subjects were placed in the experimental group and twenty subjects were placed in the control group. A typical subject was 19-24 year-old (64%), and female (82%). Initially, a prototype Visual-X interface was designed, developed, tested, and implemented on a personal computer. Each group was given an overview of experimental procedures and a short instructional period, primary to acquaint users with the interfaces. The subjects from the experimental and control groups were presented with twenty different information exploration tasks to perform on Visual-X interface. Each subject was timed and recorded for the successful performance of each task. The following ia a partial listing of information exploration tasks: • Locate files created after October 1993; and the frequency of file use exceeded ten; and volume of modification is greater than 1000 bytes. • Locate text files (.txt) with the file size is between 10K and 20K bytes. • Locate files with five to eight keywords; and the last modification to the file was made after December 1992; and the file size is between 20K and 30K bytes. PRELIMINARY RESULTS The data were subjected to appropriate statistical procedures. These procedures included a measure of central tendency and the t-test. Control Group
Experimental Group (Visual-X)
n Mean S.D.
20 169.35 51.27
t 20 92.85 37.68
df 5.37
38
Table 1. Means, Variance, Standard Deviations, Degree of Freedom, and t-test of subjects in experimental and control groups.
September 1995
49
I
2
3
4
5
6
7
8
9
10
II
12
Figure 1. A Unix directory listing using Visual-X tool. The result of the t-test indicated that there exists a significant difference between the performance of the experimental group and the control group (t=5.37, df=38, p