Visual ontology alignment for knowledge sharing and reuse Monika Lanzenberger, Jennifer J. Sampson, Markus Rester, Yannick Naudet and Thibaud Latour
Abstract Purpose – By providing interoperability users can be supported in sharing and reusing vocabularies and knowledge. Ontology alignment plays an important role in the context of semantic interoperability. Usually ontology alignment tools generate results that are difficult to understand or assess. In order to enable users to check and improve alignment results and to understand their consequences information visualization techniques are used. The purpose of this paper is to discuss the relevant quality aspects in ontology alignment as well as current activities and available tools. Design/methodology/approach – Based on a literature study quality measures for ontology alignment identified and requirements for visual ontology alignment are defined. As a proof of concepts a prototype called AlViz was developed. Findings – Information visualization offers appropriate methods for the assessment of ontology alignment results. Different levels of detail and overview help users to navigate and understand the alignments. The assessment of semi-structured resources by users involves learning activities. The neighborhood of the entity under investigation bears relevant semantic information. Therefore, assessment may include crisscrossing acquisition of knowledge representations and their semantics. Originality/value – Along a comprehensive framework alignment assessment tasks are identified and visualization tool is introduced and applied which aims at making ontology alignment results manageable and comprehensible.
Monika Lanzenberger is based at the Institute of Software Technology and Interactive Systems, Vienna University of Technology, Vienna, Austria. Jennifer J. Sampson is based at the Department of Computer and Information Science, Norwegian University of Science and Technology, Trondheim, Norway. Markus Rester is based at the Institute of Design and Assessment of Technology, Vienna University of Technology, Vienna, Austria. Yannick Naudet and Thibaud Latour are both based at the Public Research Centre Henri Tudor, Centre for IT Innovation, Luxembourg-Kirchberg, Luxembourg.
PAGE 102
j
Keywords Knowledge sharing, Knowledge management, Audiovisual aids Paper type Research paper
1. Introduction Interoperability is a key issue in knowledge management, making distributed and heterogeneous knowledge resources accessible. By providing interoperability we can support users in sharing and reusing vocabularies and knowledge. In order to enable knowledge systems to operate in conjunction we need to establish relations and agreement for a variety of features. The use of standardized formats and well-defined syntax offers technical interoperability. The Semantic Web initiative (Berners-Lee, 1998; Herman, 2007), which aims at building a ‘‘machine-understandable’’ and metadata-enriched worldwide web, yielded standards like RDF(S) and OWL (W3C, 2004). These standards of the World Wide Web Consortium (W3C) constitute a firm basis for developing shared vocabularies such as ontologies. An ontology provides an explicit specification of a conceptualization (Gruber, 1993) and describes domain knowledge in terms of its concepts, relations, and instances. We refer to an ontology as a tuple O :¼ ðC; HC ; RC ; HR ; I; RI ; AÞ (Ehrig and Sure, 2004). Concepts C, which are classes of real-world objects, are organized in a subsumption hierarchy HC. Relations RC exist between pairs of concepts and may also be arranged in a hierarchy HR. The instances I of specific concepts, are interconnected through relational instances RI. A represents the axioms which are used for inferring knowledge about the domain.
JOURNAL OF KNOWLEDGE MANAGEMENT
j
VOL. 12 NO. 6 2008, pp. 102-120, Q Emerald Group Publishing Limited, ISSN 1367-3270
DOI 10.1108/13673270810913658
‘‘ Tools cannot solve the complicated task of understanding semantics or interpreting knowledge resources, they can just help with the preparation by identifying entities or information chunks which probably share relevant features in common. ’’
The exploration of ontologies could be an efficient and powerful way for organizations or communities of practice to share knowledge. Semantic interoperability is required in order to represent domain knowledge in a generic way and provide a consensual understanding of that domain. With an increase in the development of ontologies by different communities comes the need for tools and techniques for solving heterogeneity problems between different ontologies. Before we can combine two or more ontologies we need to analyze the relationships among entities. When we identify equal or similar concepts within the different ontologies, semantic relations between these knowledge resources are established which allow for tool-supported exploitation. In particular, the work we present is about the assessment of ontology alignment, which is essential for semantic interoperability among different data repositories and knowledge resources. Algorithms and tools can help the users in identifying overlapping vocabularies or related terms. However, tools cannot solve the complicated task of understanding semantics or interpreting knowledge resources, they just can help with the preparation by identifying entities or information chunks which probably share relevant features in common. For example, we can apply heuristic rules to do this kind of preparatory work. In establishing alignment among knowledge resources this is just one step and yields intermediate results, i.e. semi-structured vocabularies and knowledge resources. The assessment of such semi-structured resources by the users involves learning activities. The neighborhood of the entity under investigation bears relevant semantic information. Therefore, assessment may include crisscrossing acquisition of the explicit knowledge representations and their semantics. Although ontologies primary convey specific types of knowledge (i.e. declarative, structural, and conceptual knowledge), other types of knowledge influence the ontology engineers’ decisions as well. According to Jonassen (2006) we distinguish three different types of knowledge, i.e. ontological, epistemological, and phenomenological representations of knowledge. While ontologies seem to reflect the first type only, users bring in their experience and specific background.
This work is partially supported by the Norwegian Research Foundation in the Framework of Information and Communication Technology (IKT-2010) program - the ADIS project. Part of this work was done while M. Lanzenberger was an ERCIM research fellow at IDI, Norwegian University of Science and Technology (Trondheim, Norway) and CITI, Centre de Recherche Public Henri Tudor (Luxembourg).
Reuse and sharing of knowledge resources can benefit from the integration with large terminological bases. A successful case study employing this approach is discussed in Sicilia et al. (2006). The use of meta-ontology and common vocabulary is one option to establish interoperability. However, there is still a need for the alignment of heterogeneous knowledge resources because sometimes large-scale integration is not appropriate because it can be an extensive task. Moreover, one aspect of knowledge domains and their respective human communities is their resistance against semantic standardization of content and the propagation of individual representations of terms, ideas, and approaches. So, we need to handle the existence of different vocabularies sometimes even within the same knowledge domain. According to Sheth et al. (2005), we can interpret a knowledge resource as a map, which is partitioned by using different criteria or features. This may yield locally consistent knowledge, but global consistency is sometimes not possible. Ontology alignment can support the users in ensuring local consistency while optimizing global consistency. In the next section we give an introduction to ontology alignment. Thereafter, in section 3 we describe an alignment visualization plug-in called AlViz and its benefit for the evaluation and
j
j
VOL. 12 NO. 6 2008 JOURNAL OF KNOWLEDGE MANAGEMENT PAGE 103
refinement of ontology alignment. In order to investigate the quality of alignments, we apply a specific framework providing us with a comprehensive approach for the assessment of ontology alignments. Some quality aspects are supported by the use of information visualization tools. In section 4 we list the quality aspects of the framework, followed by perception issues in information visualization, and completed with a small practical example in alignment assessment. In section 5 we report on related work. Finally, in section 6 we present conclusions about visual ontology alignment anticipated as one important topic among others in the field of knowledge management and integration.
2. Ontology alignment There is a lot of ongoing research about the development of ontology mapping algorithms to automatically bring two or more ontologies into alignment. A survey of the state of the art in ontology alignment tools is presented in Sampson and Lanzenberger (2006). We define ontology alignment as given two ontologies O1 and O2, each describing a set of discrete entities: concepts (C), relations (R), and instances (I) are examined in order to find the alignment relationships that hold between these entities. If an alignment associates a concept x in ontology O1 to a concept y in ontology O2, then x and y are either equal, syntactically equal, similar, or x may be broader-than or narrower-than y. There could be many concepts in O1 or O2 that have no equivalents, nor related terms in the other ontology, so they are characterized as being different from any other entities. After studying the existing ontology mapping tools, we decided to use Foam (Ehrig, 2007) to generate the associations. Foam is open source and produces reliable mapping results. Moreover, adaptation of the tool for our research purposes was possible. The Foam algorithm uses a large number of rules for calculating similarity between entities. Out of a possible 100 rules, we selected the 23 most significant rules for indicating similarity in terms of specific association categories. This reduced number of rules yields appropriate mapping results within a reasonable time and the similarity calculation is done more efficiently than by considering all rules. The reader may refer to Ehrig et al. (2005) for a comprehensive description of the all similarity rules applied in Foam. The similarity function of Foam combines different features of the ontologies with appropriate similarity measures. As well as testing for equality, different similarity measures are used to calculate how similar entities in two ontologies can be qualified. Based on the 23 selected rules, we define six categories of similarity representing the associations between entities of two ontologies. Tables I and II list these association categories and the assigned rules for concepts, instances, data and object properties. Table I Comparison relations among concepts and among instances in ontologies OWL ontology construct
Comparison relationship
Description
Concept
Equal
URIs equal Class member instances equal Labels are the same Superclasses are the same Subclasses are the same Data properties are the same Object properties are the same Similar low/high fraction of instances Subclass superclass comparison Superclass subclass comparison Class is different from all classes of the second ontology URIs equal Labels are the same Instances of the same concept Property members are the same Two instances linked via the same property to another instance Instance is different from all instances of the second ontology
Syntactically equal Similar
Instances
Broader than Narrower than Different Equal Syntactically equal Similar
Different
j
j
PAGE 104 JOURNAL OF KNOWLEDGE MANAGEMENT VOL. 12 NO. 6 2008
Table II Comparison relations among properties in ontologies OWL ontology construct
Comparison relationship
Description
Data properties
Equal Syntactically equal Similar
URIs equal Labels are the same Data property domains are the same Data super properties are the same Data sub properties are the same Data properties members are the same Data property is different from all data properties of the second ontology URIs equal Labels are the same Object property domains are the same Object super properties are the same Object sub properties are the same Object properties members are the same Object property is different from all object properties of the second ontology
Different Object properties
Equal Syntactically equal Similar
Different
Obviously, the identification of equal or syntactically equal entities is simpler than determining the weaker association of being similar. We can identify equal entities by equal URIs of their concepts or instances (also called individuals). Based on the edit distance, which counts the number of character changes required when transforming one label to the other label, syntactically equal labels are estimated. Often, identical labels indicate a high chance for a close relationship between two entities. Minor diversity – such as plural and single forms – between labels is identified as syntactic equality with a rather strong confidence value. If no equal URIs and no closely related labels are found, the ‘‘neighborhood’’ is explored for similarities by using the rules of the third association category. If the surrounding entities of both ontologies have features in common then the entity itself may be similar as well. In general, the tool uses a threshold applied to the confidence value in order to find out the relevant alignments. For example, we used a threshold of 0.45, which enabled us to find not only equal or syntactically equal entities, but similar entities as well. A higher threshold would remove such alignments. A lower threshold would take the narrower-than and the broader-than associations into account extensively. Such mapping algorithms generate a list of associated entities shared among the source ontologies. However, mismatches or undetected similarities, caused either by different symbols representing the same concepts or by the same symbols representing different concepts, limit the quality of the mapping results. Moreover, before two ontologies O1 and O2 can be aligned, it may be necessary to manually introduce new subtypes or supertypes of concepts or relations in either O1 or O2 in order to provide suitable targets for alignment. So in contrast to mapping only, ontology alignment may include changes to the source ontologies and requires humans’ decisions and interaction.
3. Visualization for alignment evaluation Visual metaphors encode large, multi-dimensional data sets effectively and support human interpretation and understanding. Information visualization (InfoVis) uses such visual metaphors in order to communicate the relevant information in an intuitive way and to foster new insights into the underlying processes (Tufte, 2001) and patterns. InfoVis aims at making complex data accessible for interactive investigation by the user. Graphical primitives such as point, line, area, or volume are utilized to encode information. These objects are characterized by position in space, size, connections and enclosures, shape, orientation, and visual cues like color and texture, with temporal changes, and viewpoint transformations (Card et al., 1999). We developed a prototype for visual ontology alignment called AlViz (Lanzenberger and Sampson, 2006). It is implemented as a multiple-view plug-in for Prote´ge´-OWL (Stanford Medical Informatics, 2007) in order to visually support alignment of two ontologies by
j
j
VOL. 12 NO. 6 2008 JOURNAL OF KNOWLEDGE MANAGEMENT PAGE 105
making the type of similarity between entities explicit. The tool consists of different views coupled by the linking and brushing technique. J-Trees are one type of the views applied in AlViz. Such trees consist of a root node, expanded or collapsed branch nodes and leaf nodes displaying the hierarchical structure by indentation. They support the access and manipulation of instances and single items within classes quite effectively and are well established within the Prote´ge´ community. However, J-Trees have several shortcomings regarding the representation of large or complex ontologies because they become cluttered and do not provide adequate overview functionality. To overcome this problem we integrate another visualization type: small world graphs (Van Ham and Van Wijk, 2004). In a second view, such graphs help the user to examine the structure of the ontology more intuitively. This method uses clusters to group the nodes of a graph showing a specific level of detail. The nodes represent the entities (concepts or instances) connected to each other according to the selected relations, also called mutual or object properties, such as IsA, IsPart, IsMember, locatedIn, IsDistinct. So, both source ontologies are visualized as clustered graphs, where the edges represent the selected relations among entities. A combination of mutual properties or relations is possible and interesting as well. In subsection 4.3 we discuss an example involving different types of relations. When aligning ontologies visually, the users are interested in the global properties of the data such as: B
Are there any distinct groups of entities that are strongly interconnected (i.e. graph clusters)?
B
How do these entities split into separate clusters and how do these clusters relate?
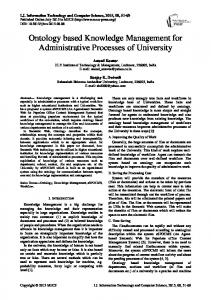
Small world graphs in social networks (Milgram, 1967) are graphs that have a small average path length (average shortest path between nodes) compared to their number of nodes, but have a high degree of clustering compared to a random graph of the same size. So, small world graphs combine features of both regular graphs and random graphs causing short as well as long paths between neighboring entities. Informal evaluation of structures of different ontologies showed the same property, which makes clustering a suitable approach for visualizing ontology alignment. An adequate visualization for clusters should communicate the underlying structure efficiently. The number of visible elements needs to be reduced, but at the same time we shall maintain the global structure of the complete graph. That means to find a representative visual abstraction of the original graph. Figure 1 depicts AlViz showing the alignment of two ontologies about tourism with a high degree of detail and one specific entity marked with a blue shadow in all four views[1]. In particular, the concept ‘‘Ereignis’’ (event) is highlighted in both ontologies. Clustering the nodes would emphasize the overall structure of the graph. The colors of the nodes and the dots next to the entities’ names represent the degree of similarity or type of association. We distinguish six categories of association between entities described earlier in section 2. Based on the results of the mapping algorithm we generate the input file for AlViz. By default an entity of one ontology equal to an entity in the other ontology is colored red, a syntactically equal entity is colored orange, an entity broader than an entity in the other ontology appears blue, a narrower entity is colored violet, a similar entity is colored green, and finally an entity different from all entities in the other ontology is colored yellow. In the graphs the clusters of nodes inherit the colors of the underlying nodes in accordance to the selected comparison strategy (Lanzenberger and Sampson, 2006). AlViz is implemented in Java as a plug-in for Prote´ge´ based on an available solution (Ingram, 2005), which transforms the original small world algorithm from three to two dimensions. Further optimization of the graphs is necessary in order to perform detailed user tests. For the calculation of the alignment values we have extended the general alignment process of Foam (Ehrig, 2007) to include transformation, evaluation and visualization of the output results. We claim that it is necessary to transform the output from lists of entity pairs into a format that can be understood and evaluated by domain experts. Furthermore, a lot of information regarding how entities are related between ontologies is hidden when just examining lists of entity pairs.
j
j
PAGE 106 JOURNAL OF KNOWLEDGE MANAGEMENT VOL. 12 NO. 6 2008
Figure 1 AlViz: the four views visualize two ontologies named tourismA and tourismB
The user can select object properties using a drop-down list, which shows all available relations (i.e. mutual properties) of the ontologies involved. Based on the selected property or properties, the OWL source files of both ontologies, and the input file holding the categories of associations AlViz, generates the visualization file. Finally, this file is used as input to draw the nodes and edges of the graphs and the entries of the J-Trees. A variety of interaction functionality is implemented in AlViz in order to conveniently support the exploration and assessment tasks. The development of AlViz is an ongoing process and first results of an informal evaluation indicate that the tool is suitable for ontologies up to 1,000 entities. With the small world graph approach it shares its good functionality of making semi-structured data accessible on different levels of details. This feature helps the user when aligning ontologies visually.
4. Understanding alignments and perceiving semantic features 4.1 Quality aspects in ontology alignment Based on an extended framework for understanding conceptual model quality (Sampson, 2007; Lindland et al., 1994) we define ontology alignment quality. The purpose of our framework was to provide a formal background for understanding the quality of ontology alignment results in a comprehensive way. Table III shows the relevant quality aspects along with their means, goals, and existing tools or approaches. The details of the underlying quality alignment framework are explained by Sampson (2007). Quality of alignment is described in terms of physical, syntactic, semantic, pragmatic, perceived semantic, social, and taxonomic properties. In the following we discuss these aspects of the quality alignment framework in more detail. Existing alignment algorithms usually produce text lists of alignment pairs to be considered for alignment, in this respect the lack of a formal language makes measuring the syntactic
j
j
VOL. 12 NO. 6 2008 JOURNAL OF KNOWLEDGE MANAGEMENT PAGE 107
Table III Main quality types in ontology alignment Quality type
Goals
Means and ontology properties
Activities and tools
Physical
Externalization
Syntactic
Internalizeability Syntactic correctness
Description logic for specifying the alignments Persistence, availability Formal syntax
Semantic
Validity completeness
OWL DL ontology Modularity
Pragmatic
Feasible comprehension
Transformation of alignment results Concept maps Proofs and explanations
Perceived semantic
Feasible perceived validity Feasible perceived completeness
Driving questions Explicit identification of relation types, location, and, context
Social
Feasible agreement
Taxonomic
Simplicity flexibility
Information visualization techniques Collaboration functionality Taxonomic evaluation (Go´mez-Pe´rez, 2004) OntoClean (Guarino and Welty, 2004)
OWL DL, RDF Ontology editing tools (Grosso et al., 1999) DL knowledge base repository Ontology syntax validators (Bechhofer and Volz, 2004) Alignments using formal language Formal semantics Consistency checking (Haarslev et al., 2004) Cohesion metrics Precision and recall Alignment visualization tools, e.g. AlViz (Lanzenberger and Sampson, 2006) e.g. Inference Web (Shvaiko et al., 2005) User confirmation of alignment statements Verification or falsification of hypotheses, e.g. by AlViz (Lanzenberger and Sampson, 2006) Collaborative visualization tools Ontology visualization OntoViz (Sintek, 2007), Jambalaya (Storey et al., 2001)
quality difficult. However, a few approaches (e.g. the Prompt tool; Noy and Musen, 2003) store the alignment results using ontologies that can then be evaluated for syntactic quality. Syntactic quality is the degree of correspondence between the ontology and the language extension. Syntactic correctness requires a syntax check of all model constructs. This can be achieved by using automatic validators specifically designed for checking the syntax of OWL ontologies. When considering the syntactic quality of the ontology alignments, we are evaluating the correspondence between the ontology alignment and the language extension. Current ontology management tools do not provide alignment results, which can be interpreted and understood by ontology engineers easily. However, we argue that it is important to validate alignment results and that each set of actors should understand the part of the ontology which is relevant to them. Although the primary goal for semantic quality is a correspondence between the externalized ontology and the domain, this correspondence can neither be established nor checked directly. Instead, like conceptual model development, we use the participants’ knowledge regarding the domain. In order to check the ontology we have to compare this with the participants’ interpretation of the externalized ontology. Pragmatic quality is the degree of correspondence between the ontology and the audience interpretation. This is the degree to which the model has been understood. Pragmatic quality can be measured through the subjective measure of pragmatic correctness. That means to measure whether the two ontologies and the relations between them are both understandable and understood. A graphical representation of the ontology alignment is an important facilitator for achieving pragmatic quality. InfoVis techniques support users – for example ontology engineers – to answer the following questions related to pragmatic quality:
j
B
What is the alignment for?
B
How can one use it?
B
Where does it come from?
j
PAGE 108 JOURNAL OF KNOWLEDGE MANAGEMENT VOL. 12 NO. 6 2008
B
And why is there an alignment?
The underlying ontologies represent two different interpretations of the domain. Thus, evaluation of the perceived semantic quality of the ontologies and ontology alignment is based on the comparison of two imperfect interpretations. Perceived semantic quality is the relationship between the knowledge of the ontology engineers and their interpretation of the ontology. This includes checking for perceived completeness and validity. Metrics for the degree of perceived validity are the number of invalid alignment statements interpreted, divided by the total number of alignment statements interpreted by the actor or user. Metrics for the degree of perceived completeness are the number of relevant alignment statements known, but not identified by the alignment algorithm, divided by the total number of relevant knowledge statements known by the actor. In order to understand the semantic features of the alignments, the user may confirm or reject the alignments one by one, or on a more general level the user will formulate competency questions or hypotheses and verify or falsify them supported by InfoVis methods. Currently, none of the ontology management tools support social agreement between stakeholders, or ontology engineers. They most often assume one single ontology engineer is undertaking the alignment, and no agreement is therefore necessary. However, the whole point in ontology alignment is that we bring together, or align, ontologies that may have been created by different user communities with quite different interpretations of the domain. Social quality describes the relationship among varying ontology interpretations of the social actors. Means to achieve social quality are presentations of the alignment results in such a way that the different alignment types are explicitly distinguished and the location of the alignments from both, a detailed and global perspective are highlighted. Taxonomic quality describes the correctness of the semantic relations in the ontology. We recommend that the ontology engineers evaluate the taxonomic quality of the individual ontologies prior to ontology alignment. Quality goals for taxonomic quality, simplicity and flexibility, are to establish that the ontology model contains the minimum number of classes and properties necessary to represent the required statements. Different tools and methodologies have been proposed for this purpose, for example OntoAnalyser (Sure et al., 2002) and ODEClean (Ferna´ndez Lo´pez and Go´mez-Pe´rez, 2002). In Go´mez-Pe´rez (2004) a method for evaluating taxonomic knowledge in ontologies is described. The method evaluates consistency, completeness and conciseness on taxonomies, and explains how to detect taxonomic errors. Ontoclean (Guarino and Welty, 2004) is another methodology for validating the ontological adequacy of taxonomic relationships. Physical quality refers to the text file that encodes the alignments using a specific formal language. Some quality measurements can be supported by InfoVis techniques. In particular, when dealing with large and complex data, InfoVis enables users to identify common characteristics or discrepancies in the data quickly by so-called pre-attentive cues. Such pre-attentive cues like shape and size are perceived in parallel and do not require explicit attention by the user. In the next subsection we discuss how visual cues can assist in general. 4.2 Visual features for exploration and analysis Goal-driven exploration, conducted for instance when evaluating the pragmatic and perceived semantic quality, for example by verification of hypotheses, is a major topic in InfoVis. Shifting some parts of the cognitive workload to perception abilities, InfoVis especially helps when investigating huge data sets. It uses visual metaphors to ease the interpretation and understanding of complex data in order to provide the user with relevant information. Generally, three categories of visualizations are distinguished (Schumann and Mu¨ller, 2000). Thus, visualizations are characterized by their purpose for: B
Exploration – the user searches for structures and unknown relations, which provide her or him with new insights about the data under investigation. A possible outcome of the exploration process is a derived hypothesis about the data, which may be analyzed next.
j
j
VOL. 12 NO. 6 2008 JOURNAL OF KNOWLEDGE MANAGEMENT PAGE 109
B
Analysis – starting with certain hypotheses about the data, the user tries to prove them by goal-oriented investigations. Finally, the hypotheses are proven by verification or falsification.
B
Presentation – After exploration and analysis processes are done, possible findings need to be communicated to others. This task is handled by the presentation.
Whereas in the first two categories the user has the central and active role, in the third the designer of the visualization is more important and defines the goals. Our focus is exploration and analysis, because we anticipate InfoVis mainly as an interactive exploration technique focusing on the users and their tasks. So in our opinion, InfoVis aims at making complex data accessible for interactive investigation by the user. We see exploration in the tradition of early approaches in statistics, which emphasized giving rapid statistical insight into data (Tukey, 1977). In this context exploratory data analysis (EDA) is an approach to how data analysis should be carried out and uses a variety of techniques in order to (National Institute of Standards and Technology, 2003): B
maximize insight into a data set;
B
uncover underlying structure;
B
extract important variables;
B
detect outliers and anomalies;
B
test underlying assumptions;
B
develop parsimonious models; and
B
determine optimal factor settings.
When developing AlViz, we had these guidelines for data analysis in mind. AlViz supports the user in understanding the alignment process and manipulating its results in order to improve and maintain its quality. In terms of perception small world graphs utilize features of the Gestalt tradition. In particular, the Gestalt Law of Organization is a significant feature. It explains why we perceive overall patterns instead of single items: ‘‘When we are presented with a number of stimuli, we do not – as a rule – experience a number of individual things [. . .] Instead larger wholes [. . .] are given in experience, their arrangement and division are concrete and definite’’ (Wertheimer, 1967). The Gestalt psychologists thought that the way in which parts of a figure are influenced by such factors as proximity, good continuation, and closure, reflects a natural tendency toward good forms in our experience (Coren and Girgus, 1980). Besides features like position, size, and shape, the color is an outstanding property, which supports the perception of items belonging together. Asch’s Concept of Unit Formation explains another aspect: it is easier to remember two or more objects if you see them as one unitary pattern. Gestalt psychologists believed the reason is for this is that unitary patterns are much more coherent perceptually, and can be remembered as units. Switching among different levels of clustering the user perceives the various groups of nodes as units, which helps to remember the position of the individual entity. Figures 2-7 give an impression of clustering. Along these figures we continue with a discussion of verification of alignment results in more detail. 4.3 Verifying alignments – an example As described earlier, AlViz uses small world graphs, which apply clustering functionality in combination with J-Trees. The tool shows two ontologies in a multiple-view system with four views. This provides the user with details and overview at the same time and intuitive means to switch between levels of detail. In Figures 2 and 3 parts of two ontologies are visualized. AlViz (compare Figure 1) looks a little different because it arranges the two ontologies horizontally and provides interaction functionality. However, to describe an example of a verification task practically, it is appropriate to reduce the complexity of the user interface. So, besides the data, only the clustering sliders are depicted. Figure 2 shows a sub-graph of the first ontology called tourismA. Normally, the complete number of entities applying the
j
j
PAGE 110 JOURNAL OF KNOWLEDGE MANAGEMENT VOL. 12 NO. 6 2008
Figure 2 Sub-graph of ontology tourismA
Figure 3 Sub-graph of ontology tourismB
selected view (i.e. concepts, object or data properties, and instances) is visualized at the same time[2]. Sometimes it is not necessary to see the whole ontology – clustered or not. Moreover, too many visual objects not relevant for a specific task may impede exploration. Therefore, the user can focus on a certain entity, so that the graph only represents the related entities, emphasizing the context of this specific entity. This view includes all sub-entities (transitive relation) and directly related entities (non-transitive relation), supplemented with all relations
j
j
VOL. 12 NO. 6 2008 JOURNAL OF KNOWLEDGE MANAGEMENT PAGE 111
Figure 4 Partly clustered sub-graph of tourismA
Figure 5 Partly clustered sub-graph of tourismB
and entities among them within a beforehand defined number of hops (relations). The second source ontology (tourismB) is visualized in Figure 3. In the particular example of Figures 4 and 5 the labeled nodes represent concepts, the edges represent three different types of relations, and the entity ‘‘Urlaub’’ (vacation) is focused[3]. In tourismA the depicted relations are: IsA, HasPeriod (hatReisedauer), GoesToRegion (hatZiel), UsesVehicle (hatReisemittel). The IsA paths are shorter than the others because we gave these edges a higher weight. In order to distinguish different types
j
j
PAGE 112 JOURNAL OF KNOWLEDGE MANAGEMENT VOL. 12 NO. 6 2008
Figure 6 Highly clustered sub-graph of tourismA
Figure 7 Highly clustered sub-graph of tourismB
of relations such as functional, transitive, or non-transitive we apply different weights, which can be modified by the user according to the exploration needs. In a simpler version of graph visualization the user may select one type of relation only. However, showing all relations of the central entity at once gives an impression of its context. The sub-graph of tourismB (Figure 5) consists of the relations: IsA, HasAPeriod (hatEineDauer), Equipment Needed (manBenoetigtAusruestung), HasAGoal (hatEinZiel). Whereas tourismA has three subclasses of the central concept, tourismB has only two.
j
j
VOL. 12 NO. 6 2008 JOURNAL OF KNOWLEDGE MANAGEMENT PAGE 113
Although the entities ‘‘Erholungsurlaub’’ (recreation) and ‘‘Erlebnisurlaub’’ (adventure) are identified as syntactically equal in both ontologies, the third called ‘‘Aktivurlaub’’ (active vacation) in tourismA with no directly corresponding entity in tourismB, was found to be similar to another entity by the alignment algorithm. By highlighting the questionable concept we perceive the associated concept in the other ontology. It is ‘‘Erlebnisurlaub’’. Based on the similar object properties, which are inherited from the super-class (‘‘Urlaub’’), on the one hand, and a smaller distance (in terms of characters to be changed) between ‘‘Aktivurlaub’’ and ‘‘Erlebnisurlaub’’ than between ‘‘Aktivurlaub’’ and ‘‘Erholungsurlaub’’, on the other hand, the Foam algorithm calculates the association, which says ‘‘Aktivurlaub’’ and ‘‘Erlebnisurlaub’’ are similar. Similar concepts are colored green, whereas syntactically equal concepts are of an orange color. Obviously, in Figures 6 and 7 the algorithm found many syntactically equal concepts but just a few similar concepts[4]. For the moment we ignore the other green nodes and investigate the concept of ‘‘Aktivurlaub’’ only. The graphs show that the neighborhood of ‘‘Aktivurlaub’’ in tourismA and of ‘‘Erlebnisurlaub’’ in tourismB are similar, which strengthens the claim that both concepts are closely associated. But ‘‘Erlebnisurlaub’’ in tourismA is also related to ‘‘Erlebnisurlaub’’ in tourismB: both concepts are syntactically equal. Now the user needs to decide whether changes of one or both ontologies are required and confirm or reject the alignment of type ‘‘similar’’ between ‘‘Aktivurlaub’’ in tourismA and ‘‘Erlebnisurlaub’’ in tourismB. She or he could formulate an assumption such as ‘‘Aktivurlaub’’ in tourismA should be rated being equal to ‘‘Erlebnisurlaub’’ in tourismB. The task is more difficult for both, human and algorithms, since no instance data or subclasses of both concepts are included. Anyway, the purposes and future services of both ontologies are considered when deciding about the questionable alignment. Given that tourismA is an ontology of a travel agency offering many mountaineering events, the concept ‘‘Aktivurlaub’’ is introduced in order to distinguish such service from other types of adventure (like sightseeing or watching whales), which are assigned to ‘‘Erlebnisurlaub’’. Perhaps the other ontology does not need to distinguish between both types because they offer sight seeing and cultural events mainly, but only a very small number of sport events. Then the alignment between both entities seems justified. However, similar is a weak association. If we expect equal instances (identified by the same URIs) for both concepts we can change the association to ‘‘equal’’ making the association strong. Such upgrade in similarity should be done with caution. Potential modifications of the source ontologies are changes of labels or the introduction of a new super-class aggregating ‘‘Aktivurlaub’’ and ‘‘Erlebnisurlaub’’ in order to create a better alignment candidate, etc. Such re-engineering of ontologies could become complex easily and should be done only if really necessary. Although here figures show static images, the process of exploration is a highly interactive process. By clustering the graphs as shown in Figures 6 and 7 we perceive the context in a more abstracted way. The structures of both ontologies seem to converge on a higher level of abstraction masking the sub- and super-classes of the focused concept. In both ontologies ‘‘Urlaub’’ is related to three other concepts. A difference is caused by one concept in tourismB: the ‘‘Root’’ concept, which is a very general entity. Next the user may investigate this relation in more detail because it could indicate a shortcoming in ontology design. An in-between sight of the aligned ontologies is depicted in Figures 4 and 5 making the transformation of the view more traceable. In terms of the framework of quality alignment the user is supported in evaluating the pragmatic and the perceived semantic quality. This is done by investigating the context of entities and interactively exploring and analyzing both ontologies.
j
j
PAGE 114 JOURNAL OF KNOWLEDGE MANAGEMENT VOL. 12 NO. 6 2008
‘‘ The exploration of ontologies could be an efficient and powerful way for organizations or communities of practice to share knowledge. ’’
5. Related work in ontology alignment visualization Currently, just a few ontology tools realize interactive, visual support of ontology alignment or ontology merging. In particular, we identified Prompt-Viz (Perrin, 2004) and OLA (Euze´nat et al., 2004) as related to our work. In the following we give a short description of both tools. Prompt-Viz is a visualization tool for Prote´ge´’s Prompt plug-in (Noy and Musen, 2003). It provides one single visual representation of two (merged) ontologies using histograms within a tree map (Shneiderman, 1992). The bars in the histograms represent the percentage of descendents classified as unchanged, added, deleted, moved-from, moved-to and directly changed, respectively. It is divided into four linked frames: 1. an expandable horizontal tree layout of the ontology showing the differences; 2. a tree map layout of the ontology embedded in a zoomable user interface; 3. a path window that shows the location of the currently selected concepts within the IsA hierarchy of the ontology; and 4. a detailed list of the changes (if any) that have occurred to the currently selected concept. OWL Lite Alignment (OLA) (Euze´nat et al., 2004) uses graph-based visualizations to represent ontologies. In particular, an extended JGraph API is applied. The graph structure of OLA makes relationships between language elements explicit, for example if a class c refers to another class c0 via the owl:allValuesFrom restriction, a labeled path between the corresponding nodes in the OL-graph is shown such that the connection between both classes is perceived intuitively. Besides common sub-class or super-class relationships the user can activate the display of edges between objects that are reverse, symmetric or transitive. For ontology alignment it is important to make consequences of mapping decisions visible within the individual source ontologies. We believe that a convenient ontology alignment tool needs to offer both details and overview in an easily understandable and manipulable way. Thus, we have identified some shortcomings of OLA and Prompt-Viz when used for visual ontology alignment. Whereas OLA lacks of overview and zooming mechanisms, which are necessary for the interactive visualization of ontologies, Prompt-Viz fails to show enough details about the source ontologies. Prompt-Viz enables the user to view the result of two merged ontologies but when exploring the visualization, it is difficult to understand why certain actions in the merging process took place and what their consequences are. Although this tool offers an interesting visualization approach, it loses some intuitive aspects of graph visualizations (e.g. hierarchical relations among concepts). Moreover, by using one single view for representing both ontologies, the properties of the source ontologies lose their explicitness, which may be sufficient for merging but impedes the alignment of ontologies. OLA displays all details about the concepts, properties, and instances of the ontology at once without any overview functionality. Given more than 20 entities – which is quite a small number – the user can view only parts of the graph and the context is lost. Currently, the visualization is limited to showing only one ontology at a given time. For the alignment visualization, the authors plan to display two of such graphics next to each other. Too many overlapping edges and labels are a current challenge of OLA. However, the main problem is that the graph gets cluttered because a single visualization covers all the details without any zooming functionality.
j
j
VOL. 12 NO. 6 2008 JOURNAL OF KNOWLEDGE MANAGEMENT PAGE 115
A growing number of visualization plug-ins for Prote´ge´ are available (e.g. OntoViz tab (Sintek, 2007), Jambalaya (Storey et al., 2001), TGViz (Alani, 2003), OWLViz (Horridge, 2005)) indicating the importance of visualization approaches for the development and management of ontologies. However, the lack of overview-and-detail functionality is an open issue for all of these existing tools and especially relevant when applied in ontology alignment. We address this challenge by deploying clustered graphs within a multiple-view visualization plug-in for Prote´ge´.
6. Conclusion and future work Within the next decade many people hope to see the data removed from the worldwide web. Instead they want to populate it with knowledge. Such a paradigm shift emphasizes the need for knowledge representation methods like the introduction of ontologies to the semantic web portfolio. However, in order to make data accessible for tool-supported manipulation, integration, and usage, which are significant steps in humans’ efforts of gaining knowledge, interoperability among different knowledge representations and knowledge domains is essential. Beyond technical aspects we need to focus on semantic interoperability issues. To that end, ontology alignment allows for relating metadata and bringing ontologies into mutual agreement. Along our framework for ontology alignment quality we have identified a number of important aspects for assessing alignment results. This can be partly supported by tools but human evaluation is still required. Current alignment tools usually create long lists of pairs of entities that are difficult to interpret in detail. Moreover, it seems impossible to assess the alignment results in a comprehensive way considering both ontologies as one knowledge resource. With AlViz, our alignment visualization tool, we help the user to explore ontology alignment results in both ways, in detail and with the overall consequences. When relating two ontologies we might have following questions in mind: B
Where do most of the mappings between ontologies occur? (location);
B
Do the mapping choices directly or indirectly affect parts of the ontology we are concerned about? (impact);
B
What kinds of alignments occur between the ontologies? (type);
B
How different is the generated ontology (which combines parts of both source ontologies and is created by the alignment) to the individual source ontologies? (extent);
B
Finally, we are interested in the degree of additional knowledge derived when aligning two ontologies (benefit).
Assessing and improving alignment results means to integrate new knowledge in a goal-oriented but careful way. Appropriate ontology alignment visualization offers practical means to support humans in achieving such challenging tasks. When assessing the relations among ontological entities human present essential capabilities to ensure the quality of alignment results. But we can think of ontology alignment in a different context as well: the assessment enables learning processes. So, ontology alignment could help learners and even communities of practice in the process of active and user-centered learning and sharing knowledge. Our visualization tool could enable the users to interactively explore alignment results, which may support learning activities. We think this feature raises some interesting questions for further research.
Notes 1. The nodes of the graphs and dots next to the list entries represent the similarity of the ontologies by color. The size of the nodes results from the number of clustered concepts. The graphs show the IsA relationship among the concepts. Green indicates that similar concepts are available in both ontologies, whereas red nodes represent equal concepts. The sliders to the right adjust the level of clustering. One concept (called ‘‘Ereignis’’) is highlighted in all views and shown with the tool tip text in tourismA (a color picture is available online at: www.ifs.tuwien.ac.at/,mlanzenberger/alviz/ graphics/KM/Figure1.pdf)
j
j
PAGE 116 JOURNAL OF KNOWLEDGE MANAGEMENT VOL. 12 NO. 6 2008
2. Small world graph visualizations of two ontologies in the tourism domain: the focus of the graph is on the entity ‘‘Urlaub’’ (vacation) showing all related concepts for both ontologies. Labeling is activated, the colors represent the type of alignment based on the results of the alignment algorithm: orange means that there is at least one syntactically equal entity in the other ontology; green indicates similarity with at least one entity of the other ontology based on the ’’neighborhood’’. In this view the nodes are not clustered meaning each node of the graph represents one entity (color pictures are available online at: www.ifs.tuwien.ac.at/, mlanzenberger/alviz/graphics/KM/ Figure2.pdf and www.ifs.tuwien.ac.at/,mlanzenberger/alviz/graphics/KM/Figure3.pdf). 3. By moving the cluster sliders next to the graph the user can zoom in or out. The number of aggregated entities is shown next to the label. This example shows the clustering along the ‘‘IsA’’ relations – transitive relations are clustered first (color pictures are available online at: www. ifs.tuwien.ac.at/, mlanzenberger/alviz/graphics/KM/Figure4.pdf and www.ifs.tuwien.ac.at/, mlanzenberger/alviz/graphics/KM/Figure5.pdf). 4. Clustering emphasizes the structure of the ontology. An iterative process of zooming in and out allows exploring the ontology on different levels of detail. Here clustering fades out the ‘‘IsA’’ relationships among the entities focusing on the non-transitive relations of the central entity ‘‘Urlaub’’. In tourismA vacation is related to region (Gebiet), vehicle (Fortbewegungsmittel), and period (Zeitraum). In tourismB the related entities are: equipment (Ausruestung), root, and period as well. By exploring the relations, we see that root acts as a type of goal for the vacation, whereas region has a geographical scope only (color pictures are available online at: www.ifs.tuwien.ac.at/ ,mlanzenberger/alviz/graphics/KM/Figure6.pdf and www.ifs.tuwien.ac.at/,mlanzenberger/alviz/ graphics/KM/Figure7.pdf).
References Alani, H. (2003), ‘‘TGVizTab: an ontology visualization extension for Prote´ge´’’, Proceedings of Knowledge Capture (K-Cap’03) Workshop on Visualization Information in Knowledge Engineering, Sanibel Island, FL, ACM Press, New York, pp. 2-7, available at: http://eprints.ecs.soton.ac.uk/8326/01/ Alani-VIKE-camera-ready.pdf Bechhofer, S. and Volz, R. (2004), ‘‘Parsing owl dl: trees or triples?66’’, Proceedings of the 13th International Conference on the World Wide Web, ACM Press, New York, NY, pp. 266-75, available at: http://phoebus.cs.man.ac.uk:9999/OWL/Validator (accessed March 30, 2007). Berners-Lee, T. (1998), ‘‘Semantic web road map’’, available at: www.w3.org/DesignIssues/Semantic. html (accessed March 30, 2007). Card, S., Mackinlay, J. and Shneiderman, B. (1999), ‘‘Information visualization’’, in Card, S., Mackinlay, J. and Shneiderman, B. (Eds), Readings in Information Visualization, Morgan Kauffman, San Francisco, CA, pp. 1-34. Coren, S. and Girgus, J. (1980), ‘‘Principles of perceptual organization and spatial distortion: the Gestalt illusion’’, Journal of Experimental Psychology, Vol. 6, pp. 404-12. Ehrig, M. (2007), Ontology Alignment – Bridging the Semantic Gap, Springer, New York, NY. Ehrig, M. and Sure, Y. (2004), ‘‘Ontology mapping – an integrated approach’’, in Bussler, C., Davis, J., Fensel, D. and Studer, R. (Eds), Proceedings of the First European Semantic Web Symposium, pp. 76-90, available at: http://dit.unitn.it/,accord/RelatedWork/Matching/Marc.pdf (accessed March 30, 2007). Ehrig, M., Haase, P., Stojanovic, N. and Hefke, M. (2005), ‘‘Similarity for ontologies – a comprehensive framework’’, Proceedings of the 13th European Conference on Information Systems, Regensburg, available at: www.aifb.uni-karlsruhe.de/WBS/meh/publications/ehrig05similarity.pdf Euze´nat, J., Loup, D., Touzani, M. and Valtchev, P. (2004), ‘‘Ontology alignment with OLA’’, Proceedings of the 3rd EON Workshop, 3rd International Semantic Web Conference, available at: http://km.aifb. uni-karlsruhe.de/ws/eon2004/EON2004_Proceedings.pdf or www.iro.umontreal.ca/, owlola/pdf/ align-compet-EON.pdf (accessed March 30, 2007). Ferna´ndez Lo´pez, M. and Go´mez-Pe´rez, A. (2002), ‘‘The integration of OntoClean in WebODE’’, Proceedings of the OntoWeb-SIG3 Workshop at the 13th International Conference on Knowledge Engineering and Knowledge Management, EKAW 2002, Siguenza, September 30, available at: http:// km.aifb.uni-karlsruhe.de/ws/eon2002/EON2002_Lopez.pdf (accessed March 30, 2007).
j
j
VOL. 12 NO. 6 2008 JOURNAL OF KNOWLEDGE MANAGEMENT PAGE 117
Go´mez-Pe´rez, A. (2004), ‘‘Ontology evaluation’’, in Staab, S. and Studer, R. (Eds), Handbook on Ontologies, Springer, Berlin, pp. 251-74. Grosso, W.E., Eriksson, H., Fergerson, R.W., Gennari, J.H., Samson, W. and Musen, M. (1999), ‘‘Knowledge modeling at the millenium the design and evolution of Prote´ge´-2000’’, Proceedings of the 12th International Workshop on Knowledge Acquisition, Modeling and Management (KAW’99), available at: http://smi.stanford.edu/smi-web/reports/SMI-1999-0801.pdf (accessed March 30, 2007). Gruber, T.R. (1993), ‘‘Towards principles for the design of ontologies used for knowledge sharing’’, in Guarino, N. and Poli, R. (Eds), Formal Ontology in Conceptual Analysis and Knowledge Representation, Kluwer Academic, Deventer, available at: http://ksl.stanford.edu/knowledge-sharing/papers/README. html#onto-design (accessed March 30, 2007). Guarino, N. and Welty, C. (2004), ‘‘An overview of OntoClean’’, in Staab, S. and Studer, R. (Eds), Handbook on Ontologies, Springer, Berlin, pp. 151-72, available at: http://ontolog.cim3.net/file/ resource/presentation/OntoClean–ChrisWelty_20041118/guarinowelty_final_v4.pdf (available at: March 30, 2007). Haarslev, V., Mo¨ller, R. and Wessel, M. (2004), ‘‘Querying the semantic web with Racer þ nRQL’’, Proceedings of the KI-2004 International Workshop on Applications of Description Logics (ADL’04), Ulm, September 24, available at: www.sts.tu-harburg.de/, r.f.moeller/racer/papers/2004/HaMW04.pdf, checked online (accessed March 30, 2007). Herman, I. (2007), ‘‘The semantic web’’, available at: www.w3.org/2001/sw (accessed March 30). Horridge, M. (2005), ‘‘OWLViz – a visualisation plugin for the Prote´ge´ OWL plugin’’, www.co-ode.org/downloads/owlviz/OWLVizGuide.pdf (accessed March 30, 2007). Ingram, S. (2005), ‘‘An interactive small world graph visualization’’, technical report, University of British Columbia, Vancouver. Jonassen, D. (2006), ‘‘Accomodating ways of human knowing in the design of information and instruction’’, International Journal of Knowledge and Learning, Vol. 2 Nos 3/4, pp. 181-90. Lanzenberger, M. and Sampson, J. (2006), ‘‘AlViz – a tool for visual ontology alignment’’, in Banissi, E., Burkhard, R.A. and Ursyn, A. (Eds), Proceedings of IV06, 10th International Conference on Information Visualization, IEEE Computer Society Press, Piscataway, NJ, pp. 430-8. Lindland, O., Sindre, G. and Sølvberg, A. (1994), ‘‘Understanding quality in conceptual modelling’’, IEEE Software, Vol. 11 No. 2, pp. 42-9. Milgram, S. (1967), ‘‘The small world problem’’, Psychology Today, Vol. 2, pp. 60-7. National Institute of Standards and Technology (2003), ‘‘Engineering Statistics Handbook’’, available at: www.itl.nist.gov/div898/handbook (accessed March 30, 2007). Noy, N. and Musen, M. (2003), ‘‘The PROMPT suite: interactive tools for ontology merging and mapping’’, International Journal of Human-Computer Studies, Vol. 59 No. 6, pp. 983-1024. Perrin, D. (2004), ‘‘PROMPT-Viz: ontology version comparison visualizations with treemaps’’, Master’s thesis, University of Victoria, Victoria. Sampson, J. (2007), ‘‘A comprehensive framework for ontology alignment quality’’, PhD thesis, Norwegian University of Science and Technology, Trondheim. Sampson, J. and Lanzenberger, M. (2006), ‘‘Visual ontology alignment for semantic web applications’’, in Roddick, J., Benjamins, R., Si-Said Cherfi, S., Chiang, R., Elmasri, R., Han, H., Hepp, M., Lytras, M., Misic, V., Poels, G., Song, I.-Y., Trujillo, J. and Vangenot, C. (Eds), Advances in Conceptual Modeling – Theory and Practice, ER 2006 Workshops Proceedings, 1st International Workshop of Semantic Web Applications: Theory and Practice (SWAT 2006), Lecture Notes in Computer Science, Vol. 4231, Springer, Berlin, pp. 405-14. Schumann, H. and Mu¨ller, W. (2000), Visualisierung – Grundlagen und allgemeine Methoden, Springer, Berlin. Sheth, A., Ramakrishnan, C. and Thomas, C. (2005), ‘‘Semantics for the semantic web: the implicit, the formal and the powerful’’, International Journal of Semantic Web and Information Systems, Vol. 1 No. 1, pp. 1-18, available at: http://knoesis.wright.edu/library/publications/download/SRT05-IJ-SW-IS.pdf (accessed March 30, 2007).
j
j
PAGE 118 JOURNAL OF KNOWLEDGE MANAGEMENT VOL. 12 NO. 6 2008
Shneiderman, B. (1992), ‘‘Tree visualization with tree-maps: a 2-d space-filling approach’’, ACM Transactions on Graphics, Vol. 11 No. 1, pp. 92-9. Shvaiko, P., Giunchiglia, F., Pinheiro da Silva, P. and McGuinness, D.L. (2007), ‘‘Web explanations for semantic heterogeneity discovery’’, in Go´mez-Pe´rez, A. and Euze´nat, J. (Eds), Proceedings of the 2nd European Semantic Web Conference (ESWC 2005), Vol. 3532, Lecture Notes in Computer Science, Springer, Berlin, pp. 303-17, available at: www.dit.unitn.it/ , knowdive/Publications/35320303.pdf (accessed March 30). Sicilia, M.A., Lytras, M., Rodrı´guez, E. and Garcı´a-Barriocanal, E. (2006), ‘‘Integrating descriptions of knowledge management learning activities into large ontological structures: a case study’’, Data and Knowledge Engineering, Vol. 57 No. 2, pp. 111-21, available at: www.cc.uah.es/msicilia/papers/ SICI_DKE_06.pdf (accessed March 30, 2007). Sintek, M. (2007), ‘‘Ontoviz tab: Visualizing prote´ge´ ontologies’’, available at: http://protege.cim3.net/ cgi-bin/wiki.pl?OntoViz (accessed March 30, 2007). Stanford Medical Informatics (2007), ‘‘prote´ge´-owl’’, available at: http://protege.stanford.edu/overview/ protege-owl.html (accessed March 30, 2007). Storey, M.-A., Musen, M., Silva, J., Best, C., Ernst, N., Fergerson, R. and Noy, N. (2001), ‘‘Jambalaya: interactive visualization to enhance ontology authoring and knowledge acquisition in prote´ge´’’, Workshop on Interactive Tools for Knowledge Capture with K-CAP-2001, Victoria, available at: www.cs. uvic.ca/ , mstorey/papers/kcap2001.pdf (accessed March 30, 2007). Sure, Y., Erdmann, M., Angele, J., Staab, S., Studer, R. and Wenke, D. (2002), ‘‘Ontoedit: collaborative ontology engineering for the semantic web’’, in Horrocks, I. and Hendler, J. (Eds), Proceedings of the International Semantic Web Conference (ISWC), Lecture Notes in Computer Science, Vol. 2342, Springer, Berlin. Tufte, E. (2001), The Visual Display of Quantitative Information, 2nd ed., Graphics Press, Cheshire, CT. Tukey, J. (1977), Exploratory Data Analysis, Addison-Wesley, Reading, MA. Van Ham, F. and van Wijk, J. (2004), ‘‘Interactive visualization of small-world graphs’’, Proceedings of the IEEE Symposium on Information Visualization 2004, IEEE Computer Society Press, Piscataway, NJ, pp. 199-206. W3C (2004), ‘‘OWL Web Ontology Language Guide’’, available at: www.w3.org/TR/owl-guide/ (accessed March 30, 2007). Wertheimer, M. (1967), Laws of Organization in Perceptual Forms, Humanities Press, New York, NY, pp. 71-88.
Further reading Ehrig, M., Haase, P., Hefke, M. and Stojanovic, N. (2005), ‘‘Similarity for ontologies – a comprehensive framework’’, in Bartmann, D., Rajola, F., Kallinikos, J., Avison, D., Winter, R., Ein-Dor, P., Becker, J., Bodendorf, F. and Weinhardt, C. (Eds), Proceedings of the Thirteenth European Conference on Information Systems, Regensburg, available at: http://is2.lse.ac.uk/asp/aspecis/20050131.pdf (accessed March 30, 2007).
About the authors Monika Lanzenberger received her PhD from the Vienna University of Technology, Faculty of Informatics in 2003. She is a member of the academic faculty of the Institute of Software Technology and Interactive Systems. Monika visited the Norwegian University of Science and Technology, Department of Computer and Information Science, Trondheim, Norway (February-October 2005) and the Centre for IT Innovation (CITI) at the CRP Henri Tudor, Luxembourg (November 2005-July 2006) doing a post-doctoral fellowship (ERCIM). She was a guest lecturer with the University of Bremen in Germany. Currently, she works on the visualization of ontologies and semantic data. The focus of her research is information visualization, ontology alignment, knowledge acquisition, and semantic web. Monika Lanzenberger is the corresponding author and can be contacted at: lanzenberger@ ifs.tuwien.ac.at Jennifer Sampson has recently completed her PhD in ontology alignment at the Norwegian University of Science and Technology (NTNU) in Trondheim, Norway. She also holds a Master’s in Information Systems and a Bachelor of Business Studies Honours from Massey
j
j
VOL. 12 NO. 6 2008 JOURNAL OF KNOWLEDGE MANAGEMENT PAGE 119
University in New Zealand. She has spent four years working as a consultant in the IT industry and has experience in both small and large systems development projects. Markus Rester is Assistant Professor with the Institute of Design and Assessment of Technology, Vienna University of Technology. He graduated with distinction both in computer science (MSc 2003) and doctoral studies (PhD 2007) at Vienna University of Technology. His PhD thesis deals with the evaluation of exploratory information visualiztion. Other research interests include usability, e-learning, computer mediated communication, and human computer interaction. Yannick Naudet is a researcher at the Centre de Recherche Public Henri Tudor in Luxembourg, and a board member of the ‘‘Reference systems for Certification and Modeling’’ research unit. His current research interests include semantic web, interoperability, information filtering, multimedia technologies, and independent component analysis. He received his PhD in Signal Processing, Automatic and Computer Sciences from the University of Reims Champagne-Ardenne, France, in 2001. He is a member of the IEEE Computer and Signal Processing societies. Thibaud Latour is in charge of the ‘‘Reference systems for Certification and Modeling’’ research unit and is currently managing several projects in the fields of computer-based assessment and knowledge management where semantic web technologies are intensively applied. He obtained his MSc in Chemistry in 1993 from the Computer Chemical-Physics Group of the Faculte´s Universitaires Notre-Dame de la Paix (FUNDP) in Namur (Belgium), working on conceptual imagery applied to supramolecular systems. From 1993 to 2000, he participated in several projects exploring AI techniques and developing ad hoc simulation methods for solving complex chemical problems. During the same period, he supervised a number of MS. thesis works in computational chemistry. He joined the Centre de Recherche Public Henri Tudor in 2000. He is a member of the IEEE Computer Society.
To purchase reprints of this article please e-mail:
[email protected] Or visit our web site for further details: www.emeraldinsight.com/reprints
j
j
PAGE 120 JOURNAL OF KNOWLEDGE MANAGEMENT VOL. 12 NO. 6 2008