Thomas Green and Marian Petre's classic paper "Usability analysis of visual programming environments: a 'cognitive dimensions' framework" [9] is often taken ...
Recent Researches ιn Applied Informatics
Visual programming language in geographic information systems Zdena Dobesova
languages [1]. Abstract—Visual
programming languages are nowadays commonly accessible in software of geographic information systems. In this article, a comparison of two different visual programming solutions in the area of geographic information systems is presented: the ModelBuilder in ArcGIS Desktop 10 and the Workflow Designer in Autodesk Map 3D 2011. The visual programming introduces a possibility of constructing several steps of spatial analysis as a work flow on geometric and attribute data. It is especially useful for users without specific knowledge of classical textual programming languages. In this article a practical application of model for batch processing is presented on example that demonstrates the generation of digital elevation models. ArcGIS software offers an extraordinary opportunity of exporting the final graphical model to Python programming language. An output script in Python can serve as a start point for the sophisticated algorithmic solution. All of the above mentioned techniques are described in detail in the following separate chapters.
Keywords - batch processing, data flow, geographic information systems, usability evaluation. I. INTRODUCTION
V
ISUAL programming represents primarily specific way of how to construct several steps in data processing. The idea of visual programming is based firstly on a graphical representation of separate steps and secondly on easy graphic construction of algorithm. Program elements are represented by graphic elements, simply by boxes and arrows. Program entities are depicted as boxes. The lines or arcs connect entities and express relations between them. A visual program is a directed graph. Visual programming languages (VPL) are aimed to a wide community of users who have no special knowledge of a high programming language. VPL is also referred to as dataflow or diagrammatic programming. The history of dataflow programming languages from the 1970s has been charted in Johnston’s article "Advances in Dataflow Programming Languages" [1]. The most important development in dataflow programming languages in 1990s was the advent of dataflow visual Manuscript received July 31, 2011. This work was supported by a project of the Czech Science Foundation No. 205/09/1159 „Intelligent system for interactive support of thematic map creation“, which was awarded from 2009 to 2011. Z. Dobesova is with the Palacký University, Faculty of Science, Department of Geoinformatics, Tr. Svobody 26, 771 46 Olomouc, Czech Republic. (corresponding author, phone: +420-585634763; fax: +420585634002; e-mail: zdena.dobesova@ upol.cz).
ISBN: 978-1-61804-034-3
276
II. CURRENT STATE OF VISUAL PROGRAMMING IN GEOGRAPHIC INFORMATION SYSTEMS
Geographic information systems (GIS) are specific information systems that are strongly oriented to process spatial information. Earth phenomena are represented by graphical data in a vector or raster format. Vector data are often joined with an attribute data in a relation database. The vector format uses three main forms of representation for the reality description: points, lines and polygon. GIS are becoming more and more popular among municipal and territorial organizations, environmental experts for their ability to manage the spatial data [2]. Spatial decision making tasks, simulations of spatial evolution and tasks comparing different data motivate growing interest in GIS. Common customers of GIS are not always familiar with textual programming languages to the necessary extent. Usually they are experts in GIS and in applications disciplines rather than programming itself. Several types of process diagrams can be used for better understanding of the analysis of spatial problem. The overview of diagrams and examples for the purpose of detection of weak points in the barrier-free environment are presented in the article by Sedlák et al. [3]. Event-driven Process Chain (EPC) diagram was mentioned to be highly efficient for detailed process description. The process can be followed by an automatically realized dataflow diagram. A. Review of visual languages in geographic information systems Some of the contemporary geographic information systems include components for visual programming or dataflow constructions. The names used for visual programming components vary inside the user interface of each geographic information systems. The term “visual programming language” does not appear. The name of the component in ArcGIS software from ESRI Inc. is ModelBuilder. This means that user models a sequence of steps and puts them together as a building process. The model can be utilized for batch processing of data, even though the name of the component does not explicitly indicate so. Documentation explains that "Models are workflows that string together sequences of geoprocessing tools, feeding the output of one tool into
Recent Researches ιn Applied Informatics
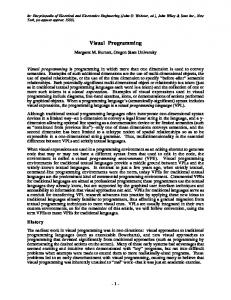
another tool as input" [4]. Users of ArcGIS software know this component very well under the name of ModelBuilder and they are familiar with its usage. On the other hand, the name of the visual programming component in AutoCAD Map 3D software is Workflow Designer [5]. Such name of the component better expresses the capability of a batch processing of data. The second word “Designer” also refers to the fact that the algorithm is visually design. However, the name of component for visual programming is not as important as the range of functionality and good usability. Other GIS software also includes this type of component for visual programming. Software IDRISI GIS by Clark Labs has component Macro Modeler. Macro Modeler is a graphical modeling environment for building and executing multi-step models [6]. This component was released by Clark Labs earlier than Model Builder in ArcGIS. Another software with VPL component is ERDAS IMAGINE by ERDAS Inc. Software ERDAS process mainly raster data as aerial and satellite images. The ERDAS visual programming component has name Model Maker [7]. Example of the model is on figure 1. Model Maker, a graphic flow chart model building enhancement to Spatial Modeler, was introduced in 1993.
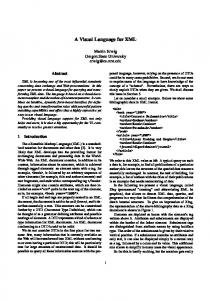
B. ModelBuilder in ArcGIS Desktop10 In 2004 ESRI released a graphic flow chart model-building environment idea under the name of ModelBuilder. Functions were improved from the older version to the newer version repetitively. Nowadays, version 10 is thoroughly elaborate. For example, the possibilities of cycle construction by iterations are accessible. Two basic graphic entities are used in models. The first is rounded boxes. These can express any spatial function (tools) from application ArcToolBox that can be dragged. The number of tools is more than 500, depending on ArcGIS license level. The boxes are filled by yellow color. The second entity - an ellipse (oval) - stands for the input and output data. The ellipses of the input data are blue, the ellipses of the output data are green. As result, shapes with different color filling are highly intuitive. Connection arrows are drawn by the user or drawn automatically after setting name of input/output feature classes on function boxes. The orientation of a graph can be arranged in any direction, both horizontally both vertically (Figure 2). The lengths of arrows are flexible according to the position of connected boxes. The start and the end of the diagram are not explicitly visualized. In most cases, start point is at the left upper corner and the end is on the bottom right. A hexagonal symbol is used as an iterator. Iterators are tools that repeat the same operation or loop through a set of input data or values [4]. The background color of a hexagon is orange.
Fig. 1 The model in ERDAS IMAGINE
An interesting visual solution for the spatial data querying is described in the article by Paolino et al. [8]. This visual environment named Phenomena is a standalone solution. The visual querying environment Phenomena is an alternative of the textual query language SQL. Two GIS software with the visual programming components are presented in the next part of this article. The first software is ArcGIS Desktop, version 10. The second software is AutoCAD Map 3D 2011. Both process vector based data. The history of each software is different. The AutoCAD Map is software of AutoCAD family. CAD software was used mainly in civil and mechanical engineering for more than 35 years. ArcGIS software is pure GIS software. Both are used worldwide in many countries and companies.
ISBN: 978-1-61804-034-3
277
Fig. 2 Example of a model in ModelBuilder in ArcGIS
The final model from ModelBuilder is stored and encapsulated at custom toolbox in a file with file extension TBX. One custom toolbox can content several models. Editing of a model is done only by the graphic editor. Viewing the source contents of the saved model is not possible. It is, however, possible to export the model to graphic file for a subsequent printing. Further advantages of the ModelBuilder are the model validation, the user labels in the model and model reports. Verifying of the model is possible by validation icon. This check - validation prevents user errors in a model. User can
Recent Researches ιn Applied Informatics
also put explanation notes by text annotations to the dataflow. Moreover, descriptive report can be automatically generated as a text file for the final model. The window with model can be zoomed in and zoomed out for better reading of details. The interface of graphic editor ModelBuilder is user-friendly and comfortable. C. Workflow Designer in AutoCAD Map 3D 2011 Workflow Designer was firstly released in version Map 2010. This data flow component has the shortest history. Next release 2011 and release 2012 introduce only partial changes.
Fig. 3 Card at ribbon for maintenance of Workflow diagrams
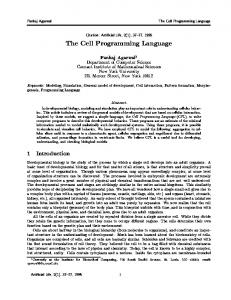
Organizing of work flows (creating, editing and running) is accessible from a card "Workflows" at ribbon (Figure 3). Detailed work flow is designed in separate window Workflow Designer (Figure 4).
The only graphic entities used are boxes. Data has no specific graphic representation. Information about input and output data is included in a box with activities. Detail description of each activity is set by icons on the right side of its box. The names of input and output data are specified as a parameter. The box with activity contains a text label of activity, too. It is also possible to skip a box with activities by disabling it. It is not necessary to remove the activity from dataflow, disabling is enough. The disabled activity changes its color to pink. Boxes with overlay analysis are provided with an explanation picture of the type of overlay. The arrows are added automatically to workflow diagram, the length of arrows is constant. Only top-down orientation is possible. The activities from the right part of the window can be drag-and-dropped to the designed dataflow. Diagram has two circles. Green circle is a start point and red circle is an end point of the diagram. Zooming is done by a dynamic zooming tool. A workflow diagram is stretched to fit the Designer window by clicking the icon at the bottom right. Pan tool shifts the diagram in window. Workflow framework in AutoCAD Map is based on ideas of Windows Workflow Foundation [9]. Model is stored as an XML document with file extension XOML. III. COMPARISON OF FUNCTIONALITY Thomas Green and Marian Petre’s classic paper "Usability analysis of visual programming environments: a ‘cognitive dimensions’ framework" [9] is often taken as the primary reference by many visual language researchers. They have used this paper as their basis with regard to usability questions. Many followed publications deal with the further development of the cognitive dimensions framework of visual programming in psychology context. Cognitive dimensions are terms which help to comprehend significant amount of psychology in programming. Some of "cognitive dimensions" by Green and Petre [10] were evaluated in the VPL modules in GIS: Abstraction gradient - Maximum and minimum level of abstraction, encapsulation of diagram fragments. Diffuseness – How many symbols, graphic entities are required to express meaning. Secondary notation – using of color, layout and other cues to express extra meaning. Viscosity – How much effort is required to perform a single change? Visibility – Is every part of the code simultaneously visible? Cognitive aspects are of relevance for learning a design language, creating models with it, and understanding models created using it [11]. Detail overview of functionality of visual programming in ArcGIS and AutoCAD Map is in Table 1.
Fig. 4 Window of the Workflow Designer in AutoCAD Map3D
ISBN: 978-1-61804-034-3
278
Recent Researches ιn Applied Informatics
TABLE I COMPARISON OF VISUAL PROGRAMING FUNCTIONALITY ArcGIS AutoCAD Map 3D Function Desktop Workflow Designer Model Builder Number of graphic entities 3 1 Start and End Point No Yes Color fill of entities Yes No Drag and drop of graphic Yes Yes entities Zoom of window Yes Yes Pan of window Yes Yes Enable/disable entity (activity) No Yes Validation of model/dataflow Yes No Encapsulation of another Yes No model/workflow Save and edit workflow Yes Yes Export to graphic/print Yes Yes Export to programming Python, JScript, No language VBScript Output status of Result window Log file model/dataflow
The cognitive dimension and function can be compared as follow. The viscosity and visibility are solved by intuitive tools in both GIS program. Secondary notation is well used in the ModelBuilder in ArcGIS by different fill colors of graphical shapes. As an exemplary, secondary notation in the Workflow Designer can be consider also graphical illustration of type of overlay operation in boxes. Encapsulation of other model is possible only in the ModelBuilder. The interface and style of work is significantly different in the ModelBuilder and the Workflow Designer. From the point of functionality, the ModelBuilder in ArcGIS is more useful and stronger. It is possible drag more than 500 tools from the ArcToolBox to the model. The number of tools depends on a number of the extension license. Cycle construction by iterator, list of variables and export to scripting languages are the most powerful features in ModelBuilder.
ModelBuilder. This advantage was used for setting a number of the input point for the spline interpolation method (10 or 20 points) and other input values. The lists are expressed as stacked ellipses. The output data – set of various digital elevation models is also graphically depicted as stacked ellipses on the right side of the model. Some tasks for the final creation of dataset of various DEMs were not possible fulfill in model. The improvement in programming language was needful. Secondly the model was exported from the ModelBuilder to Python script. The main part of the script was prepared automatically by exporting from model. The program code in Python was extended by several features. The commands for reading input parameters from text files were added. The content of text files was numeric variables for interpolation methods. After that, the commands for automatic construction of the output file name of DEMs were added. The file name expressed the values of numeric variables and the abbreviation of the name of testing area. The abbreviation was automatically taken from the name of the input layer. Finally, to prevent errors the construction try: except: was added. Some comprehensible messages about flow of the batch data processing were introduced to the important point of the script. Information and error messages were appeared in standard ArcGIS result window.
IV. CASE STUDY This chapter shows an example of possible usage of the ModelBuilder in ArcGIS Desktop. The example shows the batch process of generating of various digital elevation models (DEM). The ArcGIS software from ESRI has tools for interpolation of raster surfaces. The source for interpolation is a point data with elevation. There are four classical interpolation methods: IDW, spline with tension, regularized spline, and kriging in the ArcCatalog application (in the toolset “Interpolation method”, toolbox “3D analysis”). Research team on Department of Geoinformatics needed testing datasets of various DEMs for statistical evaluation. The aim was to find a suitable interpolation method and a suitable combination of parameters for different type of georelief by utilization all accessible interpolation method in ArcGIS [12]. Firstly was designed pure batch process in the ModelBuilder (Figure 5). Four interpolation methods were added as the analytic tools (square boxes). One point input layer was added to model as input for all interpolation method. Input parameters can be set as a list of parameters in the
ISBN: 978-1-61804-034-3
279
Fig. 5 Model for interpolation of digital elevation models in ArcGIS
The practical example show the effective way how create a script that is based primarily on a model. The main part of a script was quickly constructed in the visual editor
Recent Researches ιn Applied Informatics
[2]
ModelBuilder. After that, basic visual model can be refined after exporting to Python script language by specific programming commands. ModelBuilder extends a base functionality of ArcGIS in a useful way. The basic functionality of ArcGIS can be extent more effectively by using four application interfaces (based on ArcObjects): COM, .NET, Java, and C++. An advantage of application interface is a custom design of a dialog window for setting options for program application. Example of practical extension based on API and ArcObject was described in article "Program Extension for Diagram Maps" [13]. The program extension named Diagram map creator was aimed for better and automatic creation diagrams in the diagram maps. The final utilization is in cartographic production.
[7] [8]
V. CONCLUSION
[9]
Visual programming is intuitive in GIS. It is notably useful for users unskilled in textual programming languages. Graphical approach makes creating applications in GIS faster and easier than a manual running of separate tools. Additionally, the interfaces of visual language components are improved from version to version. Two solutions in the area of geographic information systems were compared in article ModelBuilder in ArcGIS Desktop 10 and Workflow Designer in Autodesk Map 3D 2011. Comparison was based on "cognitive dimensions" and on the amount of functionality. Both visual editors are intuitive, comfortable and simply to use. Editors support "drag and drop" construction and visibility is realized by zooming tools. The ModelBuilder in ArcGIS is better and more useful than Workflow Designer. Notable features are the cycle construction, the secondary notation by colors, the automatic creation of a report and export to several programming languages. Result is based on practical example, on documentations and mainly on the author practical experiences with visual programming and teaching of students. Some dataflow languages also allow automatic parallelization. Automatic parallelization converts sequential program function into a multi-threaded program code. Multithread is not supported so far in GIS. Multi-thread but remain programming challenges of the future in GIS visual languages. . During last ten years, there is interesting adoption of new trends from information science to geographic information systems. It is not only techniques of visual programming. There is significant convergence of artificial intelligence and geographic information systems [14]. Two artificial intelligence methods are widely used in GIS - artificial neural networks and fuzzy logic. New trends visual programming and artificial intelligence bring benefits to a wider range of users. REFERENCES [1]
W. M. Johnston, J. R. P. Hanna, R. J. Millar, “Advances in dataflow programming languages”. ACM Computing Surveys 36 (1) 1–34. 2004.
ISBN: 978-1-61804-034-3
280
[3]
[4]
[5] [6]
[10]
[11]
[12]
[13]
[14]
P. A. Longley, M. F. Goodchild, D. J. Maguire, D. W. Rhind. "Geographic Information. Systems and Science", Wiley, ISBN 0471495212, 2001. P. Sedlák, J. Komárková, M. Jedlička, R. Hlásný, I. Černovská "Modelling of spatial analyses processes for purpose of detection of weak points in barrier-free environment". In DEO, Narsingh, et al. APPLIED COMPUTER SCIENCE: Procedings of International Conference on ACS. Malta: WSEAS Press, 2010. pp. 419-412. ISBN 978-960-474-225-7. ISSN 1792-4863. ESRI. ArcGIS Desktop Help 10, What is ModelBuilder? Available: . Autodesk. AutoCAD Map 3D. Features. Workflows & Feature Rules. Available: . Clark Labs. IDRISI Taiga Key Features. Available: ERDAS IMAGINE Available: . L. Paolino, M. Sebillo, G. Tortora, G. Vittiello, R. Laurini. "Phenomena – A visual environment for querying heterogenous spatial data". Journal of Visual Languages and Computing. 20. pp. 420 –436, 2009. Microsoft. Windows Workflow Foundation... Available: T. R. G. Green, M. Petre, "Usability analysis of visual programming environments: A Cognitive Dimensions Framework". Journal of Visual Languages and Computing. 7. pp. 131–174, 1996. K. Figl, M. Derntl, M. C. Rodriguez, L. Botturi. "Cognitive effectiveness of visual instructional design languages". Journal of Visual Languages and Computing. Volume 21, Issue 6, 2010, pp. 359373. ISSN: 1045926X Z. Dobesova. “Automatic generation of digital elevation models using Python scripts”, Conference Proceedings SGEM 2011, 11th International Multidisciplinary Scientific GeoConference. STEF92 Technology Ltd., Sofia, Bulgaria, 2011, ISSN 1314-2704, pp. 599-604. Z. Dobesova, T. Valent. "Program Extension for Diagram Maps". Geodesy and Cartography, 37(01), Taylor & Francis, 2011, pp. 22 - 28. ISSN: 2029-7009. V. Voženílek. "Artificial intelligence and GIS: Mutual meeting and passing". International Conference on Intelligent Networking and Collaborative Systems, INCoS 2009, Spain, pp. 279-284.
Zdena Dobesova. Place and date of bird is Tábor, Czech Republic, 1964. She holds university degree from Czech Technical University in Prague, Faculty of Electrical Engineering, Czech Republic since 1987. She holds a PhD degree of Geoinformatics from Technical University in Ostrava, Faculty of Mining and Geology, Czech Republic since 2007. She has been work for Palacký University in Olomouc, Faculty of Science, Department of Geoinformatics, Czech Republic as a TEACHER from 2001. Previous position was computer network administrator at Palacký University in Olomouc. Recent publications: 1) Brus, J., Dobesova, Z., Kanok, J., Pechanec, V. "Design of intelligent system in cartography". In Brad, R. (ed.): Proceedings. 9 RoEduNet IEEE International Conference. Sibiu, University of Sibiu, Romania. 2010. pp. 112117. ISSN 2068-1038. ISBN 978-1-4244-7335-9. 2) Dobesova Z. "Evaluation of Cartographic Functionality in Geographic Information Systems". Palacký University Publishing House. 132 p. Olomouc. 2009. (In Czech and English) 3) Dobesova Z. AutoCAD Map 3D. Practical user textbook. Computer Press Brno, 2007. 238 p. ISBN 978-80-251-1856-6 (In Czech) Her research interests are GIS, spatial database, digital cartography, programming, scripting in Python for ArcGIS. Ing. Zdena Dobesova, Ph.D. is a member of Czech Geographical Society and Autodesk Academy.