Visual Support for Exploration within Web Search Results Lists Orland Hoeber∗
Xue Dong Yang†
Memorial University of Newfoundland
University of Regina
A BSTRACT The static list-based representation of Web search results remains essentially unchanged since the early days of Web search. This poster presents a simple and easy to understand visualization method to support users in the exploration of Web search results. A term frequency histogram provides a visual representation of the frequencies of the terms appearing in the title and snippet of the top search results. Users can interactively select positive and negative relevancy for terms in the histogram, resulting in the colour-coding of the corresponding terms within the search result list. This selection of terms also produces a re-sorting of the search results within the list, based on the use of the selected relevant and non-relevant terms. In addition to an interactive demo, results from a preliminary evaluation are presented in the poster. Index Terms: H.5.2 [Information Interfaces and Presentation]: User Interfaces—User-centered design; H.3.3 [Information Storage and Retrieval]: Information Search and Retrieval—Search process 1
I NTRODUCTION
The common method for representing Web search results is a listbased format in which searchers must consider each document oneby-one, and to some degree, in the order provided by the search engine. The interfaces used by the top Web search engines provide little or no ability to manipulate and explore the search results. Evidence of the challenges users encounter when dealing with Web search results have been brought to light by a number of studies focusing on the behaviour of Web searchers. In these studies, it was shown that users seldom venture past the third page of Web search results [5, 6]. When users’ information needs are very specific and when they are able to craft an accurate query, it may be possible to find the answers they seek among these first three pages of search results. However, in many situations, there may be a high degree of vagueness within users’ information needs. It is in these situations that an exploration tool is very valuable in supporting users in their tasks of finding relevant documents among many non-relevant documents in the search results lists. As noted by Nguyen and Zhang [3], “Web search result visualization is not merely a simple way of information presentation, displaying results for a query. It also provides an interactive environment for users to explore, discover, and analyze information.” Our research follows this same approach, providing tools and features that allow the user to take an active role in the Web information retrieval process. The system described in this poster, WordBars2, builds upon our previous research on using term frequency histograms to support both interactive query refinement and interactive search results exploration [2]. Although WordBars2 continues to support query refinement processes, the focus here is on the new features which support visualization and exploration within the search results lists. ∗ e-mail:
[email protected]
† e-mail:
[email protected]
2 W ORD BARS 2 2.1 Term Frequency Histogram WordBars2 employs the services of the Google API to retrieve the top 100 document surrogates for a given user query. As the set of search results are retrieved, the title and snippet from each of the document surrogates are combined in a bag-of-words approach producing a document descriptor text string. Commonly used terms, as well as terms that are less than three characters long are ignored. All other terms are reduced to their root forms using Porter’s stemming algorithm [4]. The frequency of each unique stem in the document descriptor is counted, the outcome of which is a term frequency vector corresponding to document surrogate dsi : ~Fi = ( fi1 , fi2 , · · · , fin ) where fi j is the frequency of the stemmed term j within the document surrogate dsi , and n is the total number of unique stems appearing in all the document surrogates processed. ~ is generated to represent the sum of A single master vector M the frequencies of the stems over the entire set of search results obtained. Sorting this vector results in the terms that are used most frequently appearing at the top, and those that are seldom used appearing at the bottom. Providing a visual representation of the top end of the sorted master vector gives users an impression of the relative frequencies of the commonly used terms within the title and snippet of the top search results. The result is that users can see this frequency information without having to read it. A vertically-oriented, colour-coded histogram is employed for this purpose (see Figure 1). Both the sizes of the bars in the histogram, as well as the intensities of the colours, represent the frequencies of the commonly used terms in the top search results. Features of the opponent process theory of colour [1] were used in the selection of a colour scale, which varies on the yellow-blue colour channel, as well as the luminance channel. As a result, frequently appearing terms are represented using large, dark blue bars; infrequent terms are represented using small, light yellow bars. Term labels are provided to the right of each frequency bar. All the terms that are present in the query are coloured orange; all others are dark grey. This use of colour allows users to easily identify their query terms within the histogram. Due to space considerations, only the 40 most frequently used terms are displayed in the term frequency histogram. While there may be relevant terms beyond this cut-off mark, we assume that the most beneficial terms are those that are used frequently within the title and snippet of the top search results. 2.2 Term Highlighting Within the Search Results List An important feature within WordBars2 is the ability to highlight relevant and non-relevant terms within the search results list. To the left of each element in the term frequency histogram are two icons. The positive icon (in the shape of a plus sign) is used to indicate that the corresponding term is relevant to the user’s information need. The negative icon (in the shape of a minus sign) is used to indicate that the corresponding term is not relevant. Initially, these icons are presented as subtle outlines (following Tufte’s principle of smallest effective difference [8]). When a user clicks on one of the icons, the outline icon is replaced with a fullcolour icon. Shades of green and red were selected to represent the
where n is the total number of unique stems that are present in the search results set processed, and the selection index si is given by: 1 if term i is selected as a relevant term 0 if term i is not selected si = −1 if term i is selected as a non-relevant term
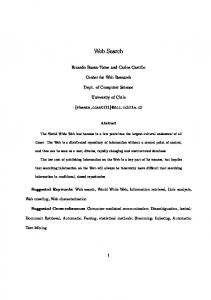
Figure 1: WordBars2 provides users with the ability to select relevant (green) and non-relevant (red) terms from the term frequency histogram, resulting in colour-coding of the terms in the search results.
positive (relevant) and negative (non-relevant) icons, respectively. Not only do these colours fall within a different colour channel than those used by the term frequency histogram, they also can be decoded into positive and negative colours based on a traffic light metaphor. In addition to indicating the selected terms with the colour icons, the background of the term within the term frequency histogram is highlighted using a low-luminance version of the same colour (i.e., low-luminance green for the relevant terms, and low-luminance red for the non-relevant terms). The luminance on these colours is reduced in order for there to be sufficient luminance contrast between the background colour and the font colour. Within the search results list, every term which has the same root as the selected terms is also highlighted with the corresponding positive or negative colour. The luminance of these colours is reduced even further than those used in the term frequency histogram. The goal was to avoid a “visual war with the heavily encoded information” [7], yet still effectively communicate to users the locations of the selected terms within the search results list. The inspiration for using this technique in WordBars2 comes from a similar highlighting technique used in the “find” feature in the Firefox Web browser. The end result is that as users select a relevant term by clicking on the corresponding positive icon, the icon is switched to its “on” state, the term in the histogram is highlighted in green, and all the instances of terms with the same root are highlighted green within the search results list. A similar process holds for the selection of negative terms, which are highlighted in red. An example showing the selection of both relevant and non-relevant terms is provided in Figure 1. 2.3
Search Results Re-Sorting
Although the original WordBars system supported search results resorting, this method has been extended in WordBars2 to reflect the selection of both the relevant (positive) and non-relevant (negative) terms from the term frequency histogram. As users select relevant and non-relevant terms, a selection vector ~S is generated: ~S = (s1 , s2 , · · · , sn )
The re-sorting of the search results is based on the dot product between the sort vector ~S and each term frequency vector ~Fi : svi = ~S • ~Fi . As a result of this calculation, each document surrogate within the search results is assigned a sort value svi . The search results list is re-sorted based on this value, in descending order. The outcome is that those document surrogates with a high sort value (i.e., containing relevant terms) are moved to the top of the list, and those with a low sort value (i.e., containing non-relevant terms) are moved to the bottom of the list. Note that the speed of these calculations is fast enough to provide the illusion of an instantaneous re-sorting of the search results based on selections made in the term frequency histogram. Clicking on any document surrogate will open the corresponding document in a new window, and will change the link colour from blue to purple (as per the de-facto standard for visited links in a Web page). This allows users to easily identify documents that have already been visited, even after the search results are subsequently re-sorted by the user. 3 C ONCLUSION AND F UTURE W ORK In the poster, the details regarding the visual and interactive features for Web search results exploration supported by WordBars2 will be presented (a video of which is available on the author’s web site1 ). In addition to an illustrative example, an live demo of the system will be available for use. The results of a preliminary study on the use of WordBars2 will also be included, indicating that the visual and interactive features are both easy to understand and effective for exploring documents within Web search results lists. A negative aspect of the visualization techniques used in WordBars2 becomes apparent when a user selects many relevant and non-relevant terms from the term frequency histogram. As more and more terms are selected, the colour-coded highlighting in the search results list moves from an aid in identifying the corresponding terms within the list, to visual noise within the interface. However, when only a few select terms are selected, and when the selections are made in an interactive and exploratory manner, the highlighting of the corresponding terms within the search results list can be a very valuable feature. R EFERENCES [1] E. Hering. Outlines of a Theory of Light Sense (Grundzge der Lehr von Lichtsinn, 1920). Harvard University Press, 1964. [2] O. Hoeber and X. D. Yang. Interactive web information retrieval using WordBars. In Proceedings of the IEEE/WIC/ACM International Conference on Web Intelligence, 2006. [3] T. N. Nguyen and J. Zhang. A novel visualization model for web search results. IEEE Transactions on Visualization and Computer Graphics, 12(5):981–998, 2006. [4] M. Porter. An algorithm for suffix stripping. Program, 14(3):130–137, 1980. [5] C. Silverstein, M. Henzinger, H. Marais, and M. Moricz. Analysis of a very large Web search engine query log. SIGIR Forum, 33(1):6–12, 1999. [6] A. Spink, D. Wolfram, B. J. Jansen, and T. Saracevic. Searching the web: the public and their queries. Journal of the American Society for Information Science and Technology, 52(3):226–234, 2001. [7] E. Tufte. Envisioning Information. Graphics Press, 1990. [8] E. Tufte. Visual Explanations. Graphics Press, 1997. 1 http://www.cs.uregina.ca/˜hoeber/WordBars2/