1Department of Biological Sciences, Florida Atlantic University, Boca Raton, Florida ... stimulus plus one of the other colors, not rewarded) when ...... NOAA Tech.
Reference: Biol. Bull. 222: 46 –55. (February 2012) © 2012 Marine Biological Laboratory
Visual Wavelength Discrimination by the Loggerhead Turtle, Caretta caretta MORGAN YOUNG1 MICHAEL SALMON1,* AND RICHARD FORWARD2 1
Department of Biological Sciences, Florida Atlantic University, Boca Raton, Florida 33431; and 2 Nicholas School of the Environment and Earth Sciences, Duke University Marine Laboratory, Beaufort, North Carolina 28516
Abstract. Marine turtles are visual animals, yet we know remarkably little about how they use this sensory capacity. In this study, our purpose was to determine whether loggerhead turtles could discriminate between objects on the basis of color. We used light-adapted hatchlings to determine the minimum intensity of blue (450 nm), green (500 nm), and yellow (580 nm) visual stimuli that evoked a positive phototaxis (the phototaxis “threshold” [pt]). Juvenile turtles were later trained to associate each color (presented at 1 log unit above that color’s pt) with food, then to discriminate between two colors (the original rewarded stimulus plus one of the other colors, not rewarded) when both were presented at 1 log unit above their pt. In the crucial test, turtles were trained to choose between the rewarded and unrewarded color when the colors varied in intensity. All turtles learned that task, demonstrating color discrimination. An association between blue and food was acquired in fewer trials than between yellow and food, perhaps because some prey of juvenile loggerheads in oceanic surface waters (jellyfishes, polyps, and pelagic gastropods) are blue or violet in color.
sonous species, or their mimics), recognizing species or individuals, and choosing mates (Bradbury and Vehrencamp, 1998; Kelber et al., 2003; Siddiqi et al., 2004; Cronin, 2007). Presumably, these capabilities evolve if doing so improves probabilities for survival and reproductive success. For color to be perceived, two requirements must be met. First, among vertebrates, the animal must possess at least two different visual pigments in two different types of cones. Second, the animal must have neural comparators designed to contrast signals received from those photoreceptors so that they can be perceived and responded to behaviorally (Jacobs and Rowe, 2004). Thus, physiological study alone is unable to provide conclusive evidence for color vision. Such evidence can only be obtained from appropriate behavioral studies (Bradbury and Vehrencamp, 1998; Birgersson et al., 2001; Kelber et al., 2003). The visual capabilities of marine turtles have been studied primarily from a physiological perspective (review: Bartol and Musick, 2003). Most of the behavioral studies, centering on visual orientation of hatchlings from the nest to the ocean, have been done at night (e.g., Mrosovsky and Carr, 1967; Mrosovsky and Shettleworth, 1968; Mrosovsky, 1972; Witherington and Bjorndal, 1991a, b) when rod vision dominates. Thus, there is no conclusive evidence that these animals perceive color. However, it is likely that sea turtles have color vision. Since the 1930s, the freshwater turtles (their closest relatives) have been known to detect color (review: Neumeyer, 1998); since the 1950s, the more distantly related tortoises have also been known to do so (Quaranta, 1952). Most turtles, including marine species, have retinas that contain several types of cones (Liebman and Granda, 1971; Bartol and Musick, 2003). Spectral sensitivities of juvenile green
Introduction Color vision is defined as the ability to distinguish between light stimuli on the basis of wavelength, independently of differences in light intensity (Hailman and Jaeger, 1971). Such a capacity is exploited by animals for many functions such as finding food, avoiding predators, orienting toward favorable habitats, reducing conspicuousness (e.g., camouflage), increasing conspicuousness (distasteful or poiReceived 5 January 2012; accepted 7 February 2012. * To whom correspondence should be addressed. E-mail: salmon@ fau.edu 46
47
SEA TURTLE COLOR VISION
turtles (Chelonia mydas; Granda and O’Shea, 1972), hatchling leatherbacks (Dermochelys coriacea), and loggerheads (Caretta caretta; Horch et al., 2008) have been described on the basis of physiological measures. These results indicate a capacity to respond to a broad range of light wavelengths—a range too large to be attributed to a single cone pigment. Horch et al. (2008) proposed that the turtles probably possess at least three cone pigments. Further evidence for the possibility of color vision comes from the presence of oil droplets in the cone cells of marine turtles. In freshwater turtles, these reduce overlap in spectral sensitivity between spectrally adjacent cones and increase the potential for color discrimination (Neumeyer, 1986; Vorobyev, 2003). The green turtle retina contains three types of oil droplets: clear (paired with the 440-nm pigment), yellow (paired with the 502-nm pigment), and orange (paired with the 562-nm pigment; Granda and O’Shea, 1972; also see Ma¨thger et al., 2007). These droplets may sharpen the capability to discriminate wavelengths, but the crucial experiments have not been done. Several studies have described the preferences of turtles for different colors. Most have yielded inconclusive results because discrimination in these studies (such as those done by Ernst and Hamilton, 1969; Heidt and Burbidge, 1966) might have been based on either light intensity or light wavelength cues. Exceptions include studies done by Quaranta (1952) on two species of giant tortoises (Testudo elephantopus vicina; Testudo gigantea), and by Neumeyer and her collaborators (Neumeyer and Ja¨ger, 1985; Arnold and Neumeyer, 1987) on red-eared sliders (Pseudemys scripta elegans). Fehring (1972) did the only behavioral study to determine whether marine turtles (juvenile loggerheads, Caretta caretta) could discriminate between colors. Unfortunately, while he included what might have been adequate controls for stimulus intensity, he failed to describe precisely how these were incorporated into his experimental design. He also used Wratten filters to generate colored stimuli. These produced irregular and often broadly overlapping spectra, so much so that it was impossible to determine if the turtles were making discriminations on the basis of wavelength differences or on intensity differences generated by narrow versus broadband spectral energy distributions. In this study, we used a behavioral response (positive phototaxis) shown by hatchling loggerheads to determine the range of stimulus intensities that could be detected for three light wavelengths by light-adapted turtles. We then trained somewhat older (!1-month-old juvenile) turtles to associate one of these colors with food reward, and then to discriminate between that rewarded color and another (unrewarded) color presented at a perceptually equal quantal intensity. In a final series of experiments, we varied the intensity of the rewarded and unrewarded colors to determine whether the turtles could still select only the rewarded
color. This discrimination was easily learned, indicating a capacity to distinguish between the colors on the basis of light wavelength alone. Materials and Methods Hatchlings: Study site and turtle acquisition Tests with hatchlings were completed during the summer of 2010 using loggerhead turtles (Caretta caretta) acquired from nests deposited on a 4.5-km-long section of beach in Boca Raton (Palm Beach County), Florida, (Lat 26°22!, Long 80°07!). All nests are managed by the Gumbo Limbo Nature Center. Each morning, Center staff use stakes and signage to mark and date nests dug the previous evening. About 52 days after eggs were deposited, we checked each nest during the afternoon to determine if hatchlings were present and likely to emerge. If they were, we removed up to 10 turtles from each nest and placed them on a bed of moist sand inside a light-tight (but not air-tight) cooler. We transported the cooler within 20 min to a non-air-conditioned, windowless room in our laboratory where it was stored until evening. Phototaxis experiments with hatchlings were done each night between 2100 h and midnight because many turtles emerge from their nests during this time window and crawl toward the sea (Witherington et al., 1990). Hatchling experiments The response of hatchlings to three different colored lights was determined by placing them inside a black acrylic plastic Y-maze (10 cm deep, 48 cm long, 16.5 cm wide; arm length, 29.2 cm). Hatchlings were given a choice of crawling horizontally toward an illuminated or a non-illuminated arm. Light stimuli came from Kodak slide projectors (Model 4400; equipped with 150-W halogen lamps) positioned behind each arm. A black acrylic filter chamber (38.5 cm long, 12.7 cm wide; square in cross section) was placed between the projector and a frosted panel at the end of each maze arm where a circular light image, about 6.0 cm in diameter, was projected. We inserted appropriate combinations of 5 " 5-cm-square glass neutral density filters (0.3, 0.5, 1.0, 2.0, and 3.0 log units; Edmund Scientific, Barrington, NJ) and interference filters (blue, 450 nm; green, 500 nm; yellow, 580 nm; half band pass, 5 nm) to control the stimulus. These three wavelengths were chosen because physiological measurements show that loggerheads are most sensitive to light within this range of wavelengths (Horch et al., 2008). In addition, microspectrophotometric measurements showed that three cone pigments in juvenile green turtles absorbed maximally close to those wavelengths (440 nm, 502 nm, and 562 nm; Liebman and Granda, 1971). We used a radiometer (UDT Model 351A, Hawthorne, CA) with its sensor about 2 cm from the illu-
48
M. YOUNG ET AL.
minated circle image to measure stimulus irradiance in microwatts, then converted those measurements to photons per square centimeter per second (photons/cm2/s) at the maximum transmission wavelength for each of the three interference filters. Phototaxis testing procedure Hatchlings locate the ocean from the nest by crawling away from dark, elevated horizons produced by the dune and vegetation behind the beach, and by crawling toward the lower, flatter, and often brighter horizon (positive phototaxis) toward the ocean (Limpus, 1971; Mrosovsky, 1972; Salmon et al., 1992). We used the brightness component of this response to determine the minimum intensity of the blue, green, and yellow light that evoked a positive phototaxis. Experiments were done inside a windowless, dark room that housed the Y-maze. Immediately before testing, we removed up to 10 hatchlings from the cooler where they were stored and placed them in a shallow sink illuminated from above by an 8-W cool-white fluorescent, batterypowered lamp (adapting light intensity [measured with the UDT radiometer]: 260 "W at 5 cm from the source). The turtles were exposed to this light for a minimum of 15 min to bleach the rods. As the turtles became light-adapted, they also began actively crawling inside the sink. Each light-adapted turtle was placed in the start area of the Y-maze and immediately exposed to a circular, coloredlight stimulus projected on the end of one maze arm. The turtle was given 2 min to crawl from the start area into either the illuminated or the dark arm. Each turtle was tested once, using a single wavelength and intensity of light as the stimulus. A crawl into the illuminated arm was scored as a positive (#) response, a crawl into the non-illuminated arm was scored as negative ($), and a failure to crawl into either arm within 2 min was scored as neutral (0). All three wavelengths were initially presented at their brightest intensity. That stimulus induced all of the turtles to crawl into the illuminated arm. In later trials, intensities at each wavelength were reduced at 1.0 log unit steps until the turtles were equally likely to crawl into either the illuminated or the non-illuminated arm. Stimulus intensity was then increased in 0.5 log unit steps until the positive response returned (the up-down “staircase” method for measuring thresholds; Dixon and Mood, 1948; Cornsweet, 1962; Levitt, 1971). For half of the turtles the right arm was illuminated; for the remainder it was the left arm. These procedures were repeated each evening using turtles from a different nest and exposures to different wavelength and intensity combinations. Once sample sizes for mixed responses at a given wavelength and intensity exceeded about 20 turtles, we used a binomial test (Zar, 1999) to determine whether the ratio of positive responses to negative plus neutral responses resulted in a significant preference for the
arm containing the light stimulus. The lowest light intensity at each wavelength that evoked significant attraction was designated as the phototaxis threshold (pt) for that light wavelength. After all of the trials each evening were completed, the turtles were weighed (nearest 0.1 g using an electronic scale), measured (straight-line carapace length [SCL], nearest 0.1 mm using calipers), and then returned to the beach and released. Training juvenile turtles Loggerheads from local nests were reared at Florida Atlantic University’s marine laboratory in Boca Raton. Each turtle was marked with nontoxic nail polish for individual and nest identification. Because groups of juvenile loggerheads in confined spaces become aggressive, turtles were individually isolated in plastic baskets (13.4-cm deep, 19.5-cm long, 17.5-cm wide) that floated at the water surface inside shallow tanks furnished with a continuous flow of filtered seawater. Water temperatures varied between 23 and 30 °C. Overhead lighting was furnished by banks of full-spectrum fluorescent tubes (ZooMed ReptiSun) and set by timers at 12L:12D. Lights were switched off shortly after ambient sunset. Turtles were fed a formulated diet consisting of ground fish (salmon or Tilapia filets) imbedded in gelatin cubes, supplemented with reptile vitamins and minerals. Training began with 15 turtles selected on the basis of a combination of age (minimally, 4 weeks post-emergence), size (! 6.7 cm in SCL), and behavior (consistent feeding vigor, which tended to increase as the turtles grew larger). Training was done each day when the turtles were fully light-adapted, and lasted between 2 and 3 h. Nine turtles that showed the least progress after the first few days of training were excluded, leaving six turtles that completed training. Two turtles were trained to the blue, two to the green, and two to the yellow light stimulus. Apparatus and single-light training Single-light training was used to establish an association between approach to a light stimulus and food reward. Training took place in a larger black acrylic plastic Y-maze (10-cm deep, 76-cm long, arms 13-cm wide; Fig. 1) filled with full-strength seawater to a depth of about 7.5 cm. Water temperatures varied between 23 and 30 °C. Each of the six turtles was placed in the start area (Fig. 1) and allowed to acclimate for 2 min before a clear barrier that separated the start area from the arms was lifted. During the acclimation period, the turtle could observe a 6-cm-diameter circle of blue, green, or yellow light (brightness set at 1 log unit above the hatchling pt for that color) at the end of one arm. The other arm was dark. The same interference and neutral density filters used to present light stimuli to
SEA TURTLE COLOR VISION
49
consecutive days of trials. We used chi-square tests (Zar, 1999) to determine whether the number of trials required to achieve this criterion differed as a function of stimulus wavelength. Paired-light training
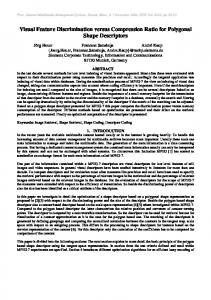
Figure 1. Apparatus used for experiments to determine if juvenile loggerheads can distinguish between colors. In the experiment illustrated here, the turtle is simultaneously presented with two lights differing in color. Each light is generated by a Kodak projector (P). Illumination passes through interference and neutral density filters in each filter light tunnel (LT), resulting in a circular image presented at the end of two Y-maze arms (YMA; 10-cm deep, 42.3-cm long, 14-cm wide). The turtle is restrained in the start area behind a clear barrier (CB) while the light stimuli are presented. The barrier is lifted to allow the turtle to choose between the colors and to receive a food reward if it selects the correct stimulus.
hatchlings were also used to present colors to these older turtles during training. To obtain a food reward, the turtle had to swim to the end of the illuminated arm. Because most of the turtles initially did not leave the start area, this response was behaviorally shaped by gently coaxing the turtle to move down the length of the maze to the end of an arm. If the turtle “chose” the illuminated arm, it received a small piece of raw shrimp as a reward before being returned to the start area for its next trial. If it entered the dark arm, the turtle was gently removed and placed at the end of the illuminated arm where it received a food reward. It was then returned to the start area for the next trial. From the second day of training onward, the arm presenting the illuminated target varied, as dictated by a random-number table. Trials were repeated at intervals of about 1 every 3 min and continued until the turtle reached satiation (generally, after 10 –35 trials). All of the turtles eventually learned to associate movement to the end of the arm with reward. Once they did, they swam rapidly (#10 s) to the end of a maze arm as soon as the clear barrier was removed. Single-light training ended after each turtle selected the illuminated arm 10 times in succession during each of two
Paired-light training with the same six turtles began the day after each turtle completed single-light training. The procedures used were identical to those described above for single-light training except that the turtles (i) were simultaneously presented with two colors, and (ii) immediately swam to the end of the arm as soon as the clear barrier was removed. One was the rewarded color used during singlelight training, while the other color was unrewarded. The color pairings were blue (rewarded) versus green (turtle 1) or yellow (turtle 2); green (rewarded) versus yellow (turtle 3) or blue (turtle 4); and yellow (rewarded) versus blue (turtle 5) or green (turtle 6). Each pair of colors was presented at an intensity 1 log unit brighter than the hatchling pt for that color. A random-number table was used to determine which arm presented the rewarded stimulus during each trial. Trials continued until each turtle chose the rewarded color 10 times in succession each day over 2 days of testing. Completion of training indicated that each turtle could discriminate between the pairs of colors. However, these trials did not reveal whether that discrimination was accomplished by using wavelength, intensity, or some combination of both cues. Wavelength-discrimination training These experiments were designed to eliminate light intensity as a cue that could be used to distinguish between light stimuli. Training began the day after each turtle completed its paired-light training trials. Each turtle was once again required to choose between the same pair of rewarded and unrewarded colors, but under two different testing conditions. In one set of conditions, the rewarded color was held at a constant intensity (1.0 log unit above its pt) while the unrewarded color varied in intensity from one trial to the next so that it was either brighter, dimmer, or equal in intensity to a stimulus 1.0 log unit above its pt. In the other set of conditions, the unrewarded color was held at a constant intensity (1.0 log unit above its pt) and the rewarded color was varied in intensity relative to its pt. Trials were repeated each day under one set of conditions until the turtle made 10 correct color choices in succession. The next day, tests began under the other set of conditions and continued until each turtle once again made 10 correct color choices in succession. Training was completed when each turtle finished all 20 of its correct color choices. Three of the turtles were first exposed to a constant intensity of the rewarded
50
M. YOUNG ET AL. Table 1
The number of hatchlings that crawled into the illuminated arm (#), the dark arm ($), or that failed to crawl (0) during the phototaxis trials Blue Log stimulus intensity No filter 1.0 1.5 2.0 2.5 3.0 3.5
#
Green $/0
#
12 0 10 2 23 2 18* 8 16 9 11 14 5 7 P & 0.04
Yellow $/0
14 1 12 3 12 3 20 6 23** 6 16 9 10 10 P & 0.001
#
$/0
9 2 13 2 18 0 16*** 4 15 1 8 7 8 7 P % 0.006
Data are shown beginning with the brightest light (no ND filter present; blue, 1.63 " 1014 photons/cm2/s, green, 2.87 " 1013 photons/cm2/s and yellow, 5.03 " 1013 photons/cm2/s), and then as intensity was decreased by inserting combinations of neutral density filters differing in optical density. The phototaxis threshold (bold) is the minimum intensity that evoked significant attraction to the light stimulus (at P # 0.05 by a binomial test).
color, while three of the turtles were first exposed to a constant intensity of the unrewarded color. Results Stimulus measurements Stimulus intensity was measured at a distance of 2 cm from the projected image of the light stimulus on the vertical wall at the end of the maze arm (phototaxis experiments). In the absence of neutral density filters, intensities were blue, 1.63 " 1014 photons/cm2/s; green, 2.87 " 1013 photons/cm2/s; and yellow, 5.03 " 1013 photons/cm2/s. Stimulus intensities were not measured in the water-filled maze but were probably similar near the vertical wall of each arm since the same projectors, filter chambers, and filters were used to present all stimuli. Hatchling phototaxis trials We used 401 turtles from 32 nests in these trials. Hatchlings averaged 4.32 cm in straight-line carapace length (SCL) (range: 3.81– 4.79 cm) and 17.61 g in mass (range: 13.48 –22.94 g). Hatchlings were attracted to all of the light stimuli, but the turtles were most sensitive to green and less sensitive to yellow and blue (Table 1). The pt for green was 2.52 " 1011 photons/cm2/s, it was 4.96 " 1011 photons/cm2/s for yellow, and 6.75 " 1012 photons/cm2/s for blue. Single-light training The six juvenile turtles that were trained to completion came from four nests. At the start of training they ranged in
SCL between 6.7 and 10.0 cm, and in mass between 64 and 173 g. All turtles given single-light training learned to orient toward the illuminated arm, but there were differences in the number of trials required before the turtles completed training (Fig. 2A). Two turtles trained to a blue light finished most rapidly (in 3 days after 40 and 73 trials, respectively), whereas turtles trained to green required 91 and 92 trials over 5 and 6 days, respectively. Turtles trained to yellow required 157 and 186 trials (Fig. 2A), over 8 and 7 days, respectively. When we compared these trial numbers to an “expected” average, they differed statistically. Turtles 1, 3, and 5 were trained in 2010; their number of trials to reach completion were 40 (blue), 92 (green), and 186 (yellow). Those values differed from an expected average distribution (106 trials/color; X2 % 52, P % 0.0001, 2 d.f.). Turtles 2, 4, and 6 were trained in 2011; their number of trials (73, 91, 157) also differed from an expected average distribution (107 trials/color; X 2 % 17, P % 0.0001, 2 d.f.). Thus, turtles learned to associate a color with food reward in fewer trials at the shorter wavelengths (blue) than at the longer wavelengths (green, yellow). Pairs of turtles trained to green (91 and 92 trials; X2 % 0.005, n.s.) and to yellow (186 and 157 trials; X2 % 1.07, n.s.; Fig. 2) lights showed no statistical differences in the number of trials required to reach completion. However, the pair of turtles trained to a blue light differed significantly from one another in performance (40 vs. 73 trials; X2 % 4.37, P % 0.04). Paired–light training The color pairings were blue (rewarded) versus green (turtle 1) or yellow (turtle 2); green (rewarded) versus yellow (turtle 3) or blue (turtle 4); and yellow (rewarded) versus blue (turtle 5) or green (turtle 6). The turtles required only a few trials (# 38 trials; Fig. 2B) to complete training to paired lights, which was done in 3 d or less. Two subjects (turtles 5 and 6) completed training in 2 d and discriminated between the rewarded and unrewarded colors without making any errors (during their first 20 paired-light trials). The remaining four turtles completed training in 24 –38 trials (Fig. 2B). There were no statistical differences among the turtles in the number of trials required to complete training, when compared to an expected average (of 27 trials; X2 % 4.25, P % 0.5, 5 d.f.). Wavelength-discrimination training The turtles also completed their two sets of wavelengthdiscrimination trials quickly (#50 trials; Fig. 2C). Training was completed in 2 days by four turtles (turtle 5 in 20 trials, 2 in 22 trials, 6 in 25 trials, and 4 in 29 trials); in 3 days by turtle 1 (33 trials); and in 5 days by turtle 3 (50 trials). The stimulus pairings presented during the final 10 trials for
51
SEA TURTLE COLOR VISION Table 2
First set of final wavelength discrimination trials when for the first time, each turtle correctly selected the rewarded color (bold) 10 times in succession when given a choice between that color and another color presented at a different intensity. Turtle 1
Turtle 2
Turtle 3
Turtle 4
Turtle 5
Turtle 6
B vs. G
B vs. Y
G vs. Y
G vs. B
Y vs. B
Y vs. G
0.5 2.0 0.0 2.0 2.3 2.0 0.3 2.5 0.0 0.5
1.5 1.5 1.5 1.5 1.5 1.5 1.5 1.5 1.5 1.5
1.5 1.0 1.3 2.0 0.5 1.0 0.3 1.5 0.5 0.0
1.5 1.5 1.5 1.5 1.5 1.5 1.5 1.5 1.5 1.5
1.0 1.0 1.0 1.0 1.0 1.0 1.0 1.0 1.0 1.0
0.0 1.5 0.3 1.0 2.0 1.5 0.0 1.0 2.0 0.5
1.0 1.0 1.0 1.0 1.0 1.0 1.0 1.0 1.0 1.0
0.0 0.5 2.0 1.0 1.5 0.0 0.5 1.5 1.0 2.0
0.5 1.3 1.5 1.0 0.3 0.0 1.5 1.0 2.0 0.5
1.0 1.0 1.0 1.0 1.0 1.0 1.0 1.0 1.0 1.0
1.0 1.0 1.0 1.0 1.0 1.0 1.0 1.0 1.0 1.0
0.0 0.5 2.0 1.5 2.5 2.0 0.5 2.5 1.5 1.0
B % blue; G % green; Y % yellow. Numbers in the column indicate the neutral density filter that controlled the intensity of each color during a given trial. For example, during its second trial, Turtle 1 had to choose between a blue light attenuated by 1.0 log unit and a green light attenuated by 1.5 log units. During this set of 10 trials, one color is held at a constant intensity (1.0 log unit brighter than its pt; see Table 1) while the color with which it is paired varies in intensity during successive trials. These conditions are reversed during the second set of trials (shown in Table 3).
each set of wavelength-discrimination trials are shown in Tables 2 and 3. There were no statistical differences among the turtles in the total number of trials required to complete wavelengthdiscrimination training, when compared to an expected average (of 30 trials; X2 % 8.84, P % 0.12, 5 d.f.). Table 3 Second set of final wavelength discrimination trials when for the second time, each turtle correctly selected the rewarded color (bold) 10 times in succession when given a choice between that color and another color presented at a different intensity
Figure 2. The number of trials required to complete training during single-light (A), paired-light (B), and wavelength-discrimination (C) trials. Note the differences in scale between the graphs. Turtles 1 and 2 were rewarded for swimming toward a blue (B) light, turtles 3 and 4 for swimming toward a green (G) light, and turtles 5 and 6 for swimming toward a yellow (Y) light. To complete training, each turtle has to make 10 correct choices in succession each day over 2 days. In the single- and paired-light trials, each light was presented at an intensity 1.0 log unit above the hatchling phototaxis threshold (pt) for that color. In the wavelength-discrimination trials, one light color was presented at a constant intensity (1.0 log unit above the hatchling pt for that color) while the intensity of the other light color was varied. See the text for each turtle’s color pairings (in B and C) and other details.
Turtle 1
Turtle 2
Turtle 3
Turtle 4
Turtle 5
Turtle 6
B vs. G
B vs. Y
G vs. Y
G vs. B
Y vs. B
Y vs. G
1.5 1.5 1.5 1.5 1.5 1.5 1.5 1.5 1.5 1.5
2.5 1.5 0.5 2.0 0.5 1.5 2.5 2.0 1.0 0.0
1.0 1.0 1.0 1.0 1.0 1.0 1.0 1.0 1.0 1.0
2.0 2.3 1.5 0.5 0.3 1.5 1.0 2.5 2.0 0.0
0.0 1.0 0.5 1.5 0.0 1.5 2.0 0.5 1.0 2.0
1.0 1.0 1.0 1.0 1.0 1.0 1.0 1.0 1.0 1.0
0.3 2.0 0.0 2.0 2.3 2.0 0.3 2.5 0.0 0.5
1.0 1.0 1.0 1.0 1.0 1.0 1.0 1.0 1.0 1.0
1.0 1.0 1.0 1.0 1.0 1.0 1.0 1.0 1.0 1.0
1.5 1.3 1.0 0.3 0.5 1.5 1.0 2.0 0.5 0.0
1.5 0.0 2.0 0.5 1.0 0.0 1.0 1.5 2.0 0.5
1.5 1.5 1.5 1.5 1.5 1.5 1.5 1.5 1.5 1.5
Format, as in Table 2 except that in each color pairing the color held at a constant intensity (1.0 log unit above its pt) and the color whose intensity varies during each trial are reversed.
52
M. YOUNG ET AL.
Discussion These experiments demonstrate that juvenile loggerheads can be trained to associate visual targets, presented at equivalent quantal intensities (1 log unit brighter than the phototaxis threshold, or pt, for that color), with food reward (Fig. 2A). However, these data also show that the association is learned more rapidly at the shorter than at the longer wavelengths. We will return to this point later. Once the association between colored targets and food is learned, discrimination between the rewarded color and an unrewarded color (when both are presented at 1 log unit above that color’s pt) is achieved rapidly (#40 trials; Fig. 2B). However, the cue underlying discrimination between the colors is not revealed by these trials. In a final series of wavelength-discrimination training tests, we varied the intensity of one of the two lights during each trial. This procedure rendered intensity cues unreliable for selecting a particular color. Since even under these circumstances each turtle chose its rewarded color (Fig. 2C; Tables 2 and 3), discrimination must have been based upon wavelength. Experimental approach Unfortunately, wavelength discrimination studies done with other turtle species have not always contained adequate controls for stimulus intensity. For example, Heidt and Burbidge (1966) and Ernst and Hamilton (1969) presented light stimuli differing in color at equal intensities, as measured by a light meter. That design assumed that both a turtle eye and a light meter were equally sensitive to each colored target. However, equivalent sensitivity is a feature unique to some (but not all) light meters and is distinctly not characteristic of biological systems. The spectral sensitivity of most animal photoreceptors is shaped by their visual ecology, which in turn selects for sensitivity to those wavelengths important for detecting predators and prey, locating mates, enhancing detection of objects against background, and other functions critical to survival and reproductive success (Hailman and Jaeger, 1971; Bradbury and Vehrencamp, 1998). Thus, animals are likely to be more sensitive to some wavelengths than to others, so that when those wavelengths are paired with others at equal intensity levels, some will be perceived as brighter than others even by an animal incapable of wavelength discrimination. That makes it imperative to design experiments that distinguish between discrimination based upon intensity differences and discrimination based upon wavelength differences. One method used to achieve this goal is to measure each subject’s spectral sensitivity and then present lights differing in wavelength at perceptually equal intensities to that subject. Such an approach was used to determine whether the turtle Pseudemys scripta was capable of wavelength discrimination and if so, how that ability varied across the
entire spectrum of wavelengths that the turtle could detect (Neumeyer and Ja¨ger, 1985; Arnold and Neumeyer, 1987). Another approach, and the one we used, is to vary the intensity of each stimulus presented to the animal so that if discrimination persists, it cannot be explained on the basis of intensity cues. This approach was used in experiments with tortoises done by Quaranta (1952), and in experiments patterned after Quaranta’s approach done by Fehring (1972) with juvenile loggerhead sea turtles. Quaranta used food reward to train tortoises to discriminate between pairs of light stimuli differing in wavelength. After the response was acquired, he varied stimulus intensity of each of the light targets independently over a broad (3.5 log units) range. In the absence of any information on spectral sensitivity, he could not know when his trained turtles saw one color as either brighter or dimmer than the other. But, given the 3.5-log unit range of intensities he presented, coupled with the separate tests in which either the rewarded or unrewarded color was varied in intensity, it is unlikely that a consistent preference for one color could be explained on the basis of any cue other than wavelength. Fehring’s (1972) design was similar to Quaranta’s in that he also varied light intensity over a broad (2.5 log unit) range. However, he did not describe how these critical intensities were paired during the trials, nor could he account for why the turtles were unable to distinguish between some of the colored stimuli he presented. Color vision has been shown to occur in many other animals, beginning with Karl von Frisch’s (1914) classical demonstration using honeybees (Apis mellifera) as subjects. Von Frisch trained the bees to associate a colored card placed under a glass bowl filled with sugar-water with a food reward. Once trained, foraging bees continued to alight on the colored card even when no bowl and no food were present, and even when the card was placed at random locations within an array of 30 similar cards differing in shade from white through grey to black. The assumption was that if bees were colorblind, at least one of the shaded cards would match the achromatic (intensity) signal of the trained color. Since the bees made no errors, they must have used chromatic (color) cues to make their selection. The design of recent studies follows similar principles. For example, color vision in the mantis shrimp Haptosquilla trispinosa was demonstrated by training the shrimp to discriminate between a rewarded color and various shades of grey, even when the rewarded color was presented at intensities that varied compared to its intensity during training (Marshall et al., 1996). Damsel fish (Pomacentrus amboinensis) were trained using food reward to select a colored target, then to continue to make that selection when the target was paired with other targets differing in intensity (Siebeck et al., 2008). These damselfish live in social groups (“harems”), controlled by a dominant male. Males can discriminate between females in their harem and those
SEA TURTLE COLOR VISION
who are strangers, and between their species and another that, to a human observer, looks identical. Discrimination in both instances is based upon individually distinctive patterns of head coloration, expressed as complex UV patterns (Siebeck et al., 2010). The diurnally active hawkmoth (Macroglossum stellatarum) is a nectar-feeder. It can be trained, using food reward, to distinguish among targets either on the basis of differences in wavelength, differences in intensity, or both cues (Kelber, 2005). However, hawkmoths normally make flower discriminations on the basis of color. To discriminate between visual targets, they also require fewer trials using wavelength than using intensity cues. Sensitivity and stimulus “bias” Hatchling loggerhead phototaxis thresholds matched their spectral sensitivities to light as measured electrophysiologically—that is, the turtles were most sensitive to green and somewhat less sensitive to the blue and yellow wavelengths (Horch et al., 2008). Young loggerheads spend 7–12 years at sea before returning to coastal and estuarine habitats where they feed and grow to maturity (Bolten, 2003). The sensitivity of loggerhead hatchlings suggests a match to the downwelling light available in those shallow habitats where older turtles reside, rather than to the blue wavelengths characteristic of oceanic waters where younger turtles reside. The apparent visual adaptation to the adult habitat also suggests that there is not an ontogenetic change in visual pigments. There were obvious differences in how quickly the turtles formed associations between the target colors and food. Turtles were most quickly trained using a blue light stimulus, but training required more trials done over many days when the stimulus was yellow (Fig. 2A). These differences were not obviously related to sensitivity as measured by a phototaxis, as the turtles were more sensitive to yellow light (4.96 " 1011 photons /cm2/s) than they were to a blue light (6.75 " 1012 photons/cm2/s; Table 1). Why, then, was training accomplished more easily using a blue stimulus? One possibility is that the turtles are predisposed to associate objects reflecting the shorter wavelengths with food. That hypothesis receives support because at least some prey that small turtles are known to consume are blue, dark blue, or purple. Young loggerheads during their oceanic stage of development associate with Sargassum mats (Carr, 1987; Bolten, 2003). During this time they feed primarily on prey found within the Sargassum mats, as well as on other organisms that accumulate in convergence zones where these mats form (Richardson and McGillivary, 2001; Witherington, 2002; Boyle and Limpus, 2008). Prey identified from the stomach contents of small loggerheads include crustaceans, hydrozoa, insects, gastropods, and gelatinous zooplankton
53
(Brongersma, 1972; Hughes, 1974; Plotkin et al., 1993; Tomas et al., 2001; Witherington, 2002). A large proportion of these prey are cnidarians (Richardson and McGillivary, 2001; Witherington, 2002; Parker et al., 2005; Boyle and Limpus, 2008), including wind-driven jellyfishes that are primarily blue or violet in color such as the Portuguese man o’ war (Physalia physalis), blue button (Porpita porpita), and by-the wind sailor (Velella velella). Loggerheads also consume pelagic gastropods that display the same colors, such as the common purple snail (Janthina janthina). These prey represent a large component of the loggerhead diet during their oceanic phase of migration (Bjorndal, 1997; Boyle and Limpus, 2008). Blue-to-violet colors are also the most common light wavelengths emitted by bioluminescent marine organisms (Widder, 2010) such as jellyfishes and crustaceans, many of which migrate vertically toward the ocean surface at night and that might serve as prey for older marine turtles that can reach them through shallow dives. Many other animals show color biases that apparently function to promote their survival and reproductive success. Bumblebees (Bombus terrestris; Raine and Chittka, 2007), butterflies (Aglais urticae and Pararge aegeria; Scherer and Kolb, 1987), and hawkmoths (Manduca sexta; Goyret et al., 2008) have an innate preference for flowers of certain color (by coincidence, often blues or violets) that have the highest nectar content and therefore provide the maximum reward. Color biases are also common in mate selection—specifically, female preferences for males bearing certain colors associated with reduced parasitism (Godin and McDonough, 2003), nest attentiveness (Hill, 1991), general health, and genetic quality (Folstad and Karter, 1992). Similar studies have demonstrated color biases in fishes (guppies, Poecilia reticulata; Godin and McDonough, 2003; sticklebacks, Gasterosteus aculeatus; Folstad et al., 1994), birds (finches, Carpodacus mexicanus; Hill, 1990), and macaques (Macaca mulatta; Waitt et al., 2003). Color biases have not yet been conclusively reported for any species of turtle, and virtually nothing is known about how color vision might be advantageous for any chelonian species. One obvious possibility is that color vision might enable land tortoises to discriminate between edible and inedible leaves, or ripened and unripened fruit. A similar function has been proposed to explain the evolution of color vision in the Old World primates (Jacobs and Rowe, 2004). Surprisingly little is known about the role of vision in the behavior of most species of terrestrial and aquatic turtles, primarily because there are so few experimental studies. Vision is used by marine turtle hatchlings to locate the sea from the nest, and is the dominant sense used by juvenile leatherbacks (Constantino and Salmon, 2003) and loggerheads (Southwood et al., 2007) to orient toward prey at close range. Visual cues are also used by experimentally displaced juvenile loggerheads to orient toward home
54
M. YOUNG ET AL.
(Avens and Lohmann, 2003). Similar studies done with experimentally displaced juvenile green turtles suggest that this orientation may be based upon solar cues (Mott and Salmon, 2011). However, we are unaware of any studies that focus on how an ability to discriminate between objects on the basis of color might be used by any species of marine turtle. The present study demonstrates that juvenile loggerheads can learn to associate different colors with food and then to discriminate between those colors. The specific wavelengths used for training (450 nm, 500 nm, and 580 nm) might not exactly match the spectral sensitivity maxima for the three cone pigments that loggerheads are hypothesized to possess (Horch et al., 2008). Nevertheless, the fact that the turtles can be trained to distinguish between blue, green, and yellow light independently of their presentation intensity constitutes strong evidence that loggerheads (and, by implication, probably other marine turtle species) possess color vision. Acknowledgments Morgan Young completed this study in partial fulfillment of the requirements for a Masters of Science degree in the Department of Biological Sciences, Florida Atlantic University (FAU). Project support was provided by the National Save the Sea Turtle Foundation, the Nelligan Sea Turtle Fund, and by personal funds. Tamara Frank and Jeanette Wyneken served on the thesis committee and provided excellent advice and guidance. Mark Royer’s assistance in the design and construction of the two Y-mazes, filter chambers, and filter holders was invaluable. The turtles used in this study came from nests monitored and protected by the marine turtle Specialist Staff at the Gumbo Limbo Nature Center. Alexandra Kogan and Justin Vining assisted in the experiments, and T. Warraich, L. Bachler, A. Lolaver, A. Loson, Z. Anderson, M. Rogers, B. Resnick, I. Pokotylyuk, and M. Glider helped with turtle husbandry. Permits to complete this study were issued by the Florida Fish and Wildlife Conservation Commission (TP 173) and the FAU Institutional Animal Care and Use Committee (A10-12). Literature Cited Arnold, K., and C. Neumeyer. 1987. Wavelength discrimination in the turtle Pseudemys scripta elegans. Vision Res. 27: 1501–1511. Avens, L., and K. J. Lohmann. 2003. Use of multiple orientation cues by juvenile loggerhead sea turtles (Caretta caretta). J. Exp. Biol. 206: 4317– 4325. Bartol, S. M., and J. A. Musick. 2003. Sensory biology of sea turtles. Pp. 79 –102 in The Biology of Sea Turtles, Vol. 2, P. L. Lutz, J. A. Musick, and J. Wyneken, eds. CRC Press, Boca Raton, FL. Birgersson, B., U. Alm, and B. Forkman. 2001. Colour vision in fallow deer: a behavioural study. Anim. Behav. 61: 367–371. Bjorndal, K. A. 1997. Foraging ecology and nutrition of sea turtles. Pp. 199 –231 in The Biology of Sea Turtles, Vol. 1, P. L. Lutz and J. A. Musick, eds. CRC Press, Boca Raton, FL.
Bolten, A. B. 2003. Variation in sea turtle life history patterns: neritic vs oceanic developmental stages. Pp. 243–257 in The Biology of Sea Turtles, Vol. 2, P. L. Lutz, J. A. Musick, and J. Wyneken, eds. CRC Press, Boca Raton, FL. Boyle, M. C., and C. J. Limpus. 2008. The stomach contents of post-hatchling green and loggerhead sea turtles in the southwest Pacific: an insight into habitat association. Mar. Biol. 155: 233–241. Bradbury, J. W., and S. L. Vehrencamp. 1998. Principles of Animal Communication. Sinauer Associates, Sunderland, MA. Brongersma, L. D. 1972. European Atlantic turtles. Zool. Verh. (Leiden) 121: 1–318. Carr, A. 1987. New perspectives on the pelagic stage of sea turtle development. Conserv. Biol. 1: 103–121. Constantino, M. A., and M. Salmon. 2003. Role of chemical and visual cues in prey recognition by leatherback posthatchlngs (Dermochelys coriacea L). Zoology 106: 173–181. Cornsweet, T. N. 1962. The staircase method in psychophysics. Am. J. Psychol. 75: 485– 491. Cronin, T. 2007. Evolution of color vision and visual pigments in invertebrates. Pp. 361–365 in Evolution of Nervous Systems, J. H. Kaas, G. F. Striedter, T. H. Bullock, T. M. Preuss, J. Rubenstein, and L.A. Krubitzer, eds. Elsevier Academic Press, Amsterdam. Dixon, J. W., and A. M. Mood. 1948. A method for obtaining and analyzing sensitivity data. J. Am. Stat. Assoc. 43: 109 –126. Ernst, C., and H. Hamilton. 1969. Color preferences of some North American turtles. J. Herpetol. 3: 176 –180. Fehring, W. K. 1972. Hue discrimination in hatchling loggerhead turtles (Caretta caretta caretta). Anim. Behav. 20: 632– 637. Folstad, I., and A. J. Karter. 1992. Parasites, bright males, and the immunocompetence handicap. Am. Nat. 139: 603– 622. Folstad, I., A. M. Hope, A. Karter, and A. Skorping. 1994. Sexually selected color in male sticklebacks—a signal of both parasite exposure and parasite resistance. Oikos 69: 511–515. Frisch, von K. 1914. Der Farbensinn und Formensinn der Biene. Zool. Jahrb. Abt. Allg. Zool. Physiol. Tiere 35: 1–188. Godin, J. G. J., and H. E. McDonough. 2003. Predator preference for brightly colored males in the guppy: a viability cost for a sexually selected trait. Behav. Ecol. 14: 194 –200. Goyret, J., M. Pfaff, R. A. Raguso, and A. Kelber. 2008. Why do Manduca sexta feed from white flowers? Innate and learnt colour preferences in a hawkmoth. Naturwissenschaften 95: 569 –576. Granda, A. M., and P. J. O’Shea. 1972. Spectral sensitivity of the green turtle (Chelonia mydas mydas) determined by electrical responses to heterochromatic light. Brain Behav. Evol. 5: 143–154. Hailman, J. P., and R. G. Jaeger. 1971. On criteria for color preferences in turtles. J. Herpetol. 5: 83– 85. Heidt, G. A., and R. G. Burbidge. 1966. Some aspects of color preference, substrate preference, and learning in hatchling Chrysemys picta. Herpetologica 22: 288 –292. Hill, G. E. 1990. Female house finches prefer colorful males: sexual selection for a condition dependent trait. Anim. Behav. 40: 563–572. Hill, G. E. 1991. Plumage color is a sexually selected indicator of male quality. Nature 50: 337–339. Horch, K. W., J. P. Gocke, M. Salmon, and R. B. Forward. 2008. Visual spectral sensitivity of hatchling loggerhead (Caretta caretta L.) and leatherback (Dermochelys coriacea L.) sea turtles, as determined by single-flash electroretinography. Mar. Freshw. Behav. Physiol. 41: 79 –91. Hughes, G. R. 1974. The sea turtles of south-east Africa. II. The biology of the Tongaland loggerhead turtle Caretta caretta L. with comments on the leatherback turtle Dermochelys coriacea L. and the green turtle Chelonia mydas L. in the study region. Oceanogr. Res. Inst. Investig. Rep. 36: 1– 48.
SEA TURTLE COLOR VISION Jacobs, G. H., and M. P. Rowe. 2004. Evolution of vertebrate colour vision. Clin. Exp. Opt. 87: 206 –216. Kelber, A. 2005. Alternative use of chromatic and achromatic cues in a hawkmoth. Proc. R. Soc. Lond. B Biol. Sci. 272: 2143–2147. Kelber, A., M. Vorobyev, and D. Osorio. 2003. Animal colour vision— behavioural tests and physiological concepts. Biol. Rev. Camb. Philos. Soc. 78: 81–118. Levitt, H. 1971. Transformed up-down methods in psychoacoustics. J. Acoust. Soc. Am. 49: 467– 476. Liebman, P. A., and A. M. Granda. 1971. Microspectrophotometric measurements of visual pigments in two species of turtle, Pseudemys scripta and Chelonia mydas. Vision Res. 11: 105–114. Limpus, C. 1971. Sea turtle ocean finding behaviour. Search 2: 385– 387. Marshall, N. J., J. P. Jones, and T. W. Cronin. 1996. Behavioural evidence for color vision in stomatopod crustaceans. J. Comp. Physiol. A 179: 473– 481. Ma¨thger, L. M., L. Litherland, and K. A. Fritsches. 2007. An anatomical study of the visual capacities of the green turtle, Chelonia mydas. Copeia 2007: 169 –179. Mott, C. M., and M. Salmon. 2011. Sun compass orientation by juvenile green sea turtles (Chelonia mydas). Chelonian Conserv. Biol. 10: 73– 81. Mrosovsky, N. 1972. The water-finding ability of sea turtles. Behavioral studies and physiological speculations. Brain Behav. Evol. 5: 202–225. Mrosovsky, N., and A. Carr. 1967. Preference for light of short wave lengths in hatchling green sea turtles, Chelonia mydas, tested on their natural nesting beaches. Behaviour 28: 217–231. Mrosovsky, N., and S. J. Shettleworth. 1968. Wavelength preferences and brightness cues in the water finding behavior of sea turtles. Behaviour 32: 211–257. Neumeyer, C. 1986. Wavelength discrimination in the goldfish. J. Comp, Physiol. A 158: 203–213. Neumeyer, C. 1998. Color vision in lower vertebrates. Pp. 149 –162 in Color Vision: Perspectives from Different Disciplines, W. Backhaus, R. Kliegl, and J. S. Werner, eds. Walter de Gruyer, Berlin. Neumeyer, C., and J. Ja¨ger. 1985. Spectral sensitivity of the freshwater turtle Pseudomys scripta elegans: evidence for the filter effect of colored oil droplets. Vision Res. 25: 833– 838. Parker, D. M., W. J. Cooke, and G. H. Balazs. 2005. Diet of oceanic loggerhead sea turtles (Caretta caretta) in the central North Pacific. Fish. Bull. 103: 142–152. Plotkin, P. T., M. K. Wicksten, and A. F. Amos. 1993. Feeding ecology of the loggerhead sea turtle Caretta caretta in the Northwestern Gulf of Mexico. Mar. Biol. 115: 1–5. Quaranta, J. V. 1952. An experimental study of the colour vision of the giant tortoise. Zoologica 37: 295–311. Raine, N. E., and L. Chittka. 2007. The adaptive significance of sensory bias in a foraging context: floral colour preferences in the bumblebee Bombus terrestris. PLoS One 2: 556 –563.
55
Richardson, J. I., and P. McGillivary. 2001. Post-hatchling loggerhead turtles eat insects in Sargassum community. Mar. Turtle Newsl. 55: 2–5. Salmon, M., J. Wyneken, E. Fritz, and M. Lucas. 1992. Seafinding by hatchling sea turtles: role of brightness, silhouette and beach slope as orientation cues. Behaviour 122: 56 –77. Scherer, C., and G. Kolb. 1987. The influence of color stimuli on visually controlled behavior in Aglais urticae L. and Pararge aegeria L. (Lepidoptera). J. Comp. Physiol. A 161: 891– 898. Siddiqi, A., T. W. Cronin, E. R. Loew, M. Vorobyev, and K. Summers. 2004. Interspecific and intraspecific views of color signals in the strawberry poison frog Dendrobates pumilio. J. Exp. Biol. 207: 2471– 2485. Siebeck, U. E., G. M. Wallis, and L. Litherland. 2008. Colour vision in coral reef fish. J. Exp. Biol. 211: 354 –360. Siebeck, U. E., A. N. Parker, D. Sprenger, L. M. Ma¨thger, and G. M. Wallis. 2010. UV patterns for covert face recognition. Curr. Biol. 20: 407– 410. Southwood, A., B. Higgins, R. Brill, and Y. Swimmer. 2007. Chemoreception in loggerhead sea turtles: an assessment of the feasibility of using chemical deterrents to prevent sea turtle interactions with longline fishing gear. NOAA Tech. Memo., NOAA-TM-NMFS-PIFSC10, Pacific Islands Fisheries Science Center, Honolulu. 25 pp. Tomas, J., F. J. Aznar, and J. A. Raga. 2001. Feeding ecology of the loggerhead turtle Caretta caretta in the western Mediterranean. J. Zool. 255: 525–532. Vorobyev, M. 2003. Coloured oil droplets enhance colour discrimination. Proc. R. Soc. Lond. B Biol. Sci. 270: 1255–1261. Waitt, C., A. C. Little, S. Wolfensohn, P. Honess, A. P. Brown, H. M. Buchanan-Smith, and D. I. Perrett. 2003. Evidence from rhesus macaques suggests that male coloration plays a role in female primate mate choice. Proc. R. Soc. Lond. B Biol. Sci. 270: 144 –146. Widder, E. A. 2010. Bioluminescence in the ocean: origins of biological, chemical and ecological diversity. Science 328: 704 –708. Witherington, B. E. 2002. Ecology of neonate loggerhead turtles inhabiting lines of downwelling near a Gulf Stream front. Mar. Biol. 140: 843– 853. Witherington, B. E., and K. A. Bjorndal. 1991a. Influences of artificial lighting on the seaward orientation of hatchling loggerhead turtles “Caretta caretta”. Biol. Conserv. 55: 139 –149. Witherington, B. E., and K. A. Bjorndal. 1991b. Influences of wavelength and intensity on hatchling sea turtle phototaxis: implications for sea-finding behavior. Copeia 1991: 1060 –1069. Witherington, B. E., K. A. Bjorndal, and C. M. McCabe. 1990. Temporal pattern of nocturnal emergence of loggerhead turtle hatchlings from natural nests. Copeia 1990: 1165–1168. Zar, J. H. 1999. Biostatistical Analysis. Prentice Hall, Englewood Cliffs, NJ.