Proceedings of the 4th International Modelica Conference, Hamburg, March 7-8, 2005, Gerhard Schmitz (editor)
P. Harman Ricardo UK Ltd. Visualisation of Model Transformation Algorithms for a Modelica Translator pp. 155-158
Paper presented at the 4th International Modelica Conference, March 7-8, 2005, Hamburg University of Technology, Hamburg-Harburg, Germany, organized by The Modelica Association and the Department of Thermodynamics, Hamburg University of Technology All papers of this conference can be downloaded from http://www.Modelica.org/events/Conference2005/ Program Committee • Prof. Gerhard Schmitz, Hamburg University of Technology, Germany (Program chair). • Prof. Bernhard Bachmann, University of Applied Sciences Bielefeld, Germany. • Dr. Francesco Casella, Politecnico di Milano, Italy. • Dr. Hilding Elmqvist, Dynasim AB, Sweden. • Prof. Peter Fritzson, University of Linkping, Sweden • Prof. Martin Otter, DLR, Germany • Dr. Michael Tiller, Ford Motor Company, USA • Dr. Hubertus Tummescheit, Scynamics HB, Sweden Local Organization: Gerhard Schmitz, Katrin Pr¨olß, Wilson Casas, Henning Knigge, Jens Vasel, Stefan Wischhusen, TuTech Innovation GmbH
Visualisation of Model Transformation Algorithms for a Modelica Translator
Visualisation of Model Transformation Algorithms for a Modelica Translator Peter Harman, Ricardo UK Ltd.,
[email protected]
Abstract A software component has been developed to visualise the bipartite graph representing the model structure of a Modelica model. The visualisation is a window on the underlying graph, and thereforethe graph transformations appear animated. This work forms part of research being carried out into improved strategies for simulation of highly discontinuous systems. The primary use is to allow the structure of an equation system to be studied with the aim of categorising the equations according to the type of discontinuity.
representing each equation or unknown, and edges to show relationships between them. The tool described here extends this concept to include the hybrid features of a Modelica model, adding vertices to represent conditional expressions and edges to relate these to variables and equations. All variables, including constants, parameters, discrete and continuous states and derivatives, are represented as vertices. This allows all actions to be taken, such as the evaluation of constants, to be represented as transformations of the underlying graph. Edges in the graph can be undirected or directed. Undirected edges relate a variable with an equation, where the variable can be either on the left-hand-side or the right-hand-side of the equation. Directed edges are used to show a variable that is required by, or is the result of, an algorithm, a function-call or a conditional expression.
This tool has other applications such as debugging or clustering tools. Different layouts and animation methods have been used to maximise the clarity of the visualisation, however large models produce graphs which are too large to view.
2 Visualisation of a Model 1 Introduction
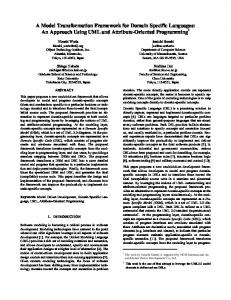
Figure 1 shows the model Modelica.Mechanics.Rotational.Examp les.CoupledClutches in Dymola.
The Modelica specification [1] and existing Modelica tools such as Dymola [2] and OpenSourceModelica [3], make use of graphtheoretical model transformations. The mixture of differential equations and constraint equations lead to a Differential-Algebraic-Equation (DAE) system of unknown index. Current model transformations [4] have the following objectives: • Exploit the sparsity of the system of equations and sort the equations into small systems of linear or non-linear equations, this is done in current tools using the Tarjan algorithm [5] • Ensure the system is of DAE-index 0 or 1, which can be solved by a standard solver, this is done in current tools using the Pantelides algorithm [6,7] • Aim to reduce the size of any systems of linear or non-linear equations by use of tearing [8] or relaxing [9] Central to the model transformation algorithms is the concept of representing the system of equations and unknowns as a bipartite graph, with vertices The Modelica Association
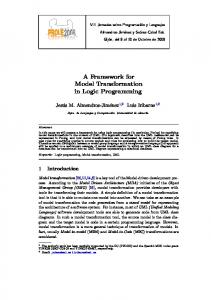
Figure 1: CoupledClutches model schematic The system of variables, equations and conditional expressions is shown in Figure 2. This seemingly small model has 100 equations and hence the graph is large. In the left-hand column each vertex represents a variable, with the colour representing the variability of the variable. Constants are shown magenta, Parameters blue and time-varying variables are red. In the middle column each vertex represents an equation. In the right-hand column each vertex represents a condition expression, such as time < sin2.startTime. The vertices are joined by edges, those with arrows are directed edges with the arrow showing the direction.
155
Modelica 2005, March 7-8, 2005
P. Harman
conditional expressions and the variables on which the conditions depend. This allows the categorisation of discontinuities into Local and Global. Local discontinuities affect only a small part of the system when they occur, whereas Global discontinuities affect the entire system. This categorisation is performed by calculating a measure of the size of the system that is directly connected to the variable in which the discontinuity occurs, i.e. the number of equations and conditional expressions which depend on the variable. Further categorisation is performed determining whether the discontinuity occurs to a state variable or one of it’s derivatives.
Figure 2: CoupledClutches model equation system
4 Other Applications Although this tool has been developed to study the relationships between discontinuous equations and the variables on which they depend, there are other applications during the translation process for which visualisation of the equation structure would be advantageous. 4.1 Model Debugging Figure 3: Zoomed-in view of Figure 2
3 Categorisation of Discontinuous Equations The main application of this work is the development of improved strategies for simulating highly discontinuous systems. It has been shown [4] that an efficient method of simulating a hybrid system is to use a multi-step DAE solver for the smooth continuous parts of the simulation, and to stop and restart the simulation at each discontinuity or event. However, for large highly discontinuous models this is not necessarily efficient. A concept developed is that of event-density, the frequency at which discontinuities occur in the model. Eventdensity rises exponentially with the size of the model. As the time between discontinuities reduces towards the time-step of the simulation, the simulation performance is seriously compromised. Strategies are being developed to allow the simulation to handle events differently depending on the source and type of event. To achieve this aim discontinuous equations must firstly be categorised. Visualisation of the structure of the system is being used to study interconnection between equations, The Modelica Association
Recent work into debugging for equation-based modelling systems [10] has made use of visualisations of graphs to show which part of the model is over or under constrained. A visualisation tool such as this could be used as part of an interactive debugging tool. Many models are too large to visualise in this manner, however a subsection of the model can be shown. 4.2 Assessment of Model Transformation Algorithm Efficiency By visualising the graph, aspects of a particular model can be shown, such as algebraic loops. Figure 4 shows a visualisation of a small model with a clearly identifiable algebraic loop. In this visualisation, the dark vertices represent equations and the light coloured vertices represent variables. The efficiency of tearing algorithms can be interpreted from the resulting visualisation, as the loop becomes a 'tree' with branches, each branch representing a system of equations to be solved numerically. This is analogous to the sizes of blocks shown in a sparsity plot of the model Jacobian. The effect of the technique of ‘inline integration’ [11] on the model structure can also be visualised. This technique inserts equations for integration
156
Modelica 2005, March 7-8, 2005
Visualisation of Model Transformation Algorithms for a Modelica Translator
algorithms into the equation set before the equations are sorted.
virtual connection graph and the resulting spanning trees would allow the user to identify and correct the source of any problem, such as altering the priority of potential root nodes to control which are selected during translation.
5 ModeliCode This visualisation tool forms part of an objectoriented framework created for the development of a Modelica to simulation code translator, called ModeliCode. This is written in Java [14]. The graph manipulation and visualisation package uses the Java Universal Network and Graph (JUNG) library [15]. ModeliCode also includes a symbolic computation library to rearrange and differentiate equations, developed using JScheme [16], which allows the mixing of Scheme code and Java classes. A flexible template-based code-generator is included which allows code to be output in a number of languages.
Figure 4: Small model with algebraic loop 4.3 Clustering
Currently ModeliCode only translates from flattened models. These can be read from .mof files output from Dymola, or can be read via a Corba interface with the OpenModelica Modeq program.
Clustering algorithms have been used [12] to divide the Modelica model up into subsystems which can be executed on separate processors in a cluster. This is done after the model equations have been sorted, and requires analysis of the graph to select the subsystems.
6 Development Issues 6.1 Layout
An interactive visualization tool could be used at this stage, allowing the user to influence the output by selecting the edges which become points of communication between the processors in the cluster. 4.4 Visualisation of Virtual Connection Graph for Debugging Overdetermined Systems The technique for translating overdetermined DAE’s used by the Modelica MultiBody library, introduced in [13], makes use of a Virtual Connection Graph. Each overdetermined type in the model is a vertex in the graph. This vertex can be a root of a spanning tree, a potential root which the system will decide whether it is a root or not, or an ordinary node. There are two types of edge in the graph, breakable or non-breakable, which are defined by connect or Connections.branch statements. The translator aims to break the virtual connection graph into spanning trees each with one root. This may not be possible, due to the number of root vertices or non-breakable edges. Visualisation of the The Modelica Association
The layout defines the locations of each vertex. JUNG provides a number of classes for defining the layout. Initial studies used a class called SpringLayout, which is analogous to having a spring acting between each vertex. Figure 4 was generated using this layout, showing how it is very good at illustrating an algebraic loop for a very small model. However, as the model size increases this layout makes the graph very hard to read. A new layout class was written to place the vertices in columns according to the object they represent. This matches graphs shown in similar work [10]. 6.2 Animation Clarity is improved by animating the graph. As vertices are removed, such as during the evaluation of constants and parameters, or the removal of alias equations, the vertices in the same column are moved up to fill their spaces. As equations and variables are sorted, the vertices are moved into their new order.
157
Modelica 2005, March 7-8, 2005
P. Harman
7 Conclusions By visualizing the model in this way, understanding can be gained of the internal structure of the model. This understanding can be used to develop model transformation algorithms and assess their efficiency, to find errors within the model, or to apply specialized algorithms such as clustering. A relatively small model can produce graphs that are very large and difficult to read, therefore simple layouts and features such as animation must be used in the viewer to improve clarity.
8 Acknowledgements Thanks to Professor Seamus Garvey and Dr Atanas Popov at Nottingham University for supervising this project, and to Michael Tiller at Ford Motor Company; Peter Bunus, Kaj Nyström, Håkan Lundvall and Peter Aronsson at Linköping University for useful discussions. In memory of Dr Pete Lockett, Coventry University.
9. Otter M., Elmqvist H., and Cellier F.E. (1996), “Relaxing - A Symbolic Sparse Matrix Method Exploiting the Model Structure in Generating Efficient Simulation Code”, Keynote Address, CESA’96 IMACS Multiconference, Symposium on Modelling, Analysis and Simulation 10. Bunus P, (2002), “Debugging and Structural Analysis of Declarative Equation-Based Languages” (Licenciate thesis), Department of Computer and Information Science, Linköping University 11. Elmqvist H., Otter M., and Cellier F.E. (1995), “Inline Integration: A New Mixed Symbolic/Numeric Approach for Solving Differential-Algebraic Equation Systems”, Keynote Address, Proceedings ESM'95, European Simulation Multiconference 12. Aronsson P., Fritzson P., (2002), “Multiprocessor Scheduling of Simulation Code from Modelica Models”, Proceedings Modelica 2002 13. Otter M., Elmqvist H., Mattsson S.E., (2003), ”The New Modelica MultiBody Library”, Proceedings Modelica 2003 14. JUNG, http://jung.sf.net 15. Java, http://java.sun.com 16. JScheme, http://jscheme.sf.net
References 1. Modelica specification, http://www.modelica.org/documents/ModelicaS pec21.pdf 2. Dynasim Dymola, http://www.dynasim.se 3. Fritzson P., Aronsson P., Bunus P., Engelson V., Saldamli L., Johansson H., Karström A., (2002), “The Open Source Modelica Project”, Proceedings Modelica 2002 4. Mattsson SE, Otter M, Elmqvist H, (1999), “Modelica Hybrid Modelling and Efficient Simulation”, 38th IEEE Conference on Decision and Control 5. Duff I.S., Erismann A.M., and Reid J.K. (1986), “Direct Methods for Sparse Matrices”, Oxford Science Publications 6. Cellier F.E., and Elmqvist H. (1993), ”Automated formula manipulation supports object-oriented continuous-system modelling”, IEEE Control System Magazine, 13(2) 7. Mattsson S.E., and Söderlind G. (1993), “Index Reduction in Differential-Algebraic Equations Using Dummy Derivatives”, SIAM Journal on Scientific Computing. Vol. 14 8. Elmqvist H., and Otter M. (1994), “Methods for Tearing Systems of Equations in ObjectOriented Modelling”, Proceedings ESM'94 European Simulation Multiconference The Modelica Association
158
Modelica 2005, March 7-8, 2005