SMTP. The objective of both experiments is to investigate whether .... Detection and Network Monitoring, pages 51â62, Santa Clara, USA, April 1999.
Visualization of anomaly detection using prediction sensitivity Pavel Laskov1 , Konrad Rieck1 , Christin Sch¨afer1 and Klaus-Robert M¨uller1,2 1
Fraunhofer-FIRST.IDA Kekul´estr. 7 12489 Berlin, Germany
2
University of Potsdam Am Neuen Palais 10 14469 Potsdam, Germany
{laskov,rieck,christin,klaus}@first.fhg.de
Abstract: Visualization of learning-based intrusion detection methods is a challenging problem. In this paper we propose a novel method for visualization of anomaly detection and feature selection, based on prediction sensitivity. The method allows an expert to discover informative features for separation of normal and attack instances. Experiments performed on the KDD Cup dataset show that explanations provided by prediction sensitivity reveal the nature of attacks. Application of prediction sensitivity for feature selection yields a major improvement of detection accuracy.
1 Introduction Transparency is an essential requirement for intrusion detection algorithms to be used in practice. It does not suffice that an algorithm tells – perhaps with a degree of uncertainty – if some attack (or a specific attack) is present; an algorithm must be able to provide a credible evidence to its prediction. While such evidence is easy to produce for rule-based detection methods, whose rules are understandable to an expert, such credibility cannot be claimed by many approaches using learning-based methods, such as Neural Networks or Support Vector Machines [GSS99, MJS02]. The situation is somewhat better for misuse detection methods, for which several feature selection techniques are available, e.g. [WMC+ 01, GE03]. The problem is much graver for anomaly detection methods, for which almost no practical feature selection techniques are known to date. In this contribution we propose a technique that enables one to visualize predictions of the quarter-sphere SVM, an anomaly detection technique proposed in [LSK04, LSKM04]. The technique is based on the notion of prediction sensitivity which measures the degree to which prediction is affected by adding weight to a particular feature. Using this technique we were able to gain interesting information about the predictions made by the quartersphere SVM on the KDD Cup dataset. The information we obtained is comparable but not identical to rules inferred by RIPPER, a classical rule-based method [Coh95].
By averaging prediction sensitivity over several datasets one can select the features that are most important for anomaly detection. In our experiments on the KDD Cup dataset we have observed that reducing the set of features to the ones suggested by prediction sensitivity remarkably improves the accuracy of detection by the quarter-sphere SVM.
2 Approach: analysis of prediction sensitivity The notion of prediction sensitivity expresses the degree to which prediction is affected by adding weight to individual features. Mathematically this can be described by the Jacobian matrix of the prediction function with respect to the input features. The derivation of the expression for this Jacobian matrix – which depends on a particular anomaly detection method, in our case, the quarter-sphere SVM – is rather technical, therefore, due to space limitations, only the main idea is presented in this section. The mathematical details will be subject of a forthcoming publication. Let X be a d×l data matrix containing d features collected over l observations. We assume that an anomaly detection algorithm assigns the anomaly score s(xi ) to every data point xi ∈ X (a column in the data matrix). The l × d Jacobian matrix is defined as the partial derivatives of s with respect to the components of xi : J(ik) =
∂s(xi ) , ∂xk
1 ≤ i ≤ l,
1 ≤ k ≤ d.
(1)
For the sake of more intuitive visualization we will always consider the transposed Jacobian matrix J T whose dimensions are identical to those of the initial matrix X. Thus, each column of the (transposed) Jacobian matrix can be seen as the sensitivity of the prediction s(xi ) of the algorithm on the data point xi with respect to the k-th feature of the data. The definition of s(xi ) for the quarter-sphere SVM used in this paper is given in Eq. (4) in Sec. 3. Further information can be gained by considering statistical properties of prediction sensitivity. To perform such analysis, randomly drawn data samples X1 , . . . , XN are collected, in which the percentage of attacks is fixed. Once the data samples are collected, one computes the mean and the standard deviation of the respective Jacobian matrices over N samples. Based on this information, heuristic criteria can be defined (cf. Sec. 5) for selecting informative features for separating attacks and normal patterns.
3 Application: anomaly detection using quarter-sphere SVM The quarter-sphere SVM [LSK04, LSKM04] is an anomaly detection technique based on the idea of fitting a sphere onto the center of mass of data. Once the center of the sphere is fixed, the distance of points from the center defines the anomaly score. Choosing a threshold for the attack scores determines the radius of the sphere encompassing the normal data points.
This geometric model can be extended for non-linear surfaces. We first apply some nonlinear mapping Φ to the original features. Then, for each data point, the distance from the center of mass in the transformed space – which is our score function – is computed as: Pl s(xi ) = ||Φ(xi ) − 1l j=1 Φ(xj )||. (2) It remains to be shown how the score function (2) can be obtained without explicitly computing the mapping Φ, since the latter can map the data into a high- or even infinitedimensional space. It is well known in the machine learning literature (e.g. [MMR+ 01, SS02]), that, under some technical assumptions, inner products between images of data points under a nonlinear transformation can be computed by an appropriate kernel function: k(xi , xj ) = Φ(xi )T Φ(xj ). For many interesting transformation the kernel function is known in advance and is easy to compute. For example, for the space of radial-basis functions (RBF) the kernel function is computed as k(xi , xj ) = e−
||xi −xj ||2 2γ
.
To compute the score function s(xi ) using the kernel function, the following steps are needed: 1. Form the l × l kernel matrix K whose entries are the values of the kernel function k(xi , xj ) for all pairs of data points i and j. 2. Compute the centered kernel matrix [SSM98, SMB+ 99]: ˜ = K − 1l K − K1l + 1l K1l , K
(3)
where 1l is an l × l matrix with all values equal to 1l . 3. The score function is given by the entries on the main diagonal of the centered kernel matrix: q ˜ (ii) . s(xi ) = K (4)
4 Experimental setup Before presenting the operation of our visualization technique a few remarks need to be made on data preprocessing. In our experiments we use the KDD Cup 1999 dataset [SWL+ 99], a standard dataset for the evaluation of data mining techniques. The set comprises a fixed set of connection-based features computed from the DARPA 1998 IDS evaluation [LCF+ 99] and contains 4898430 records of which 3925650 are attacks. A list of all features is provided in [LS01, LSKM04]. In-depth description of some features, e.g. the hot feature, is available in the Bro IDS documentation [Pax98, Pax04].
The distribution of attacks in the KDD Cup dataset is extremely unbalanced. Some attacks are represented with only a few examples, e.g. the phf and ftp write attacks, whereas the smurf and neptune attacks cover millions of records. In general, the distribution of attacks is dominated by probes and denial-of-service attacks; the most interesting – and dangerous – attacks, such as compromises, are grossly under-represented. In order to cope with the unbalanced attack distribution and to investigate the characteristic features of particular attacks, we construct separate datasets containing a fixed attack ratio of 5%. The desired ratio is achieved by combining two randomly drawn sub-samples. The first sub-sample is drawn from the attacks in question. If an attack is under-represented, i.e. there are too few samples to carry random sampling, all attack examples are drawn. The second sub-sample is drawn randomly from normal data matching the services used in the chosen attack. The number of examples in both sub-samples is chosen so as to attain the desired attack ratio. In order to analyze the statistical properties of prediction sensitivity, as indicated in Sec. 2, 10 datasets of 1000 data points are generated for each attack. If the number of available attacks in the data is smaller than 50 (required to have 5% of attacks in datasets of size 1000), we reduce the dataset size to L < 1000, sufficient to accommodate all available attacks, and increase the number of generated datasets by the factor of 1000/L. After the sub-sampled datasets are generated, a data-dependent normalization [EAP + 02] is computed, a quarter-sphere SVM is applied to each dataset and the corresponding Jacobian matrices (cf. Eq. (1)) are calculated.
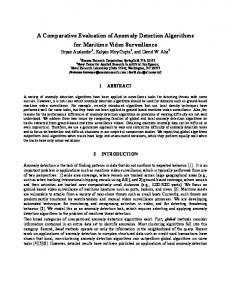
5 Interpretation of anomaly detection on the KDD Cup dataset The proposed prediction sensitivity criterion can be visualized by plotting the Jacobian matrix. If multiple training sets are available the mean and the standard deviation Jacobian matrices are plotted. The rows of the matrices correspond to features and the columns correspond to normal and attack instances. An example of such visualization for the land attack is shown in Fig. 1. The following observations can be inferred from the prediction sensitivity matrices: – Random sampling and averaging of prediction sensitivities emphasize the salient features of the data. As a result, instances corresponding to a particular attack are characterized by consistent regions in the mean Jacobian matrix, whereas the much more heterogeneous normal data exhibits random sensitivity. – The consistency of prediction sensitivity for attack instances can be quantified by the standard deviation Jacobian matrix. Salient features exhibit low standard deviation. Thus one can suggest the following heuristic criterion for feature selection: for attack instances, features must have high values in the mean and low values in the standard deviation Jacobian matrix.
Mean Jacobian matrix for the "land" attack
Feature number
Normal data
Attacks
10
25
20
20 15
30
10
40
5
50 230
250
270 290 310 330 350 370 Connections sorted by anomaly score (#210−420)
390
410
Standard deviation Jacobian matrix for the "land" attack Normal data
Attacks
10 Feature number
30
0
100 80
20
60
30
40
40
20
50 230
250
270 290 310 330 350 370 Connections sorted by anomaly score (#210−420)
390
410
0
Figure 1: Visualization of prediction sensitivity. The mean and the standard deviation Jacobian matrices for the land attack exhibit different patterns for attack and normal data, as well as different impact of particular features on prediction. The grey-scale bars to the right of the figure illustrate the range of matrix values.
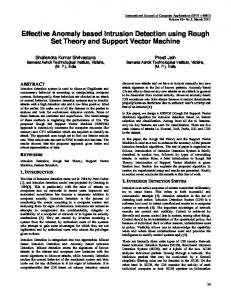
In order to illustrate feature selection based on the proposed criterion, we calculate the mean and the standard deviation of the mean Jacobian matrix for the attack instances only. These quantities computed for the land attack are shown in Fig. 2. One can see that the numerical characteristics of prediction sensitivity provide substantial information for identifying candidate features. According to the “high mean/low variance” criterion, most prominent for this example are the features 38, 39, 40, 45. Their names and brief descriptions are shown in Table 1. These features are indeed meaningful for the land attack. This attack is manifested in transmission of single TCP packets (with SYN set) that crash a server without eliciting an ACK reply; as a result high SYN error rates are observed. The features 48, 50, 52, 53 may also be added as second-choice candidates. Number 38 39 40 45
Name srv count serror rate srv serror rate srv diff host rate
Description Number of connections to service SYN error rate SYN error rate for service SYN error rate for service on multiple hosts
Table 1: Feature subset selected using prediction sensitivity.
Mean / Standard deviation
Mean and standard deviation of mean Jacobian matrix for instances of the "land" attack 30 20 10 0 −10
Standard deviation Mean Selected features Additional selection candidates
−20 −30 0
10
20
30 Feature number
40
50
Figure 2: Mean and standard deviation of mean Jacobian matrix for instances of the land attack. According to the “high mean/low variance” criterion a subset of features and additional candidate features have been selected.
We have performed the interpretation and analysis of all 21 attacks present in the KDD Cup dataset. Due to space constraints we cannot present the detailed analysis here; so we restrict ourselves to 5 characteristic attacks which demonstrate the strengths as well as the limitations of the proposed visualization technique. For each of the attack classes remote-to-local (R2L), user-to-root (U2R) and probe one attack was arbitrarily selected. For the class of denial-of-service (DoS) attacks we decided to interpret two attacks which differ in activity. The following attacks were chosen: – the phf (R2L) attack exploits a security flaw in the input handling of CGI scripts which allows the execution of local commands on a remote web server, – the loadmodule (U2R) attack exploits an improper boundary check in the program loadmodule of the Solaris operating system and allows a local attacker to gain super-user privileges, – the portsweep (probe) attack discovers active services on remote hosts by systematically requesting connections to multiple TCP ports, – the pod (DoS) attack crashes or reboots remote systems by sending a single, oversized IP datagram corrupting the host’s packet reassembly, – the smurf (DoS) attack uses misconfigured broadcast hosts to flood a victim host with spoofed ICMP datagrams. In order to qualitatively compare the proposed feature selection method with alternative techniques, we applied the RIPPER classifier to our datasets, in a similar way as it was previously used in [LSM99, LS01] for feature analysis and generation of detection rules. Table 2 lists the selected features based on prediction sensitivity and corresponding RIPPER rule sets for the five example attacks.
phf
Feature selection based on prediction sensitivity: hot, num_access_files, duration
RIPPER rule set: phf :- root_shell>=1, src_bytes