brain atlas is stored in a digital format it is, in fact, a database (Frackowiak et al.,. 1997, p. 447). Accordingly ...... Co-planar stereotaxic atlas of the human brain.
Visualization and Query Tool for a Human Brain Database
LARS FORSBERG
Master’s Degree Project Stockholm, Sweden 2004
TRITA-NA-E04049
NADA Numerisk analys och datalogi KTH 100 44 Stockholm
Department of Numerical Analysis and Computer Science Royal Institute of Technology SE-100 44 Stockholm, Sweden
Visualization and Query Tool for a Human Brain Database
LARS FORSBERG
TRITA-NA-E04049
Master’s Thesis in Computer Science (20 credits) at the School of Engineering Physics, Royal Institute of Technology year 2004 Supervisor at Nada was Kai-Mikael Jää-Aro Examiner was Stefan Arnborg
Abstract Human brain mapping is an exciting field which has evolved rapidly the last 20 years. With new techniques, such as functional PET and MRI, one has been able to map the brain functionally in a way never thought possible before. Yet, much remains to be done in order to create a comprehensive functional map of the human brain. By making analyses across functional PET or fMRI studies, new knowledge about the human brain may be gained. This kind of analysis is often referred to as meta-data analysis. It is preferred if the analyses for all studies are done in the same manner. However, since scientists often are using different methods, this is normally not the case. The NeuroGenerator project tries to solve this problem by collecting functional brain studies around the world and do the analyses in a homogenous way. The result is a database containing statistical results as activation images. The aim of this Master’s project was to construct a visualization and query tool for the NeuroGenerator database. The result is an advanced research tool which allows the user to do analyses across studies.
Sök- och visualiseringsverktyg för hjärndatabas
Sammanfattning Kartläggning av den mänskliga hjärnan är ett intressant forskningsfält som har haft en snabb utveckling de senaste 20 åren. Med ny teknik, såsom funktionell PET och MRI, har man lyckats kartlägga hjärnan funktionellt på ett sätt ingen kunde tro vara möjligt förut. Mycket återstår dock för att göra en omfattande funktionell karta av den mänskliga hjärnan. Genom att göra analyser över funktionella PET- och fMRI-studier kan man få ny kunskap om hjärnan. Denna analys kallas ofta för meta-analys. För att göra detta är det bäst om analyserna från alla studier är gjorda på samma sätt. Detta är dock sällan fallet, då forskare ofta använder olika metoder. NeuroGenerator är ett projekt som försöker lösa detta problem genom att samla funktionella hjärnstudier och göra analyserna på ett homogent sätt. Resultatet är en databas innehållande statistiska resultat som aktiveringsbilder. Detta exjobb har utvecklat ett sök- och visualiseringsverktyg för NeuroGeneratordatabasen. Resultatet är ett avancerat forskningsverktyg med vilket användaren kan göra analyser över experiment.
Contents 1 Introduction 1.1 Background . . . . . . . . . . . . . . . . . . . . . . . . . . . . . . . . 1.2 Thesis synopsis . . . . . . . . . . . . . . . . . . . . . . . . . . . . . .
1 1 2
I
3
Exploring human brain mapping
2 Neurobiology 2.1 The nervous system . . . . . . . . . 2.2 Cytoarchitectural maps . . . . . . . 2.3 Functional-anatomical divisions of the cerebral cortex . . . . . . . . . . 2.3.1 Motor system . . . . . . . . . 2.3.2 Somatosensory system . . . . 2.3.3 Broca’s and Wernicke’s areas 2.3.4 Vision . . . . . . . . . . . . .
. . . . . . . . . . . . . . . . . . . . . . . . . . . . . . . . . . . .
5 5 5
. . . . .
. . . . .
. . . . .
. . . . .
. . . . .
. . . . .
. . . . .
. . . . .
. . . . .
. . . . .
. . . . .
. . . . .
. . . . .
. . . . .
. . . . .
. . . . .
. . . . .
. . . . .
6 6 7 7 8
3 Measuring neural activities 3.1 Positron Emission Tomography (PET) 3.2 Magnetic Resonance Imaging (MRI) . 3.2.1 Functional Magnetic Resonance 3.3 Discussion . . . . . . . . . . . . . . . .
. . . . . . . . . . Imaging . . . . .
. . . . . . . . . . (fMRI) . . . . .
. . . .
. . . .
. . . .
. . . .
. . . .
. . . .
. . . .
14 14 15 16 17
4 Statistical neuroimaging 4.1 Analysis of fMRI data . . . . . . 4.1.1 Preparing the data . . . . 4.1.2 Analyzing the data . . . . 4.2 PET analysis . . . . . . . . . . . 4.3 Hypothesis testing . . . . . . . . 4.3.1 Statistical parametric map 4.3.2 Statistical inferences . . . 4.4 Intersection analysis . . . . . . . 4.5 Talairach space . . . . . . . . . . 4.6 Paradigm design . . . . . . . . .
. . . . . . . . . .
. . . . . . . . . .
. . . . . . . . . .
. . . . . . . . . .
. . . . . . . . . .
. . . . . . . . . .
. . . . . . . . . .
. . . . . . . . . .
. . . . . . . . . .
19 19 19 22 26 27 27 28 33 34 35
. . . . . . . . . .
. . . . . . . . . .
. . . . . . . . . .
. . . . . . . . . .
. . . . . . . . . .
. . . . . . . . . .
. . . . . . . . . .
. . . . . . . . . .
. . . . . . . . . .
. . . . . . . . . .
. . . . . . . . . .
4.6.1 4.6.2 4.6.3 4.6.4
II
Block related design Event related design Parametric design . Factorial design . . .
. . . .
. . . .
. . . .
. . . .
. . . .
. . . .
. . . .
. . . .
. . . .
. . . .
. . . .
. . . .
. . . .
. . . .
. . . .
. . . .
. . . .
. . . .
. . . .
. . . .
. . . .
. . . .
. . . .
Developing tools for human brain mapping
35 35 35 36
37
5 NeuroGenerator 5.1 Experiment structure . . . . . . . . . . . . . . . . . . . . . . . . . . . 5.2 Processing chain . . . . . . . . . . . . . . . . . . . . . . . . . . . . . 5.3 Images and metadata . . . . . . . . . . . . . . . . . . . . . . . . . . .
39 39 40 40
6 Developing a visualization and query tool 6.1 Common techniques . . . . . . . . . . . . . 6.1.1 3D visualization techniques . . . . . 6.1.2 Ray casting . . . . . . . . . . . . . . 6.1.3 Hardware texture mapping . . . . . 6.1.4 Isosurface rendering . . . . . . . . . 6.2 Requirements . . . . . . . . . . . . . . . . . 6.2.1 Comparing methods . . . . . . . . . 6.2.2 Intersection analysis in the visualizer 6.2.3 Population maps . . . . . . . . . . . 6.2.4 Color maps . . . . . . . . . . . . . . 6.2.5 Views . . . . . . . . . . . . . . . . . 6.2.6 Atlases . . . . . . . . . . . . . . . . . 6.2.7 Volumes of interest . . . . . . . . . . 6.2.8 Database interaction . . . . . . . . . 6.3 Conclusion . . . . . . . . . . . . . . . . . . .
. . . . . . . . . . . . . . .
41 41 42 42 42 42 43 43 43 43 44 44 46 46 47 49
. . . . . . . . . . . . . .
50 50 50 50 51 52 52 52 53 53 54 54 55 55 56
. . . . . . . . . . . . . . .
. . . . . . . . . . . . . . .
. . . . . . . . . . . . . . .
. . . . . . . . . . . . . . .
. . . . . . . . . . . . . . .
. . . . . . . . . . . . . . .
. . . . . . . . . . . . . . .
. . . . . . . . . . . . . . .
. . . . . . . . . . . . . . .
. . . . . . . . . . . . . . .
7 Results 7.1 Early versions . . . . . . . . . . . . . . . . . . . . . . . . . . . 7.1.1 Platform . . . . . . . . . . . . . . . . . . . . . . . . . . 7.1.2 3D view . . . . . . . . . . . . . . . . . . . . . . . . . . 7.1.3 GTK . . . . . . . . . . . . . . . . . . . . . . . . . . . . 7.2 Current version — features . . . . . . . . . . . . . . . . . . . 7.2.1 Show unlimited overlays and their overlap . . . . . . . 7.2.2 Choose the overlay color from a number of color maps 7.2.3 Visualize both binary and non-binary overlays . . . . . 7.2.4 Provide simple image processing . . . . . . . . . . . . 7.2.5 2D and 3D view, with contrast stretching . . . . . . . 7.2.6 User defined volumes of interest . . . . . . . . . . . . . 7.2.7 Atlases . . . . . . . . . . . . . . . . . . . . . . . . . . . 7.2.8 MNI/Talairach transformation . . . . . . . . . . . . . 7.2.9 Interaction with database . . . . . . . . . . . . . . . .
. . . . . . . . . . . . . . .
. . . . . . . . . . . . . .
. . . . . . . . . . . . . . .
. . . . . . . . . . . . . .
. . . . . . . . . . . . . . .
. . . . . . . . . . . . . .
7.3
7.4
Use cases . . . . . . . . . . . . . . . . . . . . . . . . . . 7.3.1 Find clusters having activation in motor area 6 . 7.3.2 Visualize peaks from result . . . . . . . . . . . . 7.3.3 Find and visualize co-activated clusters . . . . . 7.3.4 Get a list of event keywords associated with a list 7.3.5 Find contrasts related to a visual task . . . . . . User feedback . . . . . . . . . . . . . . . . . . . . . . . .
. . . . . . . . . . . . . . . . . . . . . . . . . . . . of clusters . . . . . . . . . . . . . . .
59 59 60 60 60 61 61
8 Discussion and conclusions
66
Bibliography
67
A
71 71
A.1 Glossary . . . . . . . . . . . . . . . . . . . . . . . . . . . . . . . . . .
Chapter 1
Introduction 1.1
Background
The neuroimaging field has rapidly grown the last years and today it involves many disciplines such as biomedical engineering, physics, biophysics, statistics, electrical engineering, computer science, neuroscience, physiology, biology, and anatomy. The Organization for Human Brain Mapping (OHBM) has evolved in response to this growth. OHBM gathers people from all the fields mentioned above and is a foundation for research across groups exploring human brain mapping. The growth in this field has also been the foundation for newly created functional-imaging centers across the world. The main objective in functional neuroimaging is to map the location of cerebral functions1 , i.e., to create an atlas of the brain (Roland et al., 2001). When a brain atlas is stored in a digital format it is, in fact, a database (Frackowiak et al., 1997, p. 447). Accordingly, a neuroimage database is a brain atlas. There are already a few databases in the field today, e.g., the BrainMap database (BrainMap), but others are under development such as fMRIDC and NeuroGenerator (fMRIDC; NeuroGenerator). The NeuroGenerator project aims at generating statistical neuroimage databases for the neuroimaging community and was originally a collaboration between the Division of Human Brain Research at the Karolinska Institute, the Department of Numerical Analysis and Computer Science at the Royal Institute of Technology, the Department of Information Science at Uppsala University, FORWISS (Bavarian Research Center for Knowledge-based Systems), and Active Knowledge GmbH. NeuroGenerator introduces new concepts in the field as the scientists submit the raw data and not only the results. This way, the data can be processed in a uniform way and the database generator can create databases of homogenous data which are suitable for meta-analysis (Roland et al., 2001). 1 Brodmann published a brain map as early as 1909 (Brodmann, 1909) but this was only a map of the cellular structure of the brain. Functional neuroimaging is used to find where different brain functions, such as vision or understanding speech, are located in the brain. These areas are called functional areas.
1
The assignment of this Master’s project is to develop a prototype of a visualization and query tool for statistical images within the NeuroGenerator project. Such a tool should help the user to analyze the data. Hence, it is important to understand the statistical analysis of the data in order to develop such a tool. It is also important to understand its context from a neuroscientist’s point of view. The Master’s project has therefore been divided in two major parts: first exploring human brain mapping to gain knowledge about the field and then developing a visualization tool based on this knowledge.
1.2
Thesis synopsis
The first part of this Master’s thesis is called “Exploring human brain mapping”. This includes not only the statistical methods but also the neurobiological aspects. If the tool should give answers to the neurobiological questions the field has, one needs to understand the questions. For this reason, chapter two goes briefly through the functional-anatomical divisions of the cerebral cortex, chapter three continues with describing the scanner techniques and chapter four describes the statistical methods used in the field. The second part of the thesis describes the development of the visualization and query tool. It starts with chapter five, describing the NeuroGenerator database. Chapter six continues with a discussion of what features a visualization and query tool to this database should have. Chapter seven goes through the results, by describing the final version of the tool called NG-Viz. Chapter eight ends with a discussion and some conclusions about NG-Viz. In the end of the Master’s thesis, you will find a glossary explaining technical terms. The first time a technical term is written, it is also explained with a footnote and written in bold.
2
Part I
Exploring human brain mapping
3
4
Chapter 2
Neurobiology The central nervous system (CNS) consists of the brain and the spinal cord. Together, they control our personality, senses, basic body functions, and how we function in our environment. In this chapter, we will briefly go through the functionality of the brain.
2.1
The nervous system
The nervous system is composed of individual cells, just as in other organs. These cells are often called neurons. The difference between a normal cell and a neuron is that the neuron is specialized in inter-cellular communication. Connected together with other neurons in a network, it receives signals from some neurons, processes the signals, and sends the electrically encoded information to other neurons. One estimation is that the brain’s network consists of about 1012 neurons. Together with the spinal cord, the brain sends messages throughout the body (Reichert, 1992).
2.2
Cytoarchitectural maps
In 1909, Dr. Korbinian Brodmann (1868–1918) established the first cytoarchitectonic map1 of the human brain (Brodmann, 1909). His work identifies about 50 distinct cortical areas2 . This map still has a great impact on the view of the human cerebral cortex3 (figure 2.1). Other various cyto- and myeloarchitectonic maps4 have been proposed by Vogt (1911) who presented a detailed architectonical parcellation scheme of the parietal lobe, von Economo and Koskinas (1925) who proposed more areas and summarized the work by Brodmann and others, and Bailey and von Bonin (1951) and 1
Map of areas defining group of cells in the tissue with a specific arrangement. Areas located in the cortex. 3 The superficial gray matter of the brain. 4 Maps of regions with a specific variation on the distribution of myelin. Myelin is the multilaminated wrapping around many axons. Axons are the nerve fibers that conduct impulses from the body of the neuron to the muscles or the synaptic sites of other neurons. 2
5
Eidelberg and Galaburda (1984) who further developed this concept. A comparison between these areas and Brodmann’s can be read in Zilles and Palomero-Gallagher (2001). Recent work by Karl Zilles and colleagues uses modern technology to do architectonic analysis in post-mortem human brains. Their work has resulted in the creation of three-dimensional cytoarchitectonic volumes. These are created from semi-automated quantitative microscopic analyses of thin slices of the post-mortem brains, which are digitized and registered with the corresponding anatomical MRscan (Geyer et al., 2000).
2.3
Functional-anatomical divisions of the cerebral cortex
The ever-finer picture of the cerebral cortex has emerged over the last century. Imaging techniques such as PET and fMRI allow the neuroscientists to investigate functional-anatomical divisions of the human brain. The largest region in the brain, the cerebrum, consists of a right and left hemisphere. These hemispheres are divided down to the corpus callosum5 by the Interhemispheric Fissure6 . Both hemispheres are divided into four sections. These sections are called lobes (figure 2.2). The divisions of these lobes with some of the anatomical landmarks, such as sulci7 and gyri8 , and the functional-anatomical divisions of the cerebral cortex will be discussed below. The areas presented here are from Karl Zilles group. Area 22 was not yet mapped at the time of writing and its location was therefore only presumed in figure 2.5.
2.3.1
Motor system
The motor cortex9 is found in the frontal lobe of the brain. If we look at the old Brodmann atlas, we find the motor system in area 4, area 6 (precentral and intermediate precentral cortex respectively, see figure 2.3), and area 23 and 24 (cingulate motor areas). Area 4 is called the primary motor cortex or M1, and is found anterior to the central sulcus. It is further divided into an anterior (4a) and a posterior (4p) part. This division is found from cytoarchitectural studies of the area. The functional distinction between the two parts is less known, but there are suggestions that some digits10 are represented separately in the two regions and that there are functional differences between 4a and 4p (Geyer et al., 1996). 5
A bundle of fibers connecting the cortices of the two hemispheres. A fissure is a deeper fold than a sulcus in the cerebral cortex. 7 Sulci, plural of sulcus, means furrows in the brain. 8 Gyri, plural of gyrus, means the hills that are separated by sulci. 9 The regions in the brain related to movements of the muscles. 10 Fingers and toes. 6
6
Area 6 is anterior to area 4 and divided into a medial11 area (supplementary motor area, SMA) and a lateral area (premotor cortex, PMC). Area 6 is also known as the motor association cortex. The SMA is known to be involved in planning and the initiation of voluntary movements as well as bimanual coordination. A recent paper (Toma et al., 2003) shows that the SMA is involved in regulation of movement timing. Hence, it is vital for temporal organization of movements. While SMA is involved in voluntary movements, PMC is engaged in sensory guided actions, for instance when driving a car. One study (Schubotz and von Cramon, 2001) shows that the PMC activates differently for different kinds of visual stimuli, depending on if the sensory guided action involves object, spatial or temporal specific properties. Indeed, driving a car is quite a complex task which depends on all these properties. Therefore, it is likely that the PMC could be divided into smaller regions, each with its own functional property. Areas 23 and 24 contain the cingulate motor areas (CMAs). These are thought to play a central role in processing information necessary to select voluntary movements. It is also thought that these areas are a part of the reward system in which we choose our movements according to the expected reward value (Shima and Tanji, 1998).
2.3.2
Somatosensory system
The somatosensory cortex12 is found posterior to the central sulcus (within the Parietal lobe) and it is divided into a number of different areas. The postcentral gyrus, immediately posterior to the central sulcus, is known as the primary somatosensory cortex (SI). SI is found in the Brodmann atlas as areas 1, 2 and 3. Area 3 was later divided into two parts, 3a and 3b (see figure 2.4). Studies show that active tactile discrimination of an object activates area 3a, whereas passive discrimination does not. This is due to the fact that neurons in 3a respond to muscle stimulations and stimulation of skeletal mechanoreceptors. Areas 3b and 1 respond to stimulations related to skin. Area 2 responds to both muscle and skin stimulations (Bodegård, 2001). However, in a strict manner we ought to call only areas 3a and 3b the primary somatosensory cortex, since the mechanoreceptors project mainly to these areas. This view is strengthened by the fact that area 3b sends fibres to areas 1 and 2. Still, we choose to call all these areas the primary somatosensory cortex.
2.3.3
Broca’s and Wernicke’s areas
Broca’s area was found by Paul Broca in 1861. Broca had a patient called Tan who could not say anything else than “tan, tan”. After Tan’s death, Broca made an autopsy of Tan’s brain. Broca noted that his patient had a lesion located on the outside surface of the left frontal lobe. Hence, the lesion of the frontal lobe was the 11 12
Located nearer to the midsagittal plane, i.e., the opposite of lateral. The regions related to perception of sensory stimuli from the skin and internal organs.
7
cause of the loss of speech. We know today that Broca’s area controls movements of lips, tongue and vocal cords, and is therefore designated as the motor speech area. This area corresponds to areas 44 and 45 in the Brodmann atlas, at the inferior frontal gyrus. While Broca’s area produces our speech, Wernicke’s area understands it. Wernicke’s area was located in 1874 by Carl Wernicke. He found that a lesion in the superior temporal gyrus (Brodmann area 22) results in an inability to comprehend language. People having a damage to this area are unable to produce meaningful sentences. However, their speech does have a grammatical structure since syntax analysis is a function in Broca’s area. Figure 2.5 shows both areas. These two areas are both involved in language comprehension and in speech production. When listening to words, speech information is transported to Wernicke’s area from the auditory area. Wernicke’s area evaluates the significance of the words and forwards the information to Broca’s area for syntax analysis. In speech production, we select the words to speak in Wernicke’s area and add grammatical refinements in Broca’s area. Broca’s area produces our speech by sending the right information to the motor cortex. The motor cortex activates the muscles used for speaking. The risk for speech impairment for patients with brain tumors is severely decreased with the use of clinical fMRI protocols, in which MR scanners are being used to localize Broca’s and Wernicke’s areas on individual patients. This technique improves the intraoperative orientation in surgery (Stippich et al., 2003).
2.3.4
Vision
Most of the visual information from the eyes is first received by area V1 (Brodmann area 17), the primary visual cortex. This area is located at the back of the brain, in the occipital lobe (see figure 2.6). Cells in V1 respond to bars and edges. Area V2 receives input from V1 and some of the layers of V1 are projected to V3/VP (ventral posterior), V4 and V5. Areas V3 and VP receive input from V1 and V2. The lower part of the visual field is represented by V3 and the upper part is represented by VP. VP is no longer considered a part of V3, hence given a different name. Most cells in these two areas respond to orientation, motion and depth, while few are color sensitive. Area V4 is mostly known as the color analysis area, although it does also have other properties such as spatial and orientation tuning. V4 receives its input mainly from V2, but does also receive input from V1 and V3. Area V5 receives input from V1 and V2 and most of the cells respond to motion. V3, V5 and V5 send their information away to other areas in the brain that process visual information. These areas work together to give us a final perception of the visual world, both spatially and temporally. The question of how it is done is referred to as the “perceptual binding problem” (Treisman, 1996). A good background about mapping these areas functionally is given in Larsson (2001).
8
Figure 2.1. Brodmann areas (Brodmann, 1909).
9
Central Sulcus
Parietal lobe Frontal lobe Occipital lobe Temporal lobe Cerebellum
Sylvian fissure
Figure 2.2. Lobes in the brain.
10
Central Sulcus
Paracentral Sulcus Cingulate Sulcus Transverse Parietal Sulcus
Parieto-Occipital Sulcus Calarine Sulcus
Superior (above) Anterior (in front of)
Posterior (behind)
Inferior (below)
Area 6
Area 4a Area 4p
Figure 2.3. Major sulci and motor areas in medial view, near the midsagittal plane.
11
Area 1 Area 3b Area 3a
Area 2
Figure 2.4. Somatosensory areas.
Area 45 Horizontal slice
Area 44 Area 44 Area 45
Presumably area 22
Right
Left
Horizontal (axial) slice
Figure 2.5. Cytoarchitectural areas 44 and 45. The location of area 22 is only presumed, since it remains to be mapped.
12
Area 18 Area V5
Area 17 Figure 2.6. Cytoarchitectural areas 17, 18 and V5, seen from behind and to the left of the brain.
13
Chapter 3
Measuring neural activities Two techniques that measure brain activities indirectly are Positron Emission Tomography (PET) and functional Magnetic Resonance Imaging (fMRI). PET measures the changes in blood flow, while fMRI measures the oxygenation of blood. The activities in the brain is interpreted from these measurements. The two techniques will be described below.
3.1
Positron Emission Tomography (PET)
When a positron (a positive electron) hits an electron they annihilate each other. The total energy from the two particles is emitted as two photons about 180 degrees apart. The electron and the positron have a mass of 9.109 · 10−31 kg each, giving each photon an energy of E = mc2 = 511 keV
(3.1)
where m is the mass and c = 299792458 m/s is the speed of light. It is possible to calculate where the annihilation took place in 3D space if we have detectors that can measure the photons. This is done with a Positron Emission Tomography scanner (PET scanner) (see figure 3.1). A positron is emitted when a positron-emitting radioisotope decays. It is thus possible to detect where the decay took place, since the positron travels a very short distance from the nucleus before it annihilates. By injecting a radioisotope into the human body, it can be determined where in the body (for instance the brain) it decays. The distribution of the radioisotope can be visualized in 3D or used to statistically secure brain activation areas. Typical for all radioisotopes used in PET is that they have a short half-life and are produced near the scanner by a cyclotron (a charged particle accelerator). The most common positron emitters have a half-life time between two and 110 minutes. The isotope is converted into a radiotracer rapidly after the production. Different radiotracers will be distributed in different ways, and a PET study can therefore determine different entities such as blood flow or drug concentrations in the brain. 14
emitting photons
point of annihilation
detectors
Figure 3.1. The PET scanner, used to detect emitted photons.
If we want to trace an active substance in a drug, it is possible to incorporate the isotope in the substance and get a radiolabeled compound. Since the positron travels a little bit from the decay point before it annihilates, we cannot measure the exact location of the decay. The resolution of the 3D images will decrease the further the positron travels. This error depends on the radioisotope. The emitting positron will travel further away the higher kinetic energy it has. Oxygen-15 emits energetic positrons, thus gives a large error, while Fluorine-18 emits less energetic positrons (Jacobs and Cherry, 2001). Oxygen-15 has a half-life of 2.1 minutes and is mostly used for short scans of about one minute. Budinger and VanBrocklin (2000) have a nice introduction to PET.
3.2
Magnetic Resonance Imaging (MRI)
A charged particle that is subject to an angular momentum L gives rise to a magnetic moment µ. An example of this is the electron rotating around the nucleus. However, the electron itself gives rise to an intrinsic magnetic moment which is caused by the electron spin. The nucleus also has an intrinsic angular momentum. The magnetic moment for the nucleus is measured in terms of the nuclear magneton µn = 5.05 · 10−27 J/T. A 15
free proton has a magnetic moment of approximately 2.7928µn . Even the neutron has a magnetic moment, which is caused by an internal charge distribution. A MRI scanner has a large static magnetic field produced by the MRI magnet. This magnet has a field of up to several Tesla. Inside the magnetic field, the energy levels for a nucleus will be split into (2I + 1) discrete states where I is the spin number. Hydrogen has for instance two discrete states, since the spin for hydrogen is I = 1/2. In its lowest energy state, the nuclear moment will be parallel with the external magnetic field, while in its higher energy state the nuclear moment will be aligned anti-parallel to the magnetic field. When excited with a pulse of radiofrequency magnetic field (RF pulse), the protons will increase their energy state, making the the alignment of the protons magnetic moment change to be anti-parallel with the large static field. The time between the radiofrequency pulses is called TR. After the excitation, the protons recover to their original alignment. The recovery induces a signal voltage in the scanner coil and takes from tenths of a second to a few seconds. The frequency of the RF pulse is given by the Larmor equation: ν = γB0
(3.2)
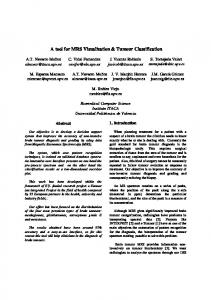
where B0 is the magnetic field strength (for instance 1.5 T), γ is the gyromagnetic ratio1 for the spin (given in MHz/Tesla) and ν is the Larmor frequency. The recovery time is dependent on the type of tissue. The rate of recovery is described by “longitudinal relaxation time”, or just T1. If TR is 300 ms and the value of T1 is about 3 s for some regions, for instance in the fluid filled ventricle regions, these will appear very dark. White matter in the brain will still look relatively bright since the T1 for white matter is only about 800 ms at 3 Tesla (Jezzard et al., 2001). The resulting image is called an anatomical MRI, or aMRI for short (figure 3.2).
3.2.1
Functional Magnetic Resonance Imaging (fMRI)
There are other ways of obtaining induced signals, such as T2 which measures “transverse relaxation time”, and T2’ which measures the magnetic field variations across the object. These are a little bit more complicated and we are not going to look into detail how they are obtained. The important thing is that these two signals can measure local magnetic field inhomogeneities, called T2∗ relaxation, according to 1/T2∗ = 1/T2+1/T2’. Our blood consists of several parts. One part is the red blood corpuscles which contain hemoglobin. The hemoglobin transports oxygen from the lungs to the rest of the body, including the brain. When hemoglobin is carrying oxygen it is called oxyhemoglobin, otherwise deoxyhemoglobin. Since deoxyhemoglobin is more paramagnetic2 than oxyhemoglobin, the deoxygenation of blood can be measured given that the MRI sequences are sensitive to 1 The gyromagnetic ratio of a rigid body in relativistic quantum theory is about q/m, where q is its charge and m is its mass. 2 The magnetization of deoxyhemoglobin is more proportional to the strength of the magnetic field than oxyhemoglobin.
16
Figure 3.2. Sagittal slice of an T1 anatomical MRI, this one showing my own brain.
magnetic field inhomogeneity, i.e., T 2∗ . The technique is called “blood oxygenation level dependent contrast” or just BOLD. Figure 3.3 shows a BOLD signal image. This technique opens for functional mapping studies of the human brain, since the deoxygenation of blood is related to the neural activity. When doing functional MR scans, a 3D image can be obtained in just a few seconds. Both the spatial and the temporal resolution vary depending on the scanner and the setting, but a typical example is a spatial resolution of 64 × 64 × 21 voxels (volume elements) and a temporal resolution of 5 seconds. Thus, many 3D images are obtained within a scanning session, which typically lasts for some minutes. Oppelt (2001); Woolrich et al. (2001); Jezzard et al. (2001); Frackowiak et al. (1997) are good sources for reading about MR and fMRI.
3.3
Discussion
PET and fMRI are two different techniques that dominate the field of functional neuroanatomy. As we have seen, PET can be used in many kind of studies and is sometimes the only choice, for instance when measuring drug concentration in the brain. However, for functional neuroanatomy, fMRI is indeed an alternative and powerful technique, unbeatable in both temporal and spatial resolution. To that comes the fact that PET is much more dangerous to the subject because of the energetic photons that arises at the annihilation point. Yet there are still some 17
Figure 3.3. BOLD signal image.
studies that cannot be performed with fMRI. Any study which uses an electronic device in the scanner cannot be done with fMRI due to the strong magnetic field.
18
Chapter 4
Statistical neuroimaging In a functional PET or fMRI experiment, the aim is to find the functional areas in the brain that are active for a certain task. A task might be to look at a picture, memorize something or touching something: in fact anything that activates a certain functional area in the human brain. PET and fMRI allow us to measure the brain activities as images in 3D. These images are often referred to as volumes. Each scan gives one 3D image, which can be seen as a volume of measuring points. These points are regarded as voxels, i.e., small volume elements in 3D space. This chapter will mainly discuss analysis of fMRI data but will also look at PET analysis.
4.1
Analysis of fMRI data
A scanning session in fMRI may last for several minutes, and the time it takes to scan one image (called TR) is about five seconds (this may vary). If a session takes 270 seconds and TR=5, we will obtain 54 3D images. The temporal resolution is the same as TR and the measured values within a scanning session are highly time dependent.
4.1.1
Preparing the data
Before doing any analysis, it is necessary to prepare the data so that the linear fitting process can be done. This is done in seven different steps. Reconstructing k-space data The MR scanner measures the data in k-space so we need to transform the data acquired by the MR scanner to something that looks like brain images. K-space is often referred to as the frequency domain or Fourier space and is a 2D-plot of spatial frequencies. Hence, there is no positional relationship between a point in k-space and a point in the image. Instead, each point in k-space contributes a little bit to the 19
whole image. The transformation is done with the Fourier transform. After Fourier transforming the data, we have a time series of 3D images containing the BOLD signal for each voxel. Figure 4.1 shows the image before and after transformation.
Figure 4.1. Left: before Fourier transformation. Right: after Fourier transforming.
Slice-timing correction Each slice for a given image is acquired at different times. It takes some few seconds to acquire a whole 3D image. Thus, it is necessary to make the data appear like each image in the time series was acquired at the same time point. This is called slice-timing correction and is easy to do with sinc-interpolation. This is done by convolving the sinc function with the sampled signal. The sinc function is given by sinc(t) �
sin(πt) . πt
(4.1)
Alignment Motion correction is needed to align the brain in each image so that it appears as if the subject is having the head at the same position during the whole session. This step is done by transforming each image using rotation and translation, so that all volumes are aligned with the first volume in each session. Spatial filtering In order to enhance low frequency signals and suppress noise, it is necessary to smooth all the data. This is done by convoluting each functional image with a Gaussian kernel, which has the shape of a normal distribution 2
e(−x−µ) /(2σ √ f (x) = σ 2π
2)
(4.2)
where µ = 0. The width of the kernel is measured in something called FWHM, the Full Width at Half Maximum, as opposed to the statistical way where the width is 20
defined in terms of σ. Given a FWHM of ω, σ is calculated as: ω σ=� 8 log(2)
(4.3)
Instead of doing the convolution in 3D, it is possible to get the same result by doing a one dimensional convolution in the x direction, then convolve the xconvolved data in the y direction, and finally convolve the x,y-convolved data in the z direction. The result is a blurred image. The size of the filter is dependent on the size of activations to expect. Large filters should be avoided if small activations are to be expected. However, when searching for huge activations and especially when the data are noisy, a large filter should be used. Intensity normalization In order to reduce the effect of global changes in intensity over time, we must make sure to adjust the volumes overall intensity level. The volumes should have the same mean intensity. The simplest way of doing this is to rescale all the volumes to have the same mean value across all voxels within each volume. The mean value is chosen arbitrarily, for instance 50. The scaling factor would then be calculated as s=
50 � v(x, y, z) N x,y,z
(4.4)
where N is the total number of voxels in the volume. The new voxel value v � (x, y, z) is then calculated as v � (x, y, z) = sv(x, y, z). However, to avoid doing any intensity normalization on voxels being outside the brain, we can threshold the images first at say 10 per cent of the maximum volume intensity, thus only consider the voxels having a value above this threshold. Temporal filtering Spatial noise in the image is removed by applying a spatial filter. The same thing should be done temporally to remove high and low frequency noise. As before, we want to avoid removing any interesting signals. There is both low frequency and high frequency noise in the signal, so we need to apply both a high-pass and a low-pass filter. The high-pass filter should remove low frequency noise, such as scanner-related drift. The low-pass filter should remove high frequency noise. The temporal filter is applied at each voxel’s time series. Segmentation and normalization to standard brain The skull is sometimes removed from the images before analyzing the data, especially if the images are going to be normalized to a standard brain. We will discuss standard brains in section 4.5. 21
4.1.2
Analyzing the data
The value we measure at a given time t, i.e., the BOLD signal, originates from many sources. We can write the measured value at voxel j as yj (t) and the value from each source i as si (t). There is a dependency between yj (t) and the signal si (t) which we can regard as linear. We write the contribution from the signal si (t) as βij , and we get: yj (t) =
N �
βij si (t)
(4.5)
i=1
The BOLD signal yj (t) measures the oxygenation of blood and not the actual neuronal activation. Thus, the signals si (t) are produced by hemodynamic1 brain tissue activations and machine artifacts rather than the neuronal activation itself. This gives rise to both high- and low frequency activations in the signals, some which are related to the tasks in the experiment. The process of finding these signals and their contribution at each voxel is called Blind Source Separation. One method is to use independent component analysis (McKeown et al., 1998). However, even though the contributions of these signals are known, one problem is to know that a certain signal si (t) comes from a certain task in the experiment. One way to get around this problem is to model the signals of interest from our pre-knowledge about when different tasks occur in time and calculate how much each such signal contributes to each voxel in the brain, i.e., calculating the βij values. This can be done with a General Linear Model. General Linear Model If the modeled signals are xi (t) we can write yj (t) =
N �
βij xi (t) + �j (t),
(4.6)
i=1
where N is the number of modeled signals, �j (t) the error in the estimation and yj (t) is the BOLD signal for voxel j. This is a linear model which can be written as y j = Xβ j + �j
(4.7)
in matrix form. The number of parameters N is less than the number of observations M . Hence, the parameters β j cannot be calculated with �j = 0. However, we can estimate the parameters that best fit the data. This is achieved ˆj as with the least squares method. We can calculate our estimate β ˆj = (X T X)−1X T y . β j
(4.8)
The matrix X is called the design matrix and is used for all the voxels. For each ˆj . This kind of analysis is called a univariate analysis, voxel j we get an estimate β 1
Forces involved in the circulation of blood such as changes in blood pressure and blood flow.
22
as it only considers one voxel, and is described in most linear algebra books, for instance Lay (1994). Example — a visual fMRI experiment The experimental setup telling the start and duration time for each individual task within each session is well prepared before the scanner starts. How do we go from this pre-knowledge about the experiment to actually estimate the signals? Let us answer this question by looking at an example. The aim in a visual experiment done by Courtney and Ungerleider (1997) was to gain more knowledge about the organization and functional properties of visual areas in the human cortex, by doing a fMRI study of working memory for faces. Each session had a time span of 180 seconds and the subjects performed three cycles of tasks during this time (giving each cycle a duration time of 60 seconds). The cycles consisted of one sensorimotor control task for 30 seconds followed by a working memory task for 30 seconds. The working memory task was divided into three events. The first event was a visual event where the subject saw a face. The next event was a memory event, in which the subject was instructed to remember the face. The last event was another visual event showing a face, but also a response event where the subject pressed either a left or a right button to indicate if the first face was identical to the second face. The sensorimotor control task was similar to the working memory task, but no memory event was performed and only scrambled unrecognizable faces were shown. The subject always pressed both buttons as response. In this experiment there were three conditions of particular interest: the visual stimulation condition, the face selective condition, and the memory condition. These conditions can be written as functions, i.e., c1 (t), c2 (t) and c3 (t), all returning one when the condition occurs and otherwise zero. Unfortunately, these functions cannot directly be used as model for our signals since there is no linear relationship between them and the measured BOLD signal. Modeling the hemodynamic response However, there is a non-linear relationship between the condition functions and the BOLD signal. The oxygenation effect from a task of some sort is not immediate, but connected to the blood’s hemodynamic, i.e., the change in blood pressure and blood flow. There are several ways of modeling the effect, called the hemodynamic response function (hrf). Gary H. Glover presented a model of the hrf as the difference of two gamma density functions (Glover, 1999). Five parameters determine the shape of the hrf: the time to the peak of the first function, full width half maximum (FWHM) of the first function, the time to the peak of the second function, FWHM of the second function, and the coefficient of the second function. Glover’s default values for an auditory stimulus are 5.2, 5.2, 10.8, 7.35, 0.35, found from deconvolution of impulse responses, which give us the function in figure 4.2. 23
Default hrf model by Glover 0.4
0.35
0.3
0.25
hrf
0.2
0.15
0.1
0.05
0
−0.05
−0.1
0
5
10
15
20
25
time (seconds)
Figure 4.2. The default hrf function by Glover (1999).
This function should be regarded as the measured response from a single stimulus with no duration, i.e., an impulse. By calculating the convolution between the hrf and the condition function we get the total hemodynamic response for that task as xi (t) = fi ∗ h(t)
(4.9)
where h(t) is the hemodynamic response function, fi (t) the condition function and xi (t) the signal we want to model. For the rest of the discussion, we will look at a stimulus2 as an experimental condition. An example is shown in figure 4.3, where the dashed line shows the stimulus and the solid line shows the hemodynamic response. The stimulus in this example has a duration time of 30 seconds and has its start time at 30, 90, 150, and 210 seconds. The hemodynamic response might be a little different in different parts of the brain. For instance, the time to the peak of the first gamma function might differ. By adding the derivative of the hemodynamic (convolved with our stimulus function) to our linear model we allow a small change of the hrf. If h(t) is our hrf we can write the superposition of the two functions as β1 h(t) + β2
∂h(t) . ∂t
(4.10)
If β2 = 0 and β1 = 1, we will get the same function as before. However, by changing β2 between −0.5 and 0.5, the resulting function can be seen as a hrf that 2
An example of a stimulus is the visual stimulation condition in the experiment described before.
24
Stimuli and corresponding hemodynamic response 1.4
1.2
1
0.8
0.6
0.4
0.2
0
−0.2
−0.4 10
20 30 40 frame number, each frame = 5 seconds
50
60
Figure 4.3. The stimuli and the corresponding hemodynamic response.
changes mostly in time and just a little bit in shape. Figure 4.4 shows three different superpositioned hrfs, where β1 = 1 for all functions while β2 is given three different values: β2 = −0.5, β2 = 0 and β2 = 0.5. The time to the first peak differs almost one second between β2 = −0.5 and β2 = 0.5. This is also shown in figure 4.5. Thus, for a certain voxel yj (t) we can use the following linear model, given the hrf h(t) and our stimulus function f (t): yj (t) = β1j f ∗ h(t) + β2j f ∗
∂h(t) + β3j ∂t
(4.11)
The hrf derivative allows a little error in time for f (t) as long as the error is consistent, i.e., we know that f (t + a) may give us a smaller error for some unknown � � value a. The hrf derivative will in this case catch this error and adjust for it if �a� ≤ 0.5. However, this does not mean it is possible to use this technique to correct the error that appears if we use the same design matrix for different slices (which are not measured at the same time). The error here is more than two seconds in some cases. It is possible to do the analysis without knowing anything about the hrf. The hrf can be expressed as a fourier series a0 � + (an cos nωt + bn sin nωt) 2 N
h(t) ≈
(4.12)
n=1
where ω = 2π/T , T = period of function h(t), and N is large. Each component is then convolved with the stimulus function f (t). As the analysis is still done voxelwise, this allows us to make unique hrf functions for each voxel. However, to make 25
Default hrf + hrf derivative 0.4
0.35
0.3
0.25
0.2
0.15
0.1
0.05
0
−0.05
−0.1
0
5
10
15
20
25
time (seconds)
Figure 4.4. Three superpositioned hrfs with different values for β2 .
a good approximation, N needs to be quite large and this decreases the degrees of freedom in the model. When doing fMRI analysis it is common to have more than one condition within one session. In these cases we just add more functions to our linear model, which will give us more parameters to estimate. Since sessions in fMRI are independent of each other, it is a good idea to do the analysis session by session, then do a second analysis of these estimates for one subject. As a third level (experiment level), we can look at the variance across subjects. This is a so called random effect analysis, where the results are valid for the whole population and not just the group (given that the subjects can be seen as independent random outcomes from the population).
4.2
PET analysis
PET analysis is similar to fMRI in many ways. However, due to its temporal resolution, which is very low, the condition function f (t) is assumed to be linear with the increase in blood flow when the global cerebral blood flow (gCBF) has been taken into account. Our linear model is still yj (t) =
N �
βij xi (t) + �j (t)
(4.13)
i=1
but we now claim that xi (t) = fi (t). 26
Default hrf + hrf derivative 0.354 0.352
β2=−0.5
0.35
β2=0.5
0.348 0.346 0.344 0.342 0.34
β2=0.0
0.338 0.336 0.334
4.6
4.8
5
5.2 time (seconds)
5.4
5.6
Figure 4.5. The peaks for β2 = −0.5, β2 = 0 and β2 = 0.5.
4.3
Hypothesis testing
4.3.1
Statistical parametric map
The result of the analysis may be a contrast between two or more parameter estimates, for instance between two different tasks in the experiment. An example could be to estimate which functional areas that are active during a painful somatosensory stimulus compared with a nonpainful somatosensory stimulus (Niddam et al., 2002). This is calculated as ˆj Ij = cT β
(4.14)
ˆj is a vector of the where Ij is the result in voxel j, c is a contrast vector and β parameter estimates at voxel j. Hence, if βˆ1j is the painful stimulus estimate and βˆ2j is the nonpainful stimulus estimate we will write cT = [1 − 1] if we want to compare the two conditions (given that we do not have any other conditions in the experiment and do not add the hrf derivative into the model). We can regard I as a 3D image. However, we need to consider the error �j (t) and we need to have a prespecified null hypothesis H0 about cT β j which we can reject. We estimate the residual variance at voxel j as σ ˆj2 =
�Tj �j M −p
(4.15) 27
where M is the number of observations, p = rank(X) and M − p is the degrees of freedom. In order to do this, the error must be uncorrelated with a constant variance, but this is not the case in fMRI. However, by modeling the autocorrelation, we can “whiten” the noise (Woolrich et al., 2001). When cT β j = 0 is true, there is no activation in voxel j for this contrast. This will be our hypothesis H0 . The alternative hypothesis is H1 , i.e., the voxel j is active. By calculating ˆj − cT β j cT β Tj = � σ ˆj2 cT (X T X)−1 c
(4.16)
we can assess the hypothesis H0 by comparing Tj with a Student’s t distribution with M − p degrees of freedom. This is our Statistical Parametric Map, where cT β j = 0. Figure 4.6 shows what this looks like in 3D and 2D.
4.3.2
Statistical inferences
Since the null-hypothesis H0 was cT β j = 0, H0 is true for � � ˆj cT β < t1−α = 1 − α, P � σ ˆj2 cT (X T X)−1 c
(4.17)
where t1−α denotes the (1 − α) quantile of the t-distribution with M − p degrees of freedom. Hence, any voxel that satisfies this is a non-active voxel and any voxel that does not satisfy this is an active voxel, with the probability 1 − α per voxel. This is the so called one-sided t-test. If α = 0.05, we get a confidence interval of 95%. A problem arises due to the univariate analysis being performed on the multivariate data. There is a chance of 5% that we reject H0 when it is true for each voxel. However, a 3D image has many voxels and with 500000 voxels about 25000 of them are rejected by chance3 . Figure 4.7 shows the result in effect. This figure consists of 318 × 198 white or black dots and the chance for each dot to be set to black is 5%, i.e., the same chance as the false rejection of H0 . If the voxels were independent, we could use the Bonferroni correction. This is a straight forward solution, where the overall test remains at 0.05 but where α = 0.05/N for each voxel and where N is the number of voxels. However, some voxels are very likely to have a strong dependence and the Bonferroni correction would in this case make the analysis very insensitive (Ledberg, 2001). This is called the multiple comparison problem. An area where all neurons and synapses perform a co-operative computation is called a functional field according to the cortical field hypothesis (Roland, 1993). The hypothesis postulates that the field is the largest functional element and together, these fields are the largest functional entities of the cerebral cortex. Hence, within 3
The actual number of falsely rejected voxels is probably smaller since the voxels are not independent, but the test itself cannot promise a better result than this.
28
Figure 4.6. T-image in 3D view (upper) and sagittal view (lower). White areas show higher values while darker areas show lower values.
such a field there is a strong correlation between the voxels that are measured. We would like to find these fields of activated regions, rather than just the voxels. Gaussian random fields Finding fields of activated regions can be done by using a cluster based statistical analysis method, based on the theory of Gaussian random fields developed by Adler and Hasofer (1976) and Adler (1981).
29
Figure 4.7. Falsely rejected H0 shown as black dots.
A stationary Gaussian random field Z with dimension d is a stochastic process {Z(u) : u ∈ D}
(4.18)
where D is a subset of Rd , having the mean function m(u) = E(Z(u)) = 0
(4.19)
and covariance function r(u, v) = Cov(Z(u), Z(v)).
(4.20)
The Gaussian random field has also the property that all the values (Z(u1 ), Z(u2 ), ..., Z(un )) are jointly normal, where the distribution is determined by its mean and covariance functions. We want to consider the noise in the statistical image as a Gaussian random field. Given that we have no signal in the image, we can consider the values in the T image as noise. The values are then random and we consider them to have a Student’s t distribution with M − p degrees of freedom. By finding the p-values for the given t-values, and for these p-values the corresponding z-values, we obtain a corresponding Z image and consider it to be a stochastic process of random variables {Z(u) : u ∈ D} where D is a subset of R3 . Hence, according to (4.18) we consider Z as a Gaussian random field in three dimensions. Z will have a covariance function which depends on the FWHM of the spatial filter used when preparing the data. A discrete random field X is obtained by thresholding a Gaussian random field at one or several fixed levels. Here, we will only threshold at one level and thus consider X as a discrete binary random field. 30
Figure 4.8. Euler characteristic of a surface
Euler characteristics Consider the polyhedron in figure 4.8. It has 6 vertices (V ), 9 lines (L) and 5 regions (R) (we also count the outside as a region). If we calculate V − L + R we get the answer 2. Even if we add more lines and vertices, the number V − L + R will always be 2. This number is called the Euler characteristic of a surface. In general, the Euler characteristic is calculated as
χ = p0 − p1 + p2
(4.21)
where pi is the i:th Betti number. In the case of a discrete binary random field in three dimensions, p0 is equal to the number of connected components, p1 is equal to the number of holes and p2 is equal to the number of hollows. At a given threshold, the holes and hollows will disappear and we will only count the isolated regions in the image. Hence, the Euler characteristic of a discrete binary random field will tell us the expected number of clusters for a certain threshold when the threshold value is high. For instance, a value of 0.05 tells that we should expect to get five clusters in average when looking at 100 such random images (being independent from each other). Another way of looking at it is to say there is a 5% chance that we get one or more noise clusters in one random image.The chance of getting any Z higher than 31
z from a Gaussian random field is calculated by using Euler characteristics as � ∞ 1 2 P(max Z > z) ≈ e−u /2 du + 1/2 (2π) z � Vy Vx Vz (4 log 2)1/2 −z 2 /2 e + + + + ωx ωy ωz 2π � Vy Vz V x Vy Vx Vz (4 log 2) −z 2 /2 + + e z+ + ωx ωy ωy ωz ωx ωz (2π)3/2 � Vx Vy Vz (4 log 2)3/2 −z 2 /2 2 e (z − 1) (4.22) + ωx ωy ωz (2π)2 where Vx , Vy , Vz correspond to the number of voxels in the x, y, z directions and ωx , ωy , ωz correspond to the FWHM counted in voxels (Worsley et al., 1996). 1200 line 1
1000
800
600
400
200
0
-200 0
1
2
3
4
5
6
0.2 line 1 0.18 0.16 0.14 0.12 0.1 0.08 0.06 0.04 0.02 0 5
5.2
5.4
5.6
5.8
6
6.2
Figure 4.9. Euler characteristics
Figure 4.9 shows P(max Z > z) given a FWHM of 6 mm and a 3D image having the volume 185×150×141 mm3 . At a high threshold such as z = 5.28, the expected 32
number of clusters from Gaussian noise becomes as low as 0.05 and we can use this value as our corrected p-value. With a simple Bonferroni correction, P(max Z > z) ≤ N P(Z > z)
(4.23)
where N is the number of voxels, the corresponding p-value at the given z threshold level is 0.25. Hence, Euler characteristics does a better job of finding the corrected pvalue than the Bonferroni correction which is too conservative. Another interesting thing to notice is what happens at lower thresholds. At z < 1.674, the number of expected clusters will decrease as z gets lower. This means the random clusters are merging together. Another way of using Gaussian random fields is to do an arbitrary threshold, then use Euler characteristics to find out how significant each cluster is (Friston et al., 1994). In this case, there will be a relationship between the cluster size and the p-value. Big clusters will be more significant that small clusters. Clusters having a low significance level are removed from the final cluster image. The problem with this analysis is the arbitrary nature of the initial threshold. Since we do the statistics on a cluster level, we do not care about the significance level of each individual voxel. Hence, we choose the threshold arbitrarily. If we choose a high threshold, we will get smaller clusters. However, a small cluster will be more significant at a high threshold. Choosing the right threshold level is difficult. If we get small clusters with high z-values, we probably need to use a high threshold in order to say that the clusters are significant. If we get big clusters with low z-values, we need to lower the threshold. There is no default threshold value which is good for all kinds of studies or contrasts. This alternative method is better to use if we have large clusters with low values, since we can lower the threshold and do not have to care about getting random clusters, as they will probably be small and not significant. However, we can notice from figure 4.9 that the method starts to break down at z = 1.674 since the random clusters will begin to merge. Hence, there is no point in lowering the threshold value beyond this threshold level. The random noise in our activation image has a t-distribution, but it is easy to transform the distribution to a Z-distribution in order to apply the Euler characteristics. For each t-value with v degrees of freedom there is a corresponding p-value, and for each p-value we can easily find the corresponding z-value.
4.4
Intersection analysis
When two statistical cluster images from two different studies overlap, one could make the assumption that the overlap is a functional field which activates in both studies. It may be impossible to find this functional field by looking at one study alone. However, to make a quantitative measure of this overlap in order to see if it is a functional field, one would need many more studies overlapping the same region and statistical tools that make it possible to test the region’s reproducibility. 33
The problem with this kind of analysis is that we do not know how large the overlap must be in order to say that it is significant. My proposal to make the analysis more strict is to add the following criterion: Two clusters overlap if and only if the peak z value of each cluster is within the extent of the other cluster. Even though it still does not give us a statistical measure of how significant the overlap really is, it will most certainly give us a more significant overlap compared with defining a criterion based on the degree of overlap since the latter will depend on several factors such as z-threshold and FWHM.
4.5
Talairach space
A significant problem when mapping the human brain is the fact that there is a difference in shape and size of the brain between individuals. Most studies are group studies, and for PET analysis it is not even possible to do the analysis on one subject alone. The signal to noise ratio is too low. We want to match several brains by doing some sort of spatial normalization to a template brain. One way would be to use a warping method that aligns the sulci and gyri between two brains, another to just match the size and the outlines of the brains (Thompson and Toga, 2000). Although a sulci/gyri match might look as the perfect choice at a first glance, it is not clear that this method is the best as many functional areas might not be related with anatomical regions (Brett et al., 2002). The normalization is often done to a template based on the stereotaxic atlas published by Talairach and Tournoux (1988), also referred to as the Talairach brain. Three innovations were introduced with this atlas: a coordinate system, a simple spatial transformation so that any brain could be matched to the Talairach brain, and an atlas with anatomical and cytoarchitectonical labels. The impact of this atlas in the field has been huge. Yet not all templates are exactly spatially transformed to this coordinate system. The most common template brain used in the field today is the ICBM152 template from the Montreal Neurological Institute (MNI). It is based on 152 brains and is provided with several analysis packages, such as SPM99 (Wellcome Department of Imaging Neuroscience) and FSL (FMRIB). These brains were registered to the first MNI template, the MNI305. This template was scaled to the Talairach brain at a first stage. Thus, the ICBM152 is based on the Talairach brain. Still, they do not have exactly the same size and shape. These coordinates are often referred to as Talairach coordinates in MNI space, which is a little bit confusing and can lead to significant errors if one wishes to use the Talairach atlas in order to label coordinates in the ICBM152 template without taking this into account. In PET, it is necessary to normalize since the analysis has do be done across subjects to get any significant result but in fMRI it is often not necessary. The first analysis in fMRI is done at a session or subject level, but it is very common that a 34
higher level analysis is performed across subjects in order to do a group study. In this case, it is necessary to normalize.
4.6
Paradigm design
We will end this chapter by looking at different designs for an experiment. More information about experimental designs can be found in Frackowiak et al. (1997).
4.6.1
Block related design
PET experiments do not allow changing the condition during a scanning session. This is because of the temporal resolution: a session in PET is equal to one volume and one volume has typically a duration time of one or two minutes. Since a condition often has a duration time of just a few seconds, it is repeated many times during the scanning session. Each repetition is called a trial. Since we have a block of trials for each condition, we call this kind of experimental design as being a block related design. PET experiments are always block related designs. Block related designs are also used in fMRI experiments. Since fMRI has a much higher temporal resolution, it is common to have several blocks within a scanning session. As in PET, the same rule for a block is applied for fMRI block designs, i.e., the trials within a block are of the same condition. However, the trials between two blocks in one scanning session may have different conditions. In PET, the duration time of the block is the same as the actual scanning session. In fMRI, a typical duration time for a block is about 30 seconds. A rest period is often applied between blocks, referred to as the baseline of the session. It is quite common to have the same duration time for the rest period. Since blocks in fMRI often have a shorter duration time than in PET, the number of trials are typically less compared to PET blocks.
4.6.2
Event related design
Event related designs can be seen as blocks of short duration time having one trial only. Hence, it is not possible to do event related design in PET. Since the temporal resolution in fMRI allows for event related design, this design method is getting quite common in fMRI studies. It opens for new designs where different conditions are close to each other in time.
4.6.3
Parametric design
Studies having a condition with different levels of stimulations are often parametric designs. A parametric design requires the condition to be divided into separate conditions for each stimulation level. Hence, it is not only possible to estimate the brain activations for each separate level of stimulation. It is also possible to measure the effect between these conditions. 35
Say we have an experiment having three levels of stimulations, S1 , S2 and S3 , where S3 has a higher level of stimulation than S2 and S2 has a higher level of stimulation than S1 . We could expect a greater activation response when we have a higher level of stimulation. The contrast S3 − S2 will look at where the activations are greater in S3 than S2 . The contrast S3 − S1 will look at the general increase of activations between the three tasks (given that S3 gives more activations than S2 and S2 gives more activations than S1 ). If there is a non-linear relationship, for instance if S3 gives a lower activation level than S2 , even though S2 gives a higher activation level than S1 , we can test it with the contrast 2S2 − S3 − S1 .
4.6.4
Factorial design
If we want to test the effect of the interaction between two factors, we have a factorial design. Each factor is modeled as a condition and the interaction is modeled as a third condition. Say we have a study in which one factor is softness and the other is temperature. For each factor we have two different levels. The levels for the softness factor are soft and hard. The temperature factor has the levels cold and warm. This kind of design is called a 2 × 2 factorial design. It can be written as yi = β1 xi1 + β2 xi2 + β3 xi1 xi2 + �i
(4.24)
where xi1 is the softness factor (0 for soft, 1 for hard), xi2 the temperature factor (0 for cold, 1 for warm), and xi1 xi2 the interaction between softness and temperature (1 for warm and hard, otherwise zero)4 . For the four cases, we get four different equations and can look at contrasts between them (for instance warm and hard versus cold and soft). However, it is more common that each condition has its own explanatory variable to make things clearer. In this case, we will end up with a design matrix with rank deficiency which must be dealt with before we use the ordinary least squares method.
4
Here we have simplified the linear model a little bit by excluding the convolution with the hemodynamic response function.
36
Part II
Developing tools for human brain mapping
37
38
Chapter 5
NeuroGenerator The first part of this thesis explored the methods used in human brain mapping for analyzing PET and fMRI data. Finding common denominators for brain regions across experiments would be the next step in this process. One study reveals just a few functions for some regions while they are probably contributing to many more functions, together with other regions in a larger network. One laboratory does not have enough studies to draw such conclusions. It might be possible to compare published reports from different laboratories, but the statistical images are needed to make more general conclusions about the functional contributions for a set of regions. Even then it might be difficult if the statistical analyses are different for different statistical images. NeuroGenerator is a project which solves these problems by collecting the raw data from several laboratories around the world and processing these data in a homogenous way. The results are databases with statistical results from the same statistical tools. Hence, it is possible to compare the results from two studies and make new conclusions, for instance by looking at their overlap (Roland et al., 2001).
5.1
Experiment structure
The NeuroGenerator database stores the entire experiment structure with a detailed description of each condition in the experiments. This allows the database to create the statistical analysis of an experiment automatically. The highest level in the database is the experiment itself. Each experiment has a set of conditions (each condition definition describing a trial of it) and a set of subjects. To this comes the actual interpretation of the experiment, which is described in terms of contrasts. The conditions is described in terms of events. An event can either be a stimulus, think or response event, and it has a set of keywords which describes it. Hence, a condition can describe several tasks being performed during a period of time. Many studies have very complex effects to be modeled, like working memory, and it is thus necessary to allow complex models of the conditions. 39
The subjects, i.e., the volunteers for the study, are described with gender, age and handedness. A subject has typically been involved in many scanning sessions, where each session might have a duration time of several minutes. The duration time of the session depends on the experiment setup. Each experiment has often only one interpretation, containing a set of contrasts. Each contrast is described as a sum of conditions, where each condition contributes with a positive or negative regressor. The positive conditions are often referred to as experimental conditions, whereas negative conditions are called control conditions.
5.2
Processing chain
The processing chain is designed to automatically analyze the experiments from the database. It uses the methods described in the statistical neuroimaging chapter.
5.3
Images and metadata
The NeuroGenerator project developed a new image format in order to do fast queries on images. Since the statistical results are functional areas rejecting the null-hypothesis, we can regard the results as binary (either an area rejects the nullhypothesis or not) instead of storing each voxel as 16 bits. Tests performed show that the overlap queries become 16 times faster, since the images are 16 times smaller in size and do not require any extra calculations per voxel. The connection between the statistical images and the experiment structure allows the users to make combined queries on images and metadata. A statistically significant functional region is related to the contrast and the conditions forming the regressors for this contrast. Since each condition is related to keywords on the event level, it is possible to classify regions with keywords.
40
Chapter 6
Developing a visualization and query tool The visualization tool for the NeuroGenerator database is the front end of the database, hence the final step in the processing chain where analyses across experiments are being made. This tool should assist the scientists to analyze and interpret the results of the statistical analyses from several experiments at the same time, making it possible to compare studies and make new findings. The tool should also make it possible to query the database on both images and metadata. The assignment of the Master’s project is to develop a prototype of this tool. The conclusions found in this chapter is the outcome of this development model. I came to the conclusions myself, but had help with understanding not only what the tool should contain but also the field in whole from colleagues at the Karolinska Institute. It should be said that most of the conclusions came while the prototype was evolving. Writing down all the features in detail before is simply not possible. This chapter starts with a section about common visualization techniques in the field. It continues with a discussion about the requirements for the tool. Finally, it ends with the conclusions.
6.1
Common techniques
Visualization of the brain can be done in many ways. One of the most common visualization techniques used in the field is to show the 3D image in its axial, coronal, and sagittal directions, one slice at a time. An anatomical MR image is used as background to the statistical image, and the statistically significant activities are shown as colored regions. Another way is to view the brain as if it was made of glass by just drawing the edges of the brain and the significant activations in all directions. Both these methods are used by SPM99, as shown in figure 6.1. 41
Figure 6.1. SPM99 Visualization.
6.1.1
3D visualization techniques
A common way to visualize 3D images is to do some sort of volume rendering. Volume rendering allows us to look at the whole brain and its interior, and not slice by slice, by making it half transparent. The activation regions can be rendered together with the anatomical image. Another way is to construct an isosurface from a 3D field of values. An isosurface is a 3D contour of the 3D field where all the voxels have a given constant value. If all the voxels belonging to the brain are given the same value, an isosurface would render the surface of the brain. Activation regions can be rendered with the same method.
6.1.2
Ray casting
Ray casting is one way to do volume rendering without the need of 3D accelerated hardware. Rays are cast for each pixel from a projection plane through the volume. For each voxel the ray accumulates the transparency and color from the voxel value and the calculation is stopped when the ray has reached a certain property or left the volume.
6.1.3
Hardware texture mapping
Another way of doing volume rendering is to project each slice of the volume on the projection plane, starting with the most distant plane and ending with the nearest. This technique is especially useful if the computer has 3D acceleration in hardware. Each slice is then drawn as a texture mapped polygon, where each pixel in the texture map has a color and a transparency value (red, green, blue, and alpha channel).
6.1.4
Isosurface rendering
One of the most famous techniques used to do isosurface rendering is known as the marching cubes algorithm (Lorensen and Cline, 1987). This algorithm localizes 42
the voxels in the volume containing a surface and constructs a set of polygons that depends on the configuration of the vertices. Each voxel has eight vertices, and each vertex can either be outside or inside the surface. Thus, there are a total of 28 = 256 different combinations that need to be considered. However, due to symmetry they can be reduced to 15 unique cases. Another technique is to reconstruct the surface by wrapping a recursively tessellated icosahedron (an approximation of a sphere) around it. The icosahedron can be built with 20 polygons and is a rough approximation of a sphere (Woo et al., 1999). By dividing each polygon into four polygons, a better approximation is done. This technique is used by the analysis and visualization tool BrainVoyager (Brain Innovation B.V.).
6.2
Requirements
6.2.1
Comparing methods
The analysis done so far has resulted in a number of statistical images. To be able to interpret the result with a visualization tool, it seems natural that this tool should in some way reflect the processing chain that gave the statistical result. Say we have two different kinds of processing chains, one doing a univariate analysis and the other doing a multivariate analysis. If these two processing chains have done their analysis on the same experiment, it should be possible to compare these methods in the visualization tool. The simplest application would be to visualize the two results and their overlap. This way to analyze the results from the statistical analysis is also applicable when comparing statistical clusters from the contrast but with different confidence intervals. Say one cluster image rejects the null hypothesis H0 (which says there is no activation) with a confidence interval of 95% while the other rejects the null hypothesis with a confidence interval of 99%. It it interesting to see how much these two results differ from each other.
6.2.2
Intersection analysis in the visualizer
Intersection analysis was discussed in 4.4 as a method to evaluate if two clusters overlap the same functional field or not. Given that we have found two or more clusters overlapping the same region, the visualization tool should at least be able to show in an early stage that there might be reason to investigate the region further. From this, it might be possible to make the hypothesis that this indeed is a functional field. This requires that the clusters have been calculated with the same p-value, the same filter size and with the same processing chain (Roland and Zilles, 1998).
6.2.3
Population maps
Say we have 15 images having the same overlap. How should their result be visualized? The easiest way would probably be to make a population map which shows 43
how large the overlap is in each voxel. Hence, it should be possible to query the database for the sum of the given set of images.
6.2.4
Color maps
Even though the cluster images could be regarded as binary, it is very common to visualize the t-values for the voxels in these images. Hence, the visualization tool needs to be able to visualize these different values not as one color but as many different colors. This is also the case for any kind of population map. One way to visualize such a map could be to show low values in a dark color and higher values in a light color. This could be done by applying a function which returns a red, green and a blue value given an input value. This function is called a colormap. Colormaps are also useful for the template image, i.e., the anatomical image used for orientation. One may want to visualize all gray matter as red and all the white matter as blue to really distinguish between these areas in the brain.
6.2.5
Views
2D view We have already concluded that the normal way to visualize the brain is in its axial, sagittal and coronal directions. Figure 6.2 shows these three directions of my own brain which was scanned at the MR Center (Karolinska) in the beginning of December 2002. It is quite often enough to visualize the brain in these directions, but for some anatomical structure, such as the primary somatosensory cortex, it might be better to be able to choose any direction, for instance something in between axial and coronal. A 2D view can be seen as a slice from the 3D image. Orienting in this slice is easy since it is possible to click on a certain voxel of interest and get feedback about its coordinates. These coordinates are in the Talairach coordinate system if a Talairach standard brain is used as template.
3D view Some anatomical structures are best visualized in 3D such as gyri and sulci which are structures seen on the cerebral cortex. Hence, it is possible to see where on the cortex these activations are without the need to look at (and interpret) many slices. With a transparent view, activations that are not lying on the cerebral cortex may also be visualized in the 3D view. However, there is a localization problem in the 3D view which is not easily solved. Even though it is easier to locate gyri and sulci, it is not easy to locate a certain voxel of interest that is not lying on the cerebral cortex. 44
Figure 6.2. Upper left image: axial direction. Upper right image: coronal direction. Lower image: sagittal direction.
Localization issues It is common that researchers publish their findings in Talairach coordinates. In a muscle pain study by Niddam et al. (2002), the hemodynamic response increased during painful IMES (Intramuscular electrical stimulation) and decreased during nonpainful IMES in some areas in the brain, including the middle frontal gyrus and the precentral gyrus in the frontal lobe. The coordinates in which the Z-statistics (or t-statistics) of these areas reached its maximum value in the right hemisphere are shown in table 6.1. Say we are in particular interested in the activation in the Structure/anatomy Middle frontal gyrus Precentral gyrus
x 32 44
y 42 10
z 16 7
Table 6.1. Some coordinates from the painful versus nonpainful IMES contrast.
precentral gyrus (motor cortex) and want to locate the same area in the visualization tool. Then it is apparent that the visualization tool needs to provide an easy way to locate this coordinate. A problem arises from the fact that MNI template coordinates are not the same as Talairach coordinates (see section 4.4). However, many results are published in MNI space, including the ones in table 6.1. These coordinates are often referred to 45
“MNI coordinates in Talairach space” which is a contradiction since MNI coordinates are not the same as Talairach coordinates (Brett et al., 2002). Hence, since these coordinates are in MNI space rather than Talairach space, it should be possible to perform a transformation between the two coordinate systems in the visualization tool.
6.2.6
Atlases
Atlases, such as the cytoarchitectural atlas from Karl Zilles group (Zilles and PalomeroGallagher, 2001), are very useful when localizing activations in the brain. One may want to see if an activated region in a study overlaps a certain area in order to conclude if this area was activated. The tool should be able to show this information.
6.2.7
Volumes of interest
The user should be able to define own volumes, so called volumes of interest (VOI). A very simple kind of VOI is a 3D sphere. It is easy to create since the user only needs to provide a coordinate and a radius. VOIs can also easily be created from other primitives such as a cube, cylinder or a pyramid. A more general VOI than a cube or a pyramid is to let the user define eight arbitrary coordinates that the VOI should be built from. From these eight coordinates, it is possible to create both types of VOIs as well as several others. A cylinder requires two coordinates and a radius, hence easy to create. If the user can use simple image processing such as boolean operations on images, it is possible to create more advanced VOIs. Say we have two images A and B (figure 6.3). With the AND operator the overlap between A and B is created while the OR operator will merge A and B (figure 6.4). A NOT B will remove the overlap between the images from A, and B NOT A will do the same thing from B (figure 6.5). The NOT operator is not commutative, so the result A NOT B is not the same as B NOT A. Finally, XOR will merge two images but remove their overlap (figure 6.6).
Figure 6.3. Image A to the left, image B to the right.
46
Figure 6.4. A AND B to the left, A OR B to the right.
Figure 6.5. A NOT B to the left, B NOT A to the right.
Most VOIs are binary images, but real valued VOIs may also be of interest. A Gaussian sphere is a sphere where the values are calculated as 2
e(−r−µ) /(2σ √ v= σ 2π
2)
(6.1)
where r is the distance from the origin of the sphere. µ and σ controls the intensity of the sphere at distance r. Real valued images can be added together or subtracted from each other (this is also true for binary images if they are considered as real). A real valued image can be converted to a binary image by thresholding it. It should also be possible to free draw the VOI slice by slice, just like in a drawing program.
6.2.8
Database interaction
Finding the activation regions is more easily done if the visualization tool facilitates queries on both images and metadata. Hence, it must communicate with the database and allow the user to interact with the contents of the database. The detailed experiment structure must be revealed in this interaction. A general tool being able to do some interesting queries on images and metadata will also be able to do other kind of queries. Below are four typical queries which the visualizer should support. 47
Figure 6.6. A XOR B.
Population map from metadata An event has keywords describing what is happening during the event. If the event is a visual event it will have visual keywords, for instance the keywords “stimulus/visual/character/pattern/gratings” and “stimulus/visual/movement/moving” if the visual stimulus is a grating image that is moving. We would like to make a population map of all the statistical images with a certain spatial filter size and confidence interval which have conditions associated with these keywords. We would also like to tell if the conditions, regarded as regressors in the analysis, should contribute to the statistical images in a positive or negative way. The conditions we find will probably have other keywords too, for instance motor response keywords. “Visual” will however be the common factor for all the conditions. Hopefully, we will get a population map having its highest population in Brodmann areas 17, 18 and 19, i.e., the visual cortex. We would especially like to find activations in area V5, which is involved in visual motion detection. Population map of activations from VOI Given a user defined or predefined volume of interest (VOI), we would like to get all the functional regions found in the statistical analyses with a certain filter size and confidence interval and have it returned as a population map. We will then be able to see all the functional regions in the database that are overlapping this VOI and which voxels they represent the most (these voxels are not necessarily inside this VOI). Metadata search from thresholded population map Given any population map, say from either of the two examples above, we would like to threshold it to get rid of regions which are only reproduced by a few statistical images, then classify the regions which the thresholded map represents. This could be done by finding the contrasts, then the conditions contributing to these contrasts, and finally counting the keywords for these conditions. Say the thresholded population map represents area V1 (Brodmann area 17). First we 48
find the contrasts representing the thresholded population map, then the conditions contributing to the contrasts as positive regressors. These contrasts will inevitably have other regions as well. If the positive condition for one of the contrasts is a “read aloud” condition, we will not only have activations in area V1 (vision) but also in Wernicke’s area (speech recognition), Broca’s area (speech production), and the motor cortex. We can see the other areas as coactivated areas to V1. Hence, this condition will have keywords associated with all the tasks necessary to read aloud, among them keywords that are not associated with area V1 (for instance “mouth movement”). However, since area V1 might be the only area that is activated in all these contrasts, “visual” keywords will indeed be counted many times while “mouth movement” will only be counted once (unless we have more than one contrast where the task involves both speech and vision). Neural network search from VOI The previous example with the “read aloud” condition revealed a network from the visual cortex to the motor cortex. If we want to find all regions being coactivated with a certain region in the brain, we start with finding all the regions overlapping our volume of interest. As before, the contrasts which are related to these regions will have other regions too. Choosing all these regions, with a certain filter size and confidence interval, and obtain the population map from them will reveal a network of all regions being coactivated with our volume of interest from all studies in the database.
6.3
Conclusion
The conclusion from the discussion above is that the tool should provide these features: • Show unlimited overlays and their overlap • Provide simple image processing • Visualize both binary and non-binary overlays • Choose the overlay color from several color maps • 2D & 3D view, with contrast stretching • Atlases • MNI/Talairach transformation • User defined volumes of interest • Interaction with database
49
Chapter 7
Results The aim of this Master’s project was to develop a prototype of a visualization and query tool and find what requirements such a tool should have. The final version of the tool is called NG-Viz. This chapter starts with a description of the 3D visualization part and how it was developed, then continues with a presentation of the current version. It ends with looking at some use cases.
7.1
Early versions
7.1.1
Platform
The tool was developed on a FreeBSD Unix system. The hardware was a Compaq Armada M700 laptop with 128 MB of memory and an ATI Rage Mobility Pro graphics adapter. This graphics adapter is one of the first adapters with 3D graphics in hardware for laptop computers and should be considered low-end. It is compatible with the ATI Rage Pro graphics card for desktop computers and has 8 MB of memory which is used for the Z-buffer and the pixel buffer. It uses the primary memory and the AGP bus for textures. The 3D rendering library Mesa3D (www.mesa3d.org) and the ATI Rage 3D hardware driver Utah-GLX (utah-glx.sourceforge.net), both Open Source projects, were used to render the 3D graphics in real time.
7.1.2
3D view
It was obvious that a 3D view would be very useful in combination with 2D views to locate anatomical structures in an easy way. Since a 3D view can visualize the activations as overlays on the cerebral cortex, it gives a quick and powerful view of the statistical result. However, it was not obvious that this could be done on a PC. 3D visualization can be very demanding and the goal was to make the 3D view to render the brain in real time. It must not take seconds for it to render the brain. The very first version used GLUT and OpenGL. The idea was to draw 64 texture mapped polygons very close to each other in order to get a 3D image. Each polygon 50
had a corresponding slice in the anatomical MR image. The textures were rendered in RGBA mode, which means that each pixel has a red, green, blue and an alpha value. The red, green and the blue values were all set to the same value, i.e., the value of the anatomical MR image (but normalized between 0 and 255). The alpha value tells how much the transparency is, i.e., how much one should see of the pixel behind this pixel. The alpha value was set to be one (not transparent) when the value of the MR image was higher than a certain threshold, and otherwise is was set to zero (totally transparent). Figure 7.1 shows eight images on top of each other without any transparency. Figure 7.2 shows what happens when the parts outside the brain are set to be totally transparent. Figure 7.3 and 7.4 show the same effect with more slices (16 and 128 slices). The result shows that real time volume rendering is possible even with an inexpensive low end graphics card.
Figure 7.1. Eight slices, not transparent.
7.1.3
GTK
GLUT is very useful when developing applications which do not demand an advanced graphical user interface, but since GLUT does not include user interface widgets such as buttons or text fields it is better to use a more advanced user interface library. Hence, I decided that the visualization tool should be written as a GTK application (www.gtk.org) with the GtkGLArea extension. The C++ wrappers for GTK and GtkGLArea was used since the tool was written in C++. GTK is an API which allows the programmer to use many kind of user interface widgets such as menus, windows and buttons. GTK is also used to visualize the 51
Figure 7.2. Eight slices, thresholded.
brain in 2D. GtkGLArea is an OpenGL wrapper for GTK making it possible to use OpenGL graphics in a drawing widget.
7.2
Current version — features
We ended chapter 6 should contain. We the tool can do. An rendering window is windows.
7.2.1
with some conclusions of what a visualization and query tool will look through these conclusions to get an image of what overview of the whole desktop is shown in figure 7.5. The 3D the main window from which the user can reach all the other
Show unlimited overlays and their overlap
The visualization tool can show many overlays at the same time. All the overlays are loaded into an image table showing the transparency level of each overlap and the order of visualization (see figure 7.6).
7.2.2
Choose the overlay color from a number of color maps
The user can decide the color map for each overlay from the image table. Some color maps are simple and contain only one color (such as red, blue, green etc), while others give a range of colors depending on the value of the particular voxel for the overlay. The latter kind of color maps is useful when visualizing population maps. The image table in figure 7.6 has two images loaded with two different color maps, red and jet. 52
Figure 7.3. 16 slices, thresholded.
7.2.3
Visualize both binary and non-binary overlays
Binary overlays are images with only values of 0 or 1. The image table will show if an image is a binary image or not by adding “Bin” in the max/min value columns (see figure 7.6). There is no other distinction between real valued images and binary images. However, the query part of the tool can only use binary images as volumes of interest. Hence, a real valued image must be converted to a binary image before one can use it in a query.
7.2.4
Provide simple image processing
The image table has a number of different image processing functions, using the images in the table as arguments. These are: • Boolean OR: Creates the union between two images • Boolean AND: Creates the intersection between two images • Boolean NOT: Creates the binary complement for one image • Binning: Creates a binary image from a real valued image, given an upper and a lower limit • Make binary: Creates a binary image from a real valued image, given a lower limit • Make surface: Creates the surface of a binary image, thus making it possible to visualize the border of an image 53
Figure 7.4. 128 slices, thresholded.
7.2.5
2D and 3D view, with contrast stretching
The user can open up many 2D windows at the same time, which by default work independently of each other. However, it is possible to set each window to follow the main crosshair shown by the 3D view. A change of the crosshair in one window will then update the other windows so that they all show the same Talairach coordinate. A 2D window shows the brain in its axial, coronal or sagittal direction (see figure 7.7). Figure 7.8 shows the effect of contrast stretching in a sagittal window. The contrast stretch is controlled by the two sliders found at the bottom of the window. The user can also force values higher than the upper setting to become black (the effect of this is seen in the lower right image of figure 7.8 where white matter is excluded from being shown. The tool has only one 3D view. The 3D configuration window tells how the view should be rendered. Besides the contrast stretch sliders, there are also two other sliders setting the transparency level of the highest and lowest values that are shown (set by the contrast stretch sliders). From this, the tool calculates the transparency level linearly for all values between these two. The effect of different contrast stretch and transparency settings is seen in figure 7.9.
7.2.6
User defined volumes of interest
The user can create own volumes of interest. Only a spherical volume of interest can be created in this version. This is done by specifying the origin and extent of the sphere with the crosshair in a slice window. 54
Figure 7.5. The desktop showing all the windows.
7.2.7
Atlases
The cytoarchitectural atlas from Karl Zilles and collegues (Zilles and PalomeroGallagher, 2001) is included in the visualization tool. Each slice window shows which cytoarchitectural area is represented in the voxel pointed out by the crosshair, together with a value showing the number of cytoarchitectural subjects (in per cent) for this area and voxel, interpolation effects1 taken into account.
7.2.8
MNI/Talairach transformation
The MNI/Talairach transformation was never implemented. Even though it would be an interesting feature, it is not a vital function for the visualization tool since the standard brain used in the NeuroGenerator database is indeed in the Talairach coordinate system. Still, it might be a nice feature to add in a future version since scientists might want to compare their volumes in MNI space with activations in NeuroGenerator. 1
Each area on subject level is binary but the normalization to the standard brain imposes interpolation effects, i.e., voxels at the border of the area get values between 0 and 1.
55
Figure 7.6. Image table.
7.2.9
Interaction with database
Early versions were concentrated on visualization and did not have any connection to the NeuroGenerator database. The current version has a dedicated database window which interacts with the rest of the tool. The user can query the database using volumes of interest and visualize population maps of statistical images from the database. Four important features make the database queries powerful: • Search in table • Search within result in table • Jump between tables, i.e., transfer result from one table to another • Boolean operations (AND, OR, XOR) on tables of the same kind Search in table In most query tables, a search can be conducted within them using criteria related to the specific table. For instance, volumes of interest will be used as criteria when searching for activation regions and keywords will be used as criteria when searching for contrasts. Search within result in table In some cases, a complex query might need to be divided into two queries (or more). An example of this is to find statistical images having an overlap with Broca’s area and primary visual cortex. The tool cannot do this query in one single SQL-query to the database. However, the user can search within previous results. Hence, the given query will be divided into two queries: first find activations overlapping Broca’s area 56
Figure 7.7. Three different views showing the same Talairach coordinate.
and from this result find which of the activations that also overlap the primary visual cortex. Boolean operations on tables We want to be able to look at the union or the intersection of results between tables. This is solved by the table handler, which can calculate the intersection (AND), union (OR), and the unique rows of a set of tables (XOR). See figure 7.10. Jump between tables The user can take the result from one table to another. Doing this from a selection of contrasts from the contrast table to the clusters table will show the clusters for these contrasts. Since the contrast table is specialized in event keyword queries (for instance finding clusters associated with “somatosensory” keywords), it is possible to take the result from this table and use it in other tables. The tables used in the tool are: • Experiment • Keyword • Contrast • Contrast element • Experiment level: Clusters image • Experiment level: Cluster 57
Figure 7.8. Effect of contrast stretch with different settings.
• Experiment level: Z-image • Subject level: Clusters image • Subject level: Cluster • Experiment level: Z-image • Cytoarchitectural regions as population map • Cytoarchitectural regions on subject level • Condition • Event • Subject 58
Figure 7.9. Effect of different settings in the 3D view, displaying cytoarchitectural area 1.
• Session • Repetition Describing each individual table would require many more pages and is beyond the extent of this Master’s thesis. Instead, we are going to seize the essential part of the query system by looking at some use cases below.
7.3
Use cases
The examples below shows some simple use cases of how to use NG-Viz to query the database and visualize the results. These should merely be seen as examples and not as results from a neuroscientific point of view.
7.3.1
Find clusters having activation in motor area 6
As described in the intersection analysis section of chapter 4, one would need advanced statistical tools to make a quantitative measure about the overlap between two clusters from two different studies. The same is of course true if we want to find clusters having their activation in a certain cytoarchictectural area, such as area 6. Even though we do not have these tools, we can use the criterion defined in chapter 4, saying that the overlap between two clusters is most probably significant if the peaks of each cluster are within the overlap volume. Motor area 6 is in this case a binary mask, i.e., it has no peak. Hence, in this particular case we just say that the peaks of the clusters must be located within area 6 in order to activate this area. Figure 7.11 shows the result from the query. 59
Figure 7.10. Boolean operations on tables.
7.3.2
Visualize peaks from result
The visualization tool can also show the peaks of the clusters. Since the peak is by definition the most significant voxel within each cluster, it is quite interesting to look at how the peaks are located for a given set of clusters. Figure 7.12 shows two peaks for a specific slice. These peaks are close to each other and might look like one peak. This feature is useful when slicing through the brain.
7.3.3
Find and visualize co-activated clusters
The clusters found so far are of course not the only activations found from the given contrasts. By looking at all the clusters from all the contrasts, we can get a view of the co-activated clusters. The result is shown in figures 7.13, 7.14 and 7.15. The white regions are here all clusters activated given these contrasts, while the black area shows area 6.
7.3.4
Get a list of event keywords associated with a list of clusters
Given these clusters, we would like to look at the keywords defined at the event level for all the experimental conditions (conditions being a positive regressor in the contrast vector) and count them to get a view of what the common part of all events is. This is easy to do in the query tool. Figure 7.16 shows the clusters found from the previous query. Figure 7.17 shows the keywords that are associated with these clusters. As we can see, the most common keyword types are the “somatosensory” and “response” keywords, which is an expected result since our set of clusters activates motor area 6. 60
Figure 7.11. Border of area 6 in white with population map of clusters.
7.3.5
Find contrasts related to a visual task
We can also use keywords the other way around, i.e., find the contrasts having a particular keyword and create a population map of these contrasts. In this example, we want to find contrasts having one or more experimental conditions associated with a visual task. However, we also want to add the criterion that none of the control conditions should involve visual tasks. This kind of query must be divided into two queries. First, we find the contrasts which contain the keyword “visual” from experimental conditions. Within this result, we find the contrasts which do not have any control condition with the keyword “visual”. This way, we remove the contrasts having both experimental and control conditions associated with a visual task. Figure 7.18 shows the result of this query. Visual cortex is indeed activated for these contrasts.
7.4
User feedback
The best way to get user feedback is to become a user yourself. This was what I did from the early beginning. I designed and developed the tool I wanted to use later in the project as a user and today I am quite satisfied with the tool. I have been using the tool as a user from the first day and also criticized some of my own solutions as a programmer. This has inevitably decreased the developing time and made feedback from other users sparse. I have received feedback from other users at the Karolinska Institute and at the Royal Institute of Technology. The first remark was that there were too many windows on the screen, especially when connecting to the database. In this early version, a new database window was created for each query. The design was changed 61
Figure 7.12. Two statistical peaks, shown as white dots. The peaks are next to each other, making them look like one larger peak.
to have only one database window. Besides this remark, user feedback has mostly been bug reports. I did not conduct any extensive user tests.
62
Figure 7.13. 3D view from above of co-activated clusters.
Figure 7.14. 3D view from the left side showing co-activated clusters.
63
Figure 7.15. 3D view from the right side showing co-activated clusters.
Figure 7.16. Clusters which we want to associate with keywords.
64
Figure 7.17. Keywords associated with the set of clusters.
Figure 7.18. Result from visual keyword query.
65
Chapter 8
Discussion and conclusions The features of the visualization and query tool make it possible to do meta analysis across experiments. The visualization part with its 3D volume rendering tool makes it easy to localize sulci and gyri. The 2D slice windows help localize internal structures and also guide the user through Talairach space. In conjunction with the 3D view, these windows give a comprehensive view of the brain. The query part of the tool is quite comprehensive. The degrees of freedom of the query system make it possible to do almost any kind of query without the need to write it in SQL. The tool can also be used to browse the database content. However, there are still missing features which would make the tool better. Among the features which I would like to add are: • Better VOI drawing tool • Alternative 3D rendering using polygon mesh to render the surface • Inflating the cortex • Transformation from t to Z image • Euler characteristics of t or Z images • Principal Component Analysis of images • MNI to Talairach and Talairach to MNI transformation One must never forget that a user interface of this kind is never complete. Especially, in a rapidly evolving field like human brain mapping, it is essential that the NeuroGenerator database, as well as any user interface to the database, evolves with the field.
66
Bibliography R. Adler. The geometry of random fields. Wiley, New York, 1981. R. Adler and A. Hasofer. Level crossings for random fields. Annals of probability, 4: 1–12, 1976. P. Bailey and G. von Bonin. The isocortex of man. University of Illinois Press, Urbana, 1951. A. Bodegård. Functional mapping of somatosensory cortices in the human brain. PhD thesis, Division of human brain research, department of neuroscience, Karolinska Institutet, 2001. Brain Innovation B.V. Brainvoyager — a product from Brain Innovation B.V., Nov. 2002. http://www.brainvoyager.de/. BrainMap. Brainmap, Oct. 2002. http://ric.uthscsa.edu/projects/brainmap.html. M. Brett, I. S. Johnsrude, and O. A. M. The problem of functional localization in the human brain. Nature reviews neuroscience, 3:243–249, Mar. 2002. K. Brodmann. Vergleichende lokalisationslehre der grosshirnrinde in ihren prinzipien dargestellt auf grund des zellenbaues. Barth, Leipzig, 1909. T. F. Budinger and H. F. VanBrocklin. The biomedical engineering handbook: second edition: positron emission tomography (PET). Boca Raton: CRC Press LLC, 2000. S. M. Courtney and L. G. Ungerleider. What fMRI has taught us about human vision. Current opinion in neurobiology, 7:554–561, 1997. D. Eidelberg and A. M. Galaburda. Inferior parietal lobule. divergent architectonic asymmetries in the human brain. Archives of neurology, 41:843–852, 1984. FMRIB. FSL, Nov. 2002. http://www.fmrib.ox.ac.uk/fsl/. fMRIDC. The fMRI Data Center — fMRIDC home page, Oct. 2002. http://www.fmridc.org/. 67
R. S. J. Frackowiak, K. J. Friston, C. D. Frith, R. J. Dolan, and J. C. Mazziotta. Human brain function. Academic press, 1997. K. Friston, K. Worsley, R. Frackowiak, J. Mazziotta, and A. Evans. Assessing the significance of focal activations using their spatial extent. Human brain mapping, 1:214–220, 1994. S. Geyer, A. Ledberg, A. Schleicher, S. Kinomura, T. Schormann, U. Burgel, J. Larsson, K. Zilles, and P. E. Roland. Two different areas within motor cortex of man. Nature, 382:805–807, 1996. S. Geyer, T. Schormann, H. Mohlberg, and Z. K. Areas 3a, 3b and 1 of human primary somatosensory cortex. Neuroimage, 11:684–696, 2000. G. H. Glover. Deconvolution of impulse response in event-related BOLD fMRI. Neuroimage, 9(4):416–429, Apr. 1999. R. E. Jacobs and S. R. Cherry. Complementary emerging techniques: high-resolution PET and MRI. Current opinion in neurobiology, 11(5):621–629, Oct. 2001. P. Jezzard, P. M. Matthews, and S. M. Smith. Functional MRI, an introduction to methods. Oxford University Press, 2001. J. Larsson. Functional mapping of intermediate visual processes in man. PhD thesis, Division of human brain research, department of neuroscience, Karolinska Institutet, 2001. D. C. Lay. Linear algebra. Addison Wesley, 1994. A. Ledberg. Measuring brain function, statistical tests for neuroimaging data. PhD thesis, Division of human brain research, department of neuroscience, Karolinska Institutet, 2001. W. E. Lorensen and H. E. Cline. Marching cubes: a high resolution 3D surface construction algorithm. In Proceedings SIGGRAPH 1987, pages 163–169. SIGGRAPH, 1987. M. J. McKeown, S. Makeig, G. G. Brown, T. P. Jung, S. S. Kindermann, A. J. Bell, and T. J. Sejnowski. Analysis of fMRI data by blind separation into independent spatial components. Human brain mapping, 6:160–188, 1998. NeuroGenerator. Neurogenerator, Oct. 2002. http://www.neurogenerator.org/. D. V. Niddam, T.-C. Yeh, Y.-T. Wu, P.-L. Lee, L.-T. Ho, L. Arendt-Nielsen, A. C. N. Chen, and J.-C. Hsieh. Event-related functional MRI study on central representation of muscle pain induced by electrical stimulation. Neuroimage, 17:1437–1450, 2002. 68
A. Oppelt. Advanced signal processing handbook: magnetic resonance tomography— imaging with a nonlinear system. Boca Raton: CRC Press LLC, 2001. H. Reichert. Introduction to neurobiology. Thieme Verlag, 1992. P. Roland and K. Zilles. Structural divisions and functional fields in the human cerebral cortex. Brain research reviews, 26:87–105, 1998. P. E. Roland. Brain activation. Wiley, New York, 1993. P. E. Roland, G. Svensson, T. Lindeberg, T. Risch, P. Baumann, A. Dehmel, J. Fredriksson, H. Halldórsson, L. Forsberg, J. Young, and K. Zilles. A database generator for human brain imaging. Trends in neurosciences, 24(10):562–564, Oct. 2001. R. I. Schubotz and D. Y. von Cramon. Functional organization of the lateral premotor cortex: fMRI reveals different regions activated by anticipation of object properties, location and speed. Cognitive brain research, 11(1):97–112, 2001. K. Shima and J. Tanji. Role for cingulate motor area cells in voluntary movement selection based on reward. Science, 282:1335–1338, 1998. C. Stippich, J. Mohammed, B. Kress, S. Hähnel, J. Günther, F. Konrad, and K. Sartor. Robust localization and lateralization of human language function: an optimized clinical functional magnetic resonance imaging protocol. Neuroscience letters, 346(1-2):109–113, 2003. J. Talairach and P. Tournoux. Co-planar stereotaxic atlas of the human brain. Thieme medical, New York, 1988. P. M. Thompson and A. W. Toga. Handbook of medical imaging: processing and analysis. Academic Press, San Diego, 2000. K. Toma, M. Ozawa, K. Matsuo, T. Nakai, H. Fukuyama, and S. Sato. The role of the human supplementary motor area in reactive motor operation. Neuroscience letters, 3:177–180, 2003. A. Treisman. The binding problem. Current opinion in neurobiology, 6(2):171–178, 1996. O. Vogt. Die myeloarchitektonik des isocortex parietalis. J. psychol. neurol., 18: 107–118, 1911. C. von Economo and G. N. Koskinas. Die cytoarchitektonik der hirnrinde des erwachsenen menschen. Springer, Vienna/Berlin, 1925. Wellcome Department of Imaging Neuroscience. SPM99, Nov. 2002. http://www.fil.ion.ucl.ac.uk/spm/spm99.html. 69
M. Woo, J. Neider, T. Davis, and D. Shreiner. OpenGL programming guide. Addison Wesley, third edition, 1999. M. W. Woolrich, B. D. Ripley, M. Brady, and S. M. Smith. Temporal autocorrelation in univariate linear modeling of fMRI data. Neuroimage, 14(6):1370–1386, Dec. 2001. K. Worsley, S. Marrett, P. Neelin, A. Vandal, K. Friston, and A. Evans. A unified statistical approach for determining significant signals in images of cerebral activation. Human brain mapping, 4:58–73, 1996. K. Zilles and N. Palomero-Gallagher. Cyto-, myelo-, and receptor architectonics of the human parietal cortex. Neuroimage, 14:S8–S20, 2001.
70
Appendix A
A.1
Glossary
Axon BOLD Cerebral cortex Corpus callosum Cortical areas Cytoarchitectectonic Cytoarchitecture Digits Fissure fMRI Gyrus Gyri Hemodynamic Medial Motor cortex Myelin Myeloarchitectonic maps Myeloarchitecture PET Slice Somatosensory cortex Sulcus Sulci
Nerve fiber that conducts impulses from the body of the neuron to the muscles or the synaptic sites of other neurons Blood Oxygenation Level Dependent contrast The superficial gray matter of the brain A bundle of fibers connecting the cortices of the two hemispheres Areas located in the cortex Map of areas defining group of cells in the tissue with a specific arrangement Cellular composition of a bodily structure Fingers and toes A deeper fold than a sulcus in the cerebral cortex functional Magnetic Resonance Imaging Hills on the brain, separated by sulcus or fissures Plural of gyrus Forces involved in the circulation of blood such as changes in blood pressure and blood flow Plane located nearer to the midsagittal plane, i.e., the opposite of lateral The regions in the brain related to movements of the muscles White material that encloses certain axons and nerve fibers Maps of regions with a specific variation on the distribution of myelin Myelin composition Positron Emission Tomography A 2D image The regions related to perception of sensory stimuli from the skin and internal organs touch and temperature A furrow in the brain Plural of sulcus
71