A. Goldberg: Smalltalk-80: The Interactive Programming Environment, Addison Wesley, 1983. [IWCLD88] D. Ingalls, S. Wallace, Y.Y. Chow, F. Ludolph, K. Doyle: ...
Visualization as Debugging: Understanding/Debugging the Warren Abstract Machine Julio Garc´ıa-Mart´ın
Juan Jos´e Moreno-Navarro
Universidad Polit´ecnica de Madrid
∗
Abstract This paper presents a twofold proposal to understand the Warren Abstract Machine. A stepwise definition of the WAM by using abstract data types (for every WAM component) is briefly presented. Furthermore, we describe a visual environment which can be used for the emulation of the Warren Abstract Machine. It has been designed as a high level debugger for object oriented programs, following a methodology sketched in the paper. The tool has the capability to show the user the internal behaviour of the WAM during a program execution by showing its components at the desired level of abstraction. The tool provides an interactive and friendly interface. Configurable tracing and dynamic breakpoint location can be used in a simple and coherent way. All the features included in the tool allow for an easy and powerful examination of the WAM.
1
Introduction
In the last years, the idea that the usual task of a programmer is to develop new programs from scratch has changed. Very often, the programmer needs to modify or maintain an old program or he reuses parts of previous programs. In this situation the programmer needs to understand correctly the behaviour of a program that he did not make (or he did not remember), which could be a non trivial task. Debugging has been usually considered as the process to find bugs in a program. But it could be also interpreted as a process that tries to understand the (possible incorrect) behaviour of a program. One of the best features of debugging is that program executions can be controlled. This fact could offer us some advantages on the understanding of a program, because it would allow slower computations and more systematic analysis on the execution. Notice that traditional debugging techniques (e.g. tracing, variable watching, breakpoints, etc.) are still valid for the new task. The most interesting way to understand a program is to visualize its internal behaviour. The more flexible and complete is the visualization, the more helpful is the tool. In this paper we apply this idea to understand a concrete program: the Warren Abstract Machine (WAM) for PROLOG implementation. It is placed in the field of the technology concerning the development of abstract machines. With all the more reason than other paradigms, abstract machines should be designed with debugging support as a central issue [?]: it does hardly complicate the formal specifications and simplifies testing, verification and validation. One of the most important elements in the success of PROLOG has been the development of efficient implementation techniques. The possibility of compiling PROLOG and getting efficient code was pointed out by Warren [?] with the design of an abstract machine. Due to the high quality of the resulting machine, it is the reference point for PROLOG compilers. However, besides the success of the WAM, the only way to understand its behaviour is by reading the papers and tutorials devoted to explain how it works. The collection includes the original Warren’s work [?], tutorials and descriptions: [?, ?, ?], and formal specifications and verification proofs: [?, ?, ?]. Although all of them contain good explanations, specially A¨ıt-Kaci’s tutorial and [?] formal specification, they solve the problem only partially. On one hand, there are no apparent reasons for many of the decisions on it (at least in the previous papers), and all its descriptions combine implementation tricks with design decisions and there is no way to identify the origin of several behaviours. On the other hand, to fully understand its ∗ Departamento LSIIS, Facultad de Inform´ atica, Campus de Montegancedo, Boadilla del Monte, 28660 Madrid, Spain, email: {juliog,jjmoreno}@fi.upm.es.
operation, most of the students of the WAM need to construct their own toy implementation to understand all the details, but this solution implies a great effort. We think that a complete understanding of the WAM needs more help. Our proposal for a complete understanding of the WAM is twofold: First, we have developed an abstract view of the WAM by a stepwise formal description. For an abstract view of the WAM we mean a description of the WAM focused in how: a) it implements SLD-resolution with backtracking and b) the main elements of PROLOG (unification and backtracking) can be compiled. We delay implementation details and optimizations as most as possible. Our specification treats each WAM component (heap, trail, stack, registers, etc.) as abstract data types (ADTs). The WAM is derived from SLD-resolution, the operational semantics of PROLOG, in several refinement steps. Moreover, the complete WAM (including optimizations and implementation tricks) can be derived from the abstract WAM by giving efficient implementation of the ADTs in the definition. One interesting point is that both steps are handled in the same framework, with refinements of the data area (in the first step) or with refinements of the implementation of the ADTs. Second, we have developed a visual implementation of the previous WAM specification. This means that our tool is able to compute PROLOG programs by showing the user all the components of the machine and their evolution. Each element is displayed at the level of abstraction (in the sense of the stepwise specification) the user decides. This tool tries to cover a gap between the pure execution of a PROLOG program and concrete formal descriptions based on WAM specification. This paper is focused on the visual tool, called Friendly-WAM, and its design and implementation as a high level debugger. For this purpose, we sketch a methodology for debugging object oriented programs (as is our case, because it is based on abstract data types). Our method includes facilities for general tracing in a simple and clean way. An important problem arises from the combination of two sources of breakpoints during the visualization/debugging of the WAM. We are interested in giving conditions to examine the program from the WAM definition and also from the original PROLOG program and its execution model (SLD-resolution). The problem is achieved in an uniform way due to the fact that the stepwise description of the WAM contains SLD resolution as the first step. The final tool combines some mixed characteristics of (semi-automated) debuggers. From this point of view, this paper could be understood as a practical experience of a debugging of an object oriented program. The rest of the paper is organized as follows: Section 2 presents a more detailed description of the WAM specification and Friendly-WAM. Section 3 sketches our methodology for object oriented programs debugging while Section 4 describes how this methodology is applied in the design and implementation of our tool. Section 5 shows how to use Friendly-WAM. A discussion on related work appears in section 6. Finally, section 7 summarizes the conclusion and points to future work.
2
The Starting Point: Stepwise Definition and Computer Visualization of the WAM
As we have said our proposal to understand the WAM consists of a stepwise definition of the machine and an interactive visual tool based on the specification. This section starts with a brief presentation of our description of the WAM. Next, we establish the requirements for Friendly-WAM.
2.1
Stepwise Description of the WAM
An abstract machine is defined by the following: the data area which defines the configuration of the machine; the instruction set and a semantic function for each of its elements (defining the changes on the configuration after executing an instruction); the transition function between an initial and a final configuration which is guided by the semantic function of the instruction currently executed; and the translation function which compiles a program into machine code. All of these elements can be described formally by using abstract data types (ADTs). The data area is a collection of ADTs. The semantic function is described in terms of the operations of the ADTs. The derivation of the WAM is carried out in two big steps. The first step is the derivation of the main elements of the WAM. We have no space to describe all the refinement steps. We could only mention some important points. The first machine is a stack based description of SLD-resolution solving literals left to right and using the clauses in textual order. The stack contains choice points, representing a resolution step with the current goal (a list of literal starting with a p predicate call), the substitution of the resolution
step and the next clause for p to be used. Goals can be coded into the machine program by changing the goal in choice points by some argument registers and the continuation program label and the next clause by the corresponding program label. Substitutions can be compiled with the help of the heap as a set of pairs (variable name, heap pointer). The variables included in this set are the variables bound during the resolution step represented by the choice point. However, the amount of variables bound in a resolution step is unknown. What is possible to do at compile time is to give names to the local variables of the clause and to collect in a choice point only the bindings to the local variables. A local trail is needed to collect every nonlocal variable binding. It is useful to reconstruct the step substitution. Operationally, the trail is useful to undo variable bindings under backtracking. Furthermore, one could notice that several predicates have only one clause. In this case a full choice point is no longer useful and can be simplified in an environment that contains only the continuation label and the local variables. The environments included in a choice point are collected in a stack. Finally, the parameter passing could be optimized by using specialized machine instructions to construct or unify every component in a term (constant, functor or variable). After this derivation we get what we call the Abstract WAM. We obtain an abstract behaviour of the WAM without knowing implementation details. Due to the lack of space we will concentrate on it. Let us explain how it looks like. The data area is formed by the WAM-program, or-stack, the argument registers and the heap. The program encompasses a program counter and an array of WAM-instructions. The or-stack is an instance of the polymorphic ADT stack with choice points as elements. The ADT choice point contains a copy of the argument registers, the local trail (a set of variable names), the program address of the next clause and an and-stack. The and-stack is another instance of the ADT stack with environments as components. An environment contains the continuation label and the variables. The ADT variables are defined together with the heap. A variable is a pair (variable name, heap pointer). A heap is a table with a pointer as key and each element is a term: a constant, a constructor with some heap pointers as arguments or a variable name. Finally, the argument registers are an array of heap pointers or variable names. We do not give details about the elements in the Abstract WAM. Figure ?? collects some examples of the formalization: An overview of the translation function for clauses (where one can see the instruction set used), the semantic function of a couple of instructions (try me else and retry me else) and the specifications of the ADTs Trail an instance of a SET) and Environment. The second main step is the optimization of this machine. All the optimizations are performed similarly as before and the order is (nearly) irrelevant. • The and-stacks and the or-stack can be implemented as a single one containing both choice points and environments. Two different top pointers are needed. • It is more efficient to handle a global trail instead of several local ones. • It is also convenient to implement the heap as a stack of contiguous memory cells. • The recursive definition of the general unification algorithm can be turned on iteratively by using a new component of the data area (the push-down list; PDL for short) that behaves as a stack. • Semantics of the instructions could also be optimized as in the last call optimization, environment trimming, indexing of clauses and so on. • Variable classification allows for a very efficient code. Temporary registers are introduced for this purpose. • Finally, the data area can be seen as a large stack of memory cells. The correct organization of the different components helps in the implementation of some operations (i.e. decide if a variable is older than other). As a result we get a formal description of the WAM, with code area, heap, stack, trail and PDL as components, as described in [?].
2.2
Requirements for Friendly-WAM
In order to fully understand the WAM we also want to have a tool/environment suitable to carry out a more controlled execution of WAM programs. Besides this, we were not satisfied with just obtaining the solutions of a program execution. We want to develop a frame where it is possible to carry out progressive analysis and checks during execution. This WAM emulator is designed as an interactive environment with
a) Translation function WAM Program :=
c) Specification of abstract data types goaltrans (GOAL) proctrans (PROC (p1 )) ... proctrans (PROC (pn ))
proctrans: Procedure → Wam Code proctrans (PROC (p) = {C1 }) := clausetrans (C) proctrans (PROC (p) = {C1 , . . ., Cn }) :=
hlabel1 i: hlabel2 i: hlabeln−1 i:
try me else (n, hlabel1 i) clausetrans (C1 ) retry me else hlabel2 i clausetrans (C2 ) ... trust me clausetrans (Cn )
clausetrans: Clauses → Wam Code clausetrans (p(t) :- q1 (s1 ), . . ., qn (sn )) := allocate (#Variables (t, s1 , . . ., sn )) unifytrans (t) transfertrans (s1 , var (t)) call (hq1 i, arity (q1 )) transfertrans (s2 , var (t, s1 )) call (hq2 i, arity (q2 )) ... transfertrans (sn , var (t, s1 , . . ., sn−1 )) call (hqn i, arity (qn )) deallocate
adt SET [X : element] is sort set operation operation operation operation operation
Insert : set element → set Remove : set element → set ∈ : element set → bool ∅ : → set ∪ : set set → set
axioms vars i, j : element var S : set vars A, B : set Insert (Insert (S, i), j) = Insert (Insert(S, j), i) if i j Remove (Insert (S, i), j) = Remove (S, j) if i == j Remove (Insert (S, i), j) = Insert (Remove(S, j), i) if i j Remove (∅, i) = ∅ j ∈ Insert (S, i) = (i == j) or (j ∈ S) if (i j) ¬i ∈ ∅ i ∈ (A ∪ B) = (A ∈ i) or (B ∈ i) endadt adt TRAIL is extending SET [VAR NAME] trail endadt adt ENVIRONMENT is sort environment usesVARIABLES WAM PROGRAM
b) Semantic function SI: Wam Instruction × Wam State → Wam State
SI [[try me else hLi]] wam state := Next Instruction (Push (wam state, Create Choice-Point (Registers (wam state), hLi, Consult CP (wam state))))
SI [[retry me else hLi n]] wam state := Next Instruction (Rewind Trail (Next Clause (wam state, hLi)))
operation Create : nat prog addr → environment operation Modify CP : environment prog addr → environment operation Consult CP : environment → prog addr operation Modify Var : environment nat variable → environment operation Consult Var : environment nat → variable axioms vars size, n : nat var E : environment var CP : prog addr var X : variable Consult Consult Consult Consult endadt
CP (Create (size, CP )) = CP CP (Modify CP (E, CP )) = CP Var (Create (size, CP )) = Unbound Var (Modify Var (E, n, X)) = X
Figure 1: Examples of the specification
a friendly user interface and it must be strongly related with our stepwise WAM description. We call our tool Friendly-WAM. The basis of the functionality of Friendly-WAM is the possibility of visualizing WAM components as defined in any level of the specification. This means that every ADT can be visualized at the level of abstraction desired by the user. For instance, the trail can be presented as a set of variables inside the and-stack or as a global data with stack structure. All ADTs are viewed by using their own window. Usually, it is not convenient to show the internal state of the WAM every time a modification in the machine is done. For this reason, the tool presents also some configurable tracing facilities. The user can specify the conditions under which he wants to stop the execution in order to watch the internal state of the WAM. We have included the PROLOG program as well as the WAM program as a part of the WAM state. It involves that the emulator can show the WAM instruction that is being currently executed, and its PROLOG instruction -clause, goal or predicate- associated. This allows us to trace the execution of the program following the code. The whole environment looks like a set of windows placed on different positions on the screen. Any investigation about WAM’s internal state can be displayed through these windows. In that sense, the emulator is like an X-ray of the WAM. Windows on the emulator are easily configurable with regard to: size, form, frame, mobility, name, etc, and scrolling is possible. The environment can be both mouse-driven or keyboard-driven. A preliminary version of Friendly-WAM is presented in [?]. However, it does not fulfil all the functionality demanded here. The next sections describe how the new version of Friendly-WAM is designed to meet these requirements.
3
Towards a Methodology for Debugging Object Oriented Programs
As debugging is a process that consumes 50-70% of software development time, programs must be designed to facilitate internal manipulation and examination. During the debugging process the programmers have in mind the expected behaviour (or errors) they are aware of. These suppositions are related to the details of the executions and a tracer is required to check them. However, most current tracers show a very poor functionality. The usual kind of features a tracer offers is often fixed (positional breakpoints, variable watching, some simple conditions, etc.), and the functionality is reduced in advance. Therefore tracer commands are not expressive enough, and programmers cannot formulate what they want to check in detail. If we want to obviate this drawback we need to have configurable (or programmable) tracers. As opposed to the usual breakpoint classification: positional class, conditional class and class of asyncronous events[?], we have reduced them to only one, the conditional behavioural control. We are certain that all previous cases can be seen as particular conditional case. In adition to this, it allows to maintain a high degree of expressiveness and offers us a single way to automate the debugging activity. These programmable tracers have been designed for PROLOG ([?]) and other languages. One keypoint in this task is to avoid a large number of complicated constructions which are difficult to use. If we leave all the work to the tracer, there is no guarantee that these constructions cover the complete debugging process. The solution used in [?] is to integrate trace facilities into the language to be debugged. In this section we sketch a methodology to introduce configurable trace facilities into an object oriented language. We are interested in static as well as dynamic conditions to enable and disable trace facilities. We associate the notion of tracing of an object with the visualization of the state of the object in certain moments. We assume that each class has at least one visualization operation. The tracing (visualization) is activated depending of some debugging conditions. A debugging condition is a boolean class function. Every debugging condition has associated a debugging action. Debugging conditions specify the conditions to stop the normal execution and start debugging actions (which includes visualization) over the state of the object. The programmer could decide either statically or dynamically which debugging conditions are active. Every time the object is accessed the active debugging conditions are checked. If they are true, the corresponding debugging action is performed. Let us summarize the method in terms of object oriented programming: Each class has three definition parts: the class interface part, the view part of the class (with the visualization operations and the part of the state needed to make the visualization) and the debugging part (with the debugging conditions and actions and possibly adding new state parts to implement them). The class interface part is the usual definition part of the object (the .hcc file in C++). It contains the operations (methods in other terminology) allowed for the object.
The view part contains operations to display the state of the object (as suggested in [?]). It can be developed by the programmer but can also be generated automatically by default. It is easy in a pure object oriented language, provided that primitive objects (numbers, strings, arrays, etc) have their own display operation. Class aggregation means that the visualization can be done by aggregating the views of the corresponding components. The state of the class could be completed with new elements, for instance a window, a dialogue menu, etc. The debugging part contains the definition of debugging conditions (boolean functions) as well as debugging actions (operations). The state could be enhanced with new components used by the debugging conditions and actions (for instance, it is possible to check how many times the object is accessed by including a counter in the state). The active conditions can be defined statically (we can imagine that it is done in the make file of the program) or dynamically. Notice that both the debugging conditions and actions are specified as class operations, so they are coded in the same language as the program.
4
Structure of the program
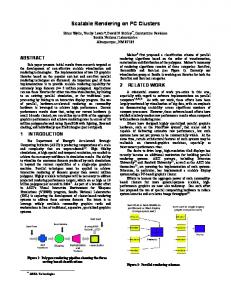
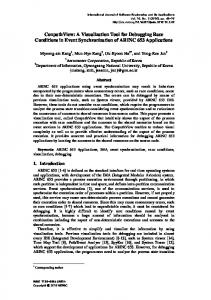
We have chosen C++ [?], an object oriented extension of C, to develop the program. Each abstract data type of the WAM is implemented as a class. Figures ??,?? show the complete hierarchical design of our tool. We draw separately the usage relation (Fig. ??), and inheritance and polymorphism relation (Fig. ??). In C++ a class has only two sections: the definition part and the implementation one. To manage the view part of a class class we generate a new class class view by inheritance. The new class complements the state by including all the elements needed for the visualization and the displaying operation. The debugging part is managed in a similar way, inventing the class class deb by inheritance from class view. The state is completed as needed. The operations defined by the user are boolean functions which represent debugging conditions. Inheritance of operations of the original class is slightly modified. Every operation class::op of the class is replaced by a new operation class deb::op with the following code: 1. the original operation is performed 2. the new part of the state is updated 3. the active condition is checked (by an if instruction). If the result is true the object is visualized by a call to the display operation and a debugging action is performed. Figure ?? shows the structure of classes. The visualization class contains only one operation display. Each WAM (main) component is showed by using its own window. The initial level of abstraction of the ADT/object is specified as an argument. However, it could be modified by using a dialogue box. The state of the visualization class contains the window, the menu and some extra information for helping the reconstruction of the abstract views. For instance, in order to reconstruct the substitution computed in each resolution step the environment needs to know the top of the trail in this moment. This information is not included in the environment but into the environment view. The next point to discuss is how to manage active conditions. As we have said, every operation call is followed by an if instruction. The condition of this if is a call to the boolean function pointer class cond. This function variable can be instantiated statically as a macro by the C preprocessor. The pointer points to a name and the C preprocessor changes this name to a concrete function. In order to specify statically the active condition a simple define instruction is used. However, it could also be changed dynamically. As class cond is a variable, an assignment can be done to a concrete function. Although the user can define his own debugging conditions and actions it is not an easy task in all the cases. For this reason, we have defined a collection of debugging conditions and actions that cover (most of) the user’s needs. The debugging actions included visualization, watching facilities and delayed or step by step executions of machine instructions. Debugging conditions depend on the particular features of every abstract data types. Among the predefined conditions we can mention: • stop and visualize after any wam-instruction is executed, • stop every time the heap is accessed,
term
variable
? environment prog-address HH
HH j
trail @ @
and-stack
XXX XXX XXX z
@ @ @
choice-point
@ @ @ ?
PP PP q
@ R
heap XXX
?
arg-regs �� XX z 9 ���
prolog-prog or-stack
�� ��� � � 9� �
?
data-area
wam-program � �� ��� 9
XX XXX z X wam-state
? sem-fun
Figure 2: Friendly-WAM class structure • stop every time a choice point is generated, • stop when something is pushed into the trail (i.e. a goal variable is bound), . . . But the tracing facilities inside the WAM that we have described are more powerful. In particular, they allow the user to specify some debugging conditions into the PROLOG program and its execution models. As the PROLOG program is a part of the specification and the visualization, the user can include debugging conditions on it. For instance, he can specify a predicate, a clause or a specific predicate call as breakpoints. SLD-resolution is the most abstract view of the semantics function, i.e. it is a part of the specification. Therefore, the user can activate debugging conditions related with SLD resolution: for example, we can define a breakpoint every resolution step or every time a non-empty substitution is computed. A menu allows for dynamic changing of conditions and actions. Usually, changing a condition of an ADT (for instance the or-stack) supposes the dynamic changing of the conditions of the ADTs it includes (and-stack, choice point, etc.). Moreover some complete scenarios (including visualization options) are provided. For a predefined scenario we understand a configuration of debugging conditions and actions and a visualization level setting for all the abstract data types.
heap-addr
variable-id
set
?
?
variable
trail
vector
stack
? args-regs
Inheritance
-
? ?
? ?
and-stack
or-stack
Polymorphism
-
Figure 3: Friendly-WAM class structure (Inheritance and Polymorphism) Predefined scenarios can be selected before starting the tool (as a parameter of the program) or by using a menu shown at the beginning of the execution. Scenarios avoid incoherent uses of Friendly-WAM facilities. The whole methodology could lead to a very efficient management of debugging / visualization features. If the user does not like these facilities, he simply avoids the link of classes class view and class deb to the program. Notice that no recompilation is needed.
5
Using Friendly-WAM
In this section some snapshots of a Friendly-WAM session obtained in the execution of a concrete execution example are presented. We will try to give a landscape of the functionality of Friendly- WAM together with making familiar its general aspect. On the other hand, we are interested in showing the large possibilities of the debugging and emulating environments not only in the context of abstract machines, but also in a context of general executions of programs. Friendly-WAM appears as a set of windows (or icons), each of them representing a WAM component. The aggregation relationship of the object oriented paradigm has its correspondence in the visual version on the environment. Every component is represented by a symbolic icon situated inside the window of the object that they are part of. These components are accessed (visualized) by exploiting its icon. The beginning of the program is carried out in the usual way after debugging conditions have been previously determinated. At first step of execution, Friendly-WAM presents the aspect showed in figure ??. The environment is globally managed by an horizontal menu bar placed in the top of the main window. Each of the menu labels has associated a pop-up menu, and, among others, the changing of the abstraction level and the debugging conditions appear as option. The next snapshot presents a step of the execution. Figure ?? shows how Friendly-WAM presents a general view of WAM data area, together with other information about the current program that being executed. It can be seen that the data area is formed by the heap (where terms involved in unifications are represented), global registers for transferring operations of terms, and the or-stack.
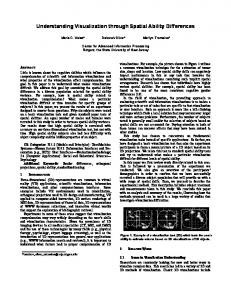
class deb
class view
class
Figure 4: Structure of a class
Figure 5: The Friendly-WAM: A first view At this point, the execution has been stopped because a debugging condition has been reached: a WAM instruction has accessed the heap. The debugging action is performed: One of the argument registers is inspected and its information is shown by a dialogue menu. The next third example of the Friendly-WAM shows a more detailed view of the WAM (see figure ??). Almost all of the relevant components of the WAM are presented: or-stack, trail, argument registers and the environments inside of the and-stack. Furthermore, both the PROLOG and the WAM programs show the point where the execution is going. A menu bar indicates the WAM instruction to be executed. A debugging condition has been detected trying to carry out an operation on the trail. The WAM instruction inserts the variable into the trail to being unbound later. More other operations than those presented here could be easily carried out under Friendly-WAM. During execution a lot of possible checks are possible. However, our purpose is not that of giving a lot of concrete descriptions. We hope to succeed in giving a flavour of the power of an environment like Friendly-WAM.
6
Some Related Work
We could discuss two kind of related works: explanations of the WAM and object oriented debugging. We have mentioned in the introduction the papers devoted to explain how the WAM works. A¨ıt-Kaci’s tutorial is a good description of the WAM, but the level of the description is very close to the concrete implementation. The formal description of [?] is more close to our work, although its main goal is to
Figure 6: The Friendly-WAM: Data Area provide a formal proof of the correctness of the WAM. We are more focused on the derivation of the WAM from SLD-resolution giving reasons for all the design decisions. [?] completes Kursawe’s work [?] on the deduction of an abstract PROLOG machine by partial evaluation, an alternative approach to deduce the WAM specification. It is a very nice and adequate methology to derive the forward behaviour of PROLOG, but efficient backtracking and data representation appear to lead to some difficulties. In all the cases there is no computer support to test the explanations. We are less familiar with object oriented debugging. [?] is a survey of current object oriented debugging tools. The authors establish that “Debuggers must accentuate the object model of the language around they have been designed. Specifically, object-oriented debuggers should support the concept of debugging at the object level”. This means that the particular characteristics of object-oriented programming (i.e. inheritance, polymorphism and dynamic binding) must be taken into account. There are few existing proposals where the visualization of their programs is assisted, see [?, ?]). The most successful current tools are GDB ([?] the gnu C++ debugger), the Smalltalk-80 debugger ([?]) and Vici ([?] the Objective-C debugger). They are ordinary imperative debuggers with some special characteristics for object oriented programming. The interface with the user is similar to the interface with the original language (specially in Smalltalk) but the functionality is closed to standard debuggers. All of them use a tracing language with several commands. The Smalltalk debugger support only positional breakpoints by explicit insertion of self halt or self debug methods into the program. Vici allows positional and (fixed) conditional breakpoints, but response to breakpoints is not alterable. GDB offers con-
Figure 7: The Friendly-WAM: Full view ditional breakpoints that can be associated with one location only. It also allows breakpoints to be dormant until the desired context is established. Moreover, GDB allows the user to define its own tracing commands but in terms of predefined commands. Notice that none of them give special facilities to debug incorrect inheritance definitions or a bad use of dynamic binding. Our methodology is more flexible than the mentioned tools. It is focused on visualization and there are no restrictions in the debugging conditions and actions. They can be changed dynamically (what subsumes dormant breakpoints of GDB) and it is fully configurable. In our methodology, debugging conditions and actions cannot be inherited. The new class needs to define its own debugging conditions and actions which help in the debugging of inheritance errors. It is also valid for dynamic binding. Ambiguous functions can have different debugging actions, so identification is possible.
7
Conclusions and Future Work
Currently, we have a very preliminary prototype [?] running on Personal Computers under DOS. We are finishing the development of a UNIX version for SUN workstations using the X- Windows interface. Some future enhancements of Friendly-WAM are planned. First, we want to work on the automatic generation of debugging conditions and actions. These can be a part of the specification of the ADTs and written in terms of other ADT’s operations. In other words, the user should describe debugging conditions
and actions at the level of the specification instead of coding them in C++. The system could generate C++ code for the debugging class automatically. The user should also describe scenarios in this way. We also plan to allow more general debugging conditions at the level of the PROLOG program in the vein of [?]. Another point of future work is the formalization and generalization of our methodology for object oriented programming debugging. We claim that it is possible to generalize the methodology to get a semiautomated behaviour 1 . The key point is to replace the use of breakpoints (a primitive and restrictive technique) by some formal methods. The notion of algorithmic debugging (see [?]) could be useful for this purpose. Although algorithmic debugging has been used mainly in declarative programming (see [?] for the application to a functional language) because of the lack of side effects it could be also applicable to object oriented programming, because the side effects are restricted to the object. Our methodology also prevents errors caused by a bad use of inheritance and dynamic binding. It seems to useful for all the elements of the taxonomy of object oriented bugs showed in [?]. The use of debugging facilities has been a great help during the development of the tool. The debugging facilities are not only useful for visualization but also for ordinary debugging. The methodology is been used to fix some bugs in the program. Furthermore, the design of the program has been simplified by distinguishing the debugging, visualization and interface part of an object. The equation understanding & visualizing a program = debugging process seems to be very useful. Finally, the development of our application has convinced us that tools like the present one offer an adequate way to understand how the WAM works, what are its tricks, and how they could be implemented. The tool is useful not only for students but for people involved on the compilation and implementation of declarative languages.
Acknowledgements We are grateful to Alvaro Falquina for helping us in the implementation of Friendly-WAM.
References [AK91]
H. A¨ıt-Kaci: The WAM: A (Real) Tutorial, The MIT Press, 1991.
[BR91]
E. B¨ oerger, D. Rosenzweig: WAM Algebras–A Mathematical Study of Implementation, Part I in Proc. CSL’90, Part II in Proc. Russian Conf. on Logic Prog.’ 91.
[BR92]
E. B¨ oerger, D. Rosenzweig: The WAM–Definition and Compiler Correctness, Technical Report, TR-14/92, Dipartamento di Informatica, Universit`a di Pisa, 1992.
[Bu91]
T. Budd: Object Oriented Programming, Addison Wesley, 1991.
[C88]
B.J. Cox: Objective-C Interpreter version 4.0 User’s Reference Manual, Stepstone Inc. Sandy Hook, CT, 1988.
[Du91]
M. Ducasse: Abstract views of PROLOG executions in Opium, Proceedings ISLP’91, The MIT Press 1991, pp. 18-32.
[Du92]
M. Ducasse: A General Trace Query Mechanism Based on PROLOG, Proceedings PLILP’92, Springer LNCS 631, 1992, pp. 400-414.
[GLLO85] J. Gabriel, T. Lindholm, E.L. Lusk, R.A. Overbeck: A Tutorial for the WAM for Computational Logic, ANL-64-84, Argonne Nat. Lab., 1985. [GM92]
J. Garc´ıa-Mart´ın, J.J. Moreno-Navarro: Friendly-WAM: An Interactive Tool to Understand the Compilation of PROLOG, Proceedings LPAR’92, Springer LNAI 624, Springer Verlag, 1992.
[GM93]
J. Garc´ıa-Mart´ın, J.J. Moreno-Navarro: A Formal Definition of an Abstract PROLOG Compiler, submitted for publication, 1993.
[G83]
A. Goldberg: Smalltalk-80: The Interactive Programming Environment, Addison Wesley, 1983.
[IWCLD88] D. Ingalls, S. Wallace, Y.Y. Chow, F. Ludolph, K. Doyle: Fabrik: a Visual Programming Environment, Proceedings OOPSLA’88, 1988. 1 Notice
that visualization of the program should be a fully automated process
[Ku89]
P. Kursawe: How to Invent a PROLOG Machine, New Generation Comp., 5, 1989.
[Me89]
M.G. Menelaou, J.A. Purchase, R.L. Winder: On Debuggers and Debugging Tools and Techniques, UCL Research Note, London, UK, 1989.
[MW88]
D. Maier, D.S. Warren: Computing with Logic: Logic Programming with PROLOG, Ed. Benjamin Cummings, 1988.
[Nils92]
U. Nilsson: Towards a Methodology for the Design of Abstract Machines for LP Languages, to appear in The Journal of Logic Programming, vol. 6, num. 1, 1993.
[PW91]
J.A. Purchase, R.L. Winder: Debugging Tools for Object Oriented Programming, Journal of Object Oriented Programming, vol. 4, n. 3, June 1992, pp. 10-27.
[Ru89]
D.M. Russinoff: A Verified PROLOG Compiler for the Warren Abstract Machine, Journal of Logic Programming, vol. 13, n. 4, August 1992, pp. 367-412.
[Sha82]
E.Y. Shapiro: Algorithmic Program Debugging, The MIT Press, 1982.
[S88]
R. Stallman: GDB+ Manual, The gnu C++ Debugger, MA, 1988.
[Str90]
B. Stroustrup: The Programming Language C++, Addison Wesley, 1987.
[SM88]
P.A. Szekely, B.A. Myers: A User Interface Toolkit based on Graphical Objects and Constraints, Proceedings OOPSLA’88, 1988.
[Wa83]
D.H.D. Warren: An Abstract Prolog Instruction Set, Technical Note 309, SRI International, Menlo Park, California, October 1983.