1 Introduction. With thousands of ... supplies functions to start tasks in parallel across this virtual machine, allows these tasks to send .... the following views will be added: message queues, network tra c/hot spots, and hierarchical ... Visualization tools such as ParaGraph 4] and Pablo 5] have more than. 25 di erent views ...
Visualization, Debugging, and Performance in PVM G. A. Geist 1 James Kohl Philip Papadopoulos Oak Ridge National Laboratory P.O. Box 2008 Oak Ridge, TN 37831-6367
ABSTRACT
PVM has grown to become the de facto standard for distributed computing around the world. With the increasing numbers of users and applications utilizing the PVM environment, it becomes more important to have debugging and performance tuning tools that work with PVM. This paper describes our most recent developments in these two areas. For PVM debugging we have created a standard interface that allows existing parallel debuggers to attach to and debug PVM applications. For performance tuning we have created the XPVM graphical user interface which displays both real-time and post-mortem animations of message tra�c and machine utilization by PVM applications. We also present our latest research into improving the performance of PVM.
1 Introduction With thousands of users worldwide, PVM (Parallel Virtual Machine) [1] has become the de facto standard for distributed computing. The PVM software package allows a collection of UNIX computers connected to a network to be used as a single, large, parallel distributed memory computer. PVM supplies functions to start tasks in parallel across this virtual machine, allows these tasks to send data between themselves, and coordinates their parallel execution. A wide variety of computers (including serial computers, vector computers, and even shared or distributed memory parallel computers) can make up a user's personal virtual machine. This work was supported in part by the Applied Mathematical Sciences subprogram of the O�ce of Energy Research, U.S. Department of Energy, under Contract DE-AC0584OR21400, and in part by the the National Science Foundation Science and Technology Center Cooperative Agreement No. CCR-8809615. 1
1
The most popular use of PVM is the utilization of a small number of high performance workstations to achieve performance comparable to that of a supercomputer (at signi cantly less cost). The exponential growth in the use of PVM is due to its portability across many di�erent computers, its robustness and ease of installation, and its perception as a standard parallel programming interface. PVM has already outlasted several parallel computer vendors. Development of PVM at Oak Ridge National Laboratory (ORNL) began in 1989 and has now grown into a research project that includes researchers at ORNL, the University of Tennessee, Emory University, and Carnegie Mellon University. In addition to providing support for PVM, the PVM research team continues to explore and incorporate new features into PVM. The research directions are dictated by feedback from PVM users and by changing network and computing technology. PVM has made parallel computing available to a much wider audience than the programming interfaces supplied by individual computer vendors. This means more people with little experience in parallel programming are writing their rst buggy parallel codes. When their programs don't execute as expected, they wonder, \What is going on?" They scratch their heads and wish for some way to see what is happening in their parallel programs. When their programs hang or get the wrong results, they wonder, \What went wrong?" They begin the tedious process of debugging the parallel code and wishing for an easy to use parallel debugger. When their programs nally run, they ask \How can I make the programs run faster?" The research described in this paper focuses on visualization, debugging, and performance enhancements to PVM. In the next section we describe the performance monitoring program, XPVM. In Section 3 we describe several new internal interfaces built into PVM to allow third party debuggers to work with PVM applications. Section 4 presents some new and planned performance enhancements to PVM. Conclusions are presented in Section 5.
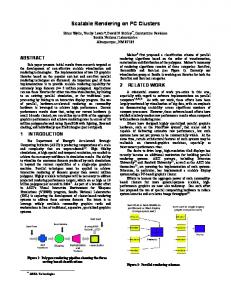
2 XPVM Visualization Package XPVM is a graphical user interface for PVM. Even though the primary function of XPVM is to visualize what is going on inside a PVM application, the interface actually performs four separate functions. First, XPVM is a 2
graphical console allowing a user to start PVM, add hosts, spawn tasks, reset the virtual machine, and stop PVM all by clicking buttons. Second, XPVM is a real-time performance monitor. While an application is running, XPVM displays a space-time diagram of the parallel tasks showing when they are computing, communicating, or idle. The display also animates the message tra�c between tasks. Third, XPVM is a \call level" debugger. The user can see the last PVM call made by each task as the application is running. Fourth, XPVM is a post-mortem analysis tool. XPVM writes out a trace le that can be replayed, stopped, stepped, and rewound in order to study the behavior of a completed parallel run. XPVM is built on TCL/TK [3], which is a library for developing XWindows applications. TCL makes it easy to change, customize, and extend the XPVM interface. Figure 1 shows a snapshot of the XPVM interface during use. The interface is divided into four parts. The top row of buttons perform the basic functions of the textual PVM console. Clicking on Hosts pulls down a menu of hosts that the user may add or delete by clicking on individual names. Clicking on Tasks pulls down a menu that lets the user spawn one or more tasks on the virtual machine. Pressing the Reset button pulls down a menu that allows the user to reset the views, tasks, or the entire virtual machine. The Quit button allows the user to get an application running and then quit XPVM, leaving the application and PVM running. The Halt button kills all running tasks, shuts down PVM, and then exits XPVM. The Help button provides a menu of help items ranging from general overview to speci c buttons functionality. The second part is the network view. This scrolling window shows each of the hosts currently in the virtual machine and the network between them. Each host is represented by an icon that includes the PVM architecture name. The host name is listed underneath each icon. The icons are colored according to the state of the host. White indicates that there are no PVM tasks on the host. Green indicates that at least one PVM task is computing, and yellow indicates that all PVM tasks on the host are doing communication. The network view gives the user a quick way to check if the hosts are e�ciently utilized by observing how much of the time all the host icons are green. The third part of XPVM is the view controls. This section of XPVM allows the user to specify a trace le name, to pop up additional views, to control the post-mortem play of a trace le using standard stereo tape player buttons, and to view the execution time as recorded in the trace le. 3
The fourth part is the space-time view. This window lists all the PVM tasks and on which host they are running. The list is sorted by host, to make it easy to see if one host is unduly loaded with a disproportionate number of tasks. The horizontal axis represents time. Beside each task a bar is drawn. The bar is green when the task is computing, yellow when it is sending or receiving messages, and white when it is idle waiting for a message. Messages between tasks are shown as red arrows between bars with end points re ecting the sending and receiving times. The view can be zoomed in or out to see details not visible at the current magni cation. If the mouse pointer is brought into the window, a vertical blue line follows the pointer and the time display shows the relative position of the blue line. In addition, if any feature in the window is clicked on, for example, a red message arrow, then a description of this feature is displayed at the bottom of the window. For a message, this would include the sender, receiver, size of the message, and the message tag used. There are several other views that are selectable from the Views menu in the view control panel. These include utilization, call-level debugger, and task output. By adding all additional views through this menu, XPVM's visualization capability can be expanded without a�ecting the primary interface. Sophisticated users could even add their own custom views to XPVM. A utilization view is present in every performance monitoring package. It is a graph of the number of tasks versus time and shows the number of tasks computing, communicating, and idle at each moment. In XPVM the utilization view has three additional features. Because the number of tasks in PVM can be dynamic, the scale of the number of tasks changes dynamically during a run (growing but never shrinking). A vertical blue time line follows the mouse pointer in the utilization view exactly as in the space-time view. When this happens, the blue time line is simultaneously displayed in both views so that activities in one view can be correlated to the other. Lastly, when the space-time view is zoomed or scrolled, the utilization view automatically zooms or scrolls to display the same time range. The call-level debugger is a window with the same list of tasks as in the space-time view. Beside each task is a line of text that displays the last PVM call made by this task with the arguments or return values to this call. This view is particularly useful when trying to determine why or if a parallel program has hung, because the last PVM operation by each task is clearly shown. The task output view allows the PVM user to see the stdout output from all tasks spawned through XPVM. Optionally the user my also redirect this 4
output to a le by typing a le name in the blank at the top of this window. This view is very useful for programmers who like to place diagnostic print statements in their programs. Additional views are planned for future releases. In the next few months the following views will be added: message queues, network tra�c/hot spots, and hierarchical host views for multiprocessor hosts. Figure 2 shows a sketch of what these views will look like. The message queue view is a dynamic display of the number of bytes and messages building up in the queues for each task. Since communication in PVM is asynchronous, messages can be sent long before they are received. In addition messages can arrive from several sources faster than a single task can receive them. In both cases the messages are bu�ered in queues inside PVM. Understanding the behavior of these queues during an application's execution can help in performance tuning and debugging. There is also the potential that the size of a queue grows so large that it consumes all available memory on a given host. This view is useful to detect this catastrophic occurence. The network tra�c/hot spots is additional information displayed in the network view by animating the network drawn between the host icons. The instantaneous network volume and bandwidth are displayed on the links between hosts. Color is used to signify the volume of data owing over a given link. Red means more data, blue means less, and black means no data. The idea is to make it obvious and intuitive where the network \hot spots" are for a given application. The thickness of the links is used to signify the bandwidth being obtained between two hosts. This information is being calculated dynamically from the messages being sent in the application and implicitly takes into account the outside loads that may be on the same links. Thicker lines means there is more bandwidth and thinner lines mean less. This is consistent with the phrase, \drinking through a re hose." A hierarchical host view appears when an MPP host icon is clicked. A window appears that mimics the network view in terms of network and host animations except now the hosts become the individual nodes of the MPP and the network is replaced by an animation of the given MPP's communication network. Examples include grid, bus, crossbar, and tree networks. Visualization tools such as ParaGraph [4] and Pablo [5] have more than 25 di�erent views selectable by the user. These tools were developed to help parallel programmers do post-mortem analysis on codes run on massively parallel processors (MPP). Many of these views are not meaningful and in 5
fact can be misleading in the heterogeneous distributed computing environment that XPVM is designed to work in. Other views presented by these tools can only be constructed after the code is nished and thus have no real-time equivalents. Presently, all XPVM views can be watched in realtime as the code runs. The trace le written by XPVM is in SDDF format as de ned in Pablo. The Pablo tool has routines to convert to ParaGraph format. So all the power of these analysis tools are available to the PVM user. For these reasons, the number of views available in XPVM has been kept small and focused on the most useful and important information in the PVM environment.
3 Debugger Interfaces In a recent survey by the PTOOLS consortium it was revealed that 90% of parallel programmers use PRINT statements to discover what is happening in their codes. In the PVM environment the use of PRINT has been problematic. For example, where should a PRINT statement executed on some remote host be sent? The user's local screen? What if there isn't one? To a log le? On what host? So many questions. There are two recent additions to the PVM package that address the PRINT problem. First, the PVM console allows the user to specify stdout redirection to a le or back to the console window. This redirection is inherited by all the tasks spawned through the console, and by all the children of these tasks. For situations where the console isn't or can't be used, a new PVM function pvm catchout() has been added. The task that calls this function will receive the stdout of all the tasks it spawns. The calling task can then print these messages to a screen or to a le. The ability to see their diagnostic print statements appearing in a window on their local host is enough to satisfy most parallel programmers, as shown by the PTOOLS survey. For programmers who wish to use a parallel debugger with PVM, third party debuggers such as TotalView [7] and ParaDyn [6] that work with PVM are now available. A PVM debugger interface was developed so that debugger developers could integrate their products into the PVM environment without having to modify the PVM source. By calling the PVM function pvm reg tasker, the debugger can register with PVM as the o�cial task starter on this host. The PVM daemon then defers all task spawning requests to this debugger. In most cases a debugger 6
needs to actually start the tasks it has to debug. Task control can then be done through the third party debugger just like any non-PVM job, while PVM communication continues to go through PVM as usual. Debuggers can now attach to running PVM tasks as well by asking PVM for a task's machine dependent UNIX pid. This was another feature added to PVM at the request of third party parallel debugger writers. PVM still maintains its own simple debugger scheme. If a task is spawned with the debug ag set, then PVM starts up a default debugger in a new X-window for each requested task. This scheme is not scalable, but it is e�ective in the initial stages of coding. Two additional internal interfaces have been integrated into PVM. These interfaces allow third party resource managers such as Condor [2] and LSF to work with PVM applications. The function pvm reg rm registers the calling task as responsible for all new task placement into the virtual machine. Once registered, PVM defers all requests to this task. Similarly the function pvm reg hoster registers the calling task as responsible for managing the host pool, i.e. adding and deleting hosts. When no resource manager or hoster is registered, PVM performs these jobs as usual.
4 PVM Performance Enhancements The PVM team continues to investigate schemes to enhance the performance of the PVM package. One advantage of this research is that any improvements in the performance of PVM automatically help the hundreds of applications written in PVM. This section describes performance features available in the latest version of PVM and experimental features not ready for release. The communication routines pvm psend and pvm precv combine the initialize, pack, and send operations into a single call reducing the call overhead. The biggest performance gain is seen when using these routines on an MPP. Table 1 shows the performance of psend/precv compared to the native csend/crecv on the Intel Paragon. The table illustrates that psend/precv can be as fast as native communication routines on an MPP.
7
Round trip time (microseconds) msg size (bytes) csend/crecv psend/precv 8 376 322 800 314 314 8000 670 676 80000 3978 4061 Table 1 Comparison of PVM and native Intel Paragon communication speeds. In order to reduce the number of data copies, an InPlace packing option was added. With this option the user's data is left in-place in the user's memory and not copied into a send bu�er. PVM keeps track of what data the user has packed and copies the di�erent pieces directly from the user's memory to the network. This option not only improves the communication speed, but also reduces the bu�er space required inside PVM. When a message is sent between two processors in an SGI, SUN, or DEC multiprocessor, PVM uses shared-memory to move the data up to ten times faster than PVM's TCP socket implementation (table 2). Bandwidth (MB/s) between two tasks msg size (bytes) PVM shared memory PvmDirectRoute 8 0.04 0.004 800 4.93 0.43 80000 19.04 6.46 Table 2 PVM message bandwidth using shared memory vs. TCP sockets on a SPARC10 multiprocessor. UNIX domain sockets are now used in PVM for all local host communication. These sockets were found to be twice as fast as TCP/IP. Collective communication routines like those found in MPI [8] are now available in PVM. These include functions such as broadcast and global sum. These collective routines are being implemented to use native communication calls on MPP such as the Paragon and IBM SP-2. A number of other areas are under investigation to improve the performance of PVM applications in the future. These include exploiting high speed networks, using real network multicast, faster heterogeneous data encodings, bu�ered tracing, static groups, and context. 8
Standard PVM works with ATM networks by using TCP/IP. Experiments have shown that communication between two SPARC2 computers is up to ve times faster on ATM than on ethernet. Other experiments have shown that an additional 30% improvement in possible by using an API below TCP. (FORE Systems supplies such an interface with their ATM cards.) Network multicast is being incorporated into most new operating systems. Multicast sends one message onto a network that is received by a predetermined set of hosts. This is potentially much faster than the present method in PVM, which sends separately to each host. An experimental version of PVM which uses reliable multicast is being tested. Results are not yet available. Currently, PVM uses XDR encoding to send messages in heterogeneous environments. XDR has the advantage of being very portable because the vendors supply the routines as part of the RPC library. XDR has the disadvantage of being rather slow both in its implementation and its execution. First, the sending task must convert the entire message into XDR format. After it is transmitted, the receiver must decode the message from XDR into this host's local format. Experiments have been done using a much faster encoding scheme called Receiver makes Right (RMR). In this scheme the sender always sends the message out as fast as it can, doing no encoding. The receiver has the responsibility of converting the message into the receiving host's format. The advantages are: The routines can be streamlined and thus much faster than XDR; the scheme requires the fewest possible conversions in a heterogeneous environment { at most one vs. always two for XDR; the RMR scheme ts nicely into other PVM extensions such as InPlace data packing; and the RMR scheme avoids the problem XDR has with 64 bit architectures, i.e. XDR is only de ned for 32 bit words. The major disadvantage of RMR is that each receiver must be able to decode every other format, thus many decoding routines could be required. Given the number of machines that PVM supports this number could be as high as 580 routines, but by carefully reusing routines such as byte swap, the actual number of routines that must be written and maintained is approximately 30. Another disadvantage is that RMR is not as portable as XDR because the vendors do not supply the decoders for new architectures they may build. One observation is that almost all new architectures use IEEE data format so this problem may be quite rare. For XPVM to work PVM must send out trace events of what is happening in the virtual machine. These trace messages can be quite intrusive and cause a degradation in performance. (Tracing is turned o� by default.) 9
Experiments have shown that local bu�ering of even a modest number of trace events (20 events) can give a signi cant performance increase over no bu�ering for many (but not all) applications. Because bu�ered tracing is less intrusive, it also results in more accurate monitoring. In order to implement faster collective communication operations and more e�cient group operations on multiprocessors, investigations are underway to add the concept of static groups to PVM. Initially all groups are dynamic in PVM. Group members can join and leave asynchronously. What may be added is a way the user can specify that a group is now static { its membership will no longer change. Once this occurs, PVM can cache the group information on the tasks. Finally, there are plans to incorporate the concept of context into PVM. Context as de ned in the MPI documentation isolates a communication space and allows the creation of \safe" parallel libraries in PVM. Since math libraries simplify application development while also supplying fast, robust, parallel implementations, the addition of context into PVM will improve application performance. Unlike MPI, PVM will incorporate context as an option such that all existing code continues to run unchanged and users need not understand or use context calls unless they require them.
5 Conclusions PVM's popularity around the world means that increasing numbers of programmers are being exposed to parallel computing. Because of the di�culties in writing and tuning parallel programs, it becomes important to have debugging and performance tuning tools that work with PVM. This paper described the most recent developments in these two areas. For performance tuning we have created the XPVM graphical user interface which displays both real-time and post-mortem animations of message tra�c and machine utilization of PVM applications. XPVM also functions as a PVM console allowing the user to start PVM and spawn tasks. There are also high level debugging capabilities in XPVM. For PVM debugging we have made it easier for users to see their diagnostic print statements (still the most popular method of debugging). For users who want to use a parallel debugger, PVM now contains a standard interface that allows third party parallel debuggers to attach to and debug PVM applications. We also presented recent performance enhancements added to PVM and show results where communication speed can be boosted by up to an order of magnitude. We described our 10
latest research in improving the performance of PVM including exploiting ATM networks, multicast, faster encoding schemes, context, and bu�ered tracing.
References [1] A. Geist, A. Beguelin, J. Dongarra, W. Jiang, R. Manchek, and V. Sunderam, PVM, MIT Press, 1994. [2] A. Bricker, M. Litzkow, M. Livny \Condor Technical Summary", University of Wisconsin-Madison, Computer Sciences Technical Report 1069, 1992 [3] J. K. Ousterhout, \An X11 Toolkit Based on the Tcl Language," 1991 Winter USENIX Conference. [4] M. T. Heath, J. A. Etheridge, \Visualizing the Performance of Parallel Programs," IEEE Software, Volume 8, Number 5, September 1991, pp. 29{40. [5] D. Reed, R. Olson, R. Aydt, T. Madhyastha, T. Birkett, D. Jensen, B. Nazief, B. Totty, \Scalable Performance Environments for Parallel Systems," Proceedings of the Sixth Distributed Memory Computing Conference, IEEE Computer Society Press, April 1991. [6] B. Miller J. Hollingsworth, M. Callaghan, \The ParaDyn Parallel Performance Tools and PVM", University of Wisconsin-Madison, Computer Sciences Technical Report 1994 [7] BBN Corporation "TotalView", Product Literature. [8] MPI Forum, \MPI: A Message-Passing Interface Standard", International Journal of Supercomputer Application Vol. 8 No. 3/4, 1994.
11