Indonesian Journal of Electrical Engineering and Informatics (IJEEI) Vol.1, No.1, March 2013, pp. 27~42 ISSN: 2089-3272
27
Visualization for Information Retrieval based on Fast Search Technology Mamoon H. Mamoon1, Hazem M. El-Bakry2, Amany A. Salama3 Faculty of Computer Science & Information system, Mansoura University, Egypt Corresponding author, e-mail:
[email protected],
[email protected]
Abstract The core of search engine is information retrieval technique. Using information retrieval system backs more retrieval results, some of them more relevant than other, and some is not relevant. While using search engine to retrieve information has grown very substantially, there remain problems with the information retrieval systems. The interface of the systems does not help them to perceive the precision of these results. It is therefore not surprising that graphical visualizations have been employed in search engines to assist users. The main objective of Internet users is to find the required information with high efficiency and effectiveness. In this paper we present brief sides of information visualization's role in enhancing web information retrieval system as in some of its techniques such as tree view, title view, map view, bubble view and cloud view and its tools such as highlighting and Colored Query Result.
1. Introduction The typical generic scenario for searching, retrieving, and displaying information is the following. A user has an information need about a certain topic. With a user interface he/she formulates a query to the system [1]. The query starts an action in the system (search engine, information retrieval (IR) system, digital library, or other) [2]. The system will retrieve (or not) objects and will display them with appropriate messages and layouts in the same graphical user interface (GUI) where the user entered the query (3). Finally, the user decides if the documents are relevant or not. He/she can either exit the system because the information was found or refine the query and start again [2]. Information retrieval (IR) is the task of representing, storing, organizing, and offering access to information items [1]. The problem for search engines is not only to find topic relevant results, but results consistent with the user’s information need. How to retrieve desired information from the Internet with high efficiency and good effectiveness is become the main concern of internet user-based [3]. Search engines interfaces are intuitive and in some cases restricted by the nature of the WWW. There is a limited use of color, no pull-down menus, and limited user interaction. The typical input interface is a simple box where the user fills the terms to search plus button to submit the query. The visualization process of the answers can be text only or more rich and complex with the use of a graphical metaphor. In the text only approach, the user gets a list of the top 10 or 20 best documents that potentially contains the information. The list usually contains the title, its URL, size, date, and an abstract of no more than 4 lines of the document. The user opens each document until the desired information is finally located. This is not a problem when the target document is located in the first 20 answers. It becomes a problem when the output of a query is a list of hundreds or thousands of documents. A graphical metaphor presents a rich interface in which the user can browse, filter, process, and reformulate the query [2]. User behavior, performance and attitude were recorded as well as usability problems. The system had few usability problems and users liked the visualizations, but recall performance was poor. The reasons for poor/good performance were investigated by examining user behavior and search strategies. Better searchers used the visualizations more electively and spent longer on the task, whereas poorer performances were attributable to poor motivation, difficulty in assessing article relevance and poor use of system visualizations [15]. Hence, visualization is an effective tool to partially solve data overload problems in WWW retrieval when answers contain hundreds of documents. The visualization of quantitative information consist of principles to help achieve the main goal: communicate complex ideas with clarity, precision, and efficiency [2].
Received January 14, 2013; Revised March 7, 2013; Accepted March 18, 2013
28
ISSN: 2089-3272
This survey paper contains problems that faced web information retrieval system whether because of the web nature or user activity or searching process itself. Then, how the search engine works and models of information retrieval. Next, the meaning of visualization, information visualization as one of its application and how it enhances web information retrieval system. Finally, real systems used information visualization tool in reducing and solving some of web information retrieval system's problems.
2. Problem Definition The World Wide Web is a huge, widely distributed, global source for information services, hyper-link information, access and usage information and web site content and organization [4]. There is a huge quantity of text, audio, video, and other documents available on the Internet, on about any subject. Users need to be able to find relevant information to satisfy their particular information needs. There are two ways of searching for information: to use a search engines or to browse directories organized by categories (such as Yahoo Directories). There is still a large part of the Internet that is not accessible (for example private databases and intranets) [1]. By all measures, the web is enormous and growing at a staggering rate, which has made it increasingly intricate and crucial for both people and programs to have quick and accurate access to web information and services [4]. It is not surprising that about 85% of internet users surveyed claim to be using search engines and search services to find specific information of interest [5, 6]. The same surveys show, however, those users are not satisfied with the performance of the current generation of search engines; the slow speed of retrieval, communication delays, and poor quality of retrieved results (e.g., noise and broken links) are commonly cited problems [5]. Search engines have played a key role in the World Wide Web's infrastructure as its scale and impact have escalated. Although search engines are important tools for knowledge discovery on the web, they are far from perfect. The poor quality of retrieved results, handling a huge quantity of information, addressing subjective and timevarying search needs, finding fresh information and dealing with poor quality queries are commonly cited glitches [4]. There are many problems with different reasons which it can be by the web nature, users, search engine and hardware. 2.1. Problem when Interacting with the Web (web nature): a. The "abundance" problem: With the phenomenal growth of the web, there is an ever increasing volume of data and information published in numerous web pages. According to world wide websize.com, the indexed web contains at least 27.56 billion pages (Sunday, 24 august, 2008) [4], 27.87 billion pages (Sunday, 22 June, 2008) [6] and about 8 billion web pages were indexed by Google in 2005 [1]. b. Web search results usually have low precision and recall: For finding relevant information, the search services is generally a keyword-based, query-triggered process which results in problems of low precision (difficulty to find relevant information) and low recall (inability to index all information available on the web). c. Lack of personalization of information and limited customization to individual users: Most knowledge on the web is presented as natural-language text with occasional pictures and graphics. This is convenient for human users to read and view but difficult for computers to understand. It also limits the state of art search engines, science they cannot infer contextual meaning. For example the occurrence of word 'bat' refers to a bird or to a cricket bat. These factors uphold the inevitable creation of intelligent server and client-side systems that can effectively mine for knowledge both across the internet and in particular web localities [4]. d. Heterogeneity: ‐ Information/data of almost all types exist on the web, e.g., structured tables, texts, multimedia data, etc. ‐ Much of the web information is semi-structured due to the nested structure of HTML code. ‐ Much of the web information is linked ‐ The web is noisy: a web page typically contains a mixture of many kinds of information, e.g., main contents, advertisement, navigational panels, copyright notices [4, 6]. ‐ Much of the web information is redundant [6]. IJEEI Vol. 1, No. 1, March 2013 : 27 – 42
IJEEI
ISSN: 2089-3272
29
e. Dynamics: The freedom for anyone to publish information on the web at anytime and anywhere implies that information on the web is constantly changing. It is a dynamic information environment whereas traditional systems are typically based on static document collection [4, 6]. This dynamic nature guarantees that at least some portions of any manuscript on the subject will de out-of-date before it reaches the intended audience, particularly URLs which are referenced [5]. f. Duplication: Several studies indicate that nearly 30% of the web's content is duplicated, mainly due to mirroring [4, 6]. g. A comprehensive coverage of all of the important topics is impossible, because so many new ideas are constantly being proposed and either quickly accepted into the internet mainstream or rejected [5]. Different between IR and IR on web = challenges = problem definition that facing searchers and developers because of web nature. 2.2. Problems about Users (Information Searching Activity) The typical Information Retrieval (IR) systems now available are characterized by a representation of a request for information (query) and the system usually responses with a set of results which most closely matches the request. Whatever representation of a request the seeker has to formulate, he has often to face with problems related to the clear specification of his information needs [7]. If the search is performed in a distributed and heterogeneous environment as web, the search becomes harder: the seeker anxiety grows up according to the heterogeneity and the amount of information available in World Wide Web. It generates the following problems [8]: a. All users are not created equal: Different users may use different terms to describe similar information needs; the concept of "what is relevant" to a user has only become more and more unclear as the web has matured and more diverse data have become available. Because of this, it is of key interest to search services to discover sets of identifying features that an information retrieval system can use to associate a specific user query with a broader information need [4]. b. The ambiguity of the natural language (English or other languages) that makes it difficult to have perfect matches between documents and user queries [1]. c. User search behavior: The users have different expectations and goals such as informative, transactional and navigational. Often they compose short, ill-defined queries and impatiently look for the results mainly in the top 10 results [6]. d. Problem of vocabulary: "Which term to use?" The difference in terms of knowledge and perception between the information providers and the seeker has been modeled in terms of informative space and cognitive space. The former is defined as a set of object and relations among them held by the system whereas the latter is defined as a set of concepts and relations among them held by individual. Information providers organize their resources according to their knowledge and to the vocabulary that concurs in building the “informative spaces”. If seekers have a different knowledge background, or a different purpose, then his cognitive space has a poor overlapping to the information space. This make reasonable to assume they will use different terms to identify the same concept. So they have to discover which the proper terms to express a query in the information space. e. Query formulation/refinement: “how to modify the query to find more relevant information?". f. Seeker anxiety: The gap between what the seeker understands and what he thinks he should understand generates anxiety. This happens whenever information does not fulfill his needs. g. Seeker and provider relationship: seeker and provider have different skill levels and different domain of knowledge. Moreover there is usually no direct interaction among them. h. Seeker knowledge: the seeker has often only a perception of his information needs. He has a limited knowledge of what he is looking for. i. Database selection: "which search engine to select?" The problem is well known in the WWW because the actual search engines are able to cover a limited portion of the web resources. The seeker has to decide which search engine to make use of. Visualization for Information Retrieval based on Fast Search Technology (Mamoon H. Mamoon)
30 j.
k.
ISSN: 2089-3272
Information overload: "how to explore many retrieved documents?" user still has to face with huge amount of candidates, which are all pertinent to what he is looking for. He needs to be supported in the analysis of heterogeneous information sources to be able to choose the most suitable ones for his purpose [8]. Query coordination: The seeker may need to be supported in the choice for queries. Human behavioral studies during the search activity have shown that the user is lazy and usually tends to create short queries and rarely adopts Boolean expression in his query criteria. Whenever the seeker needs information, which might seriously affect the results of his work, he is forced to a deeper search.
2.3. Problems of Searching The unprecedented growth of available data coupled with the vast number of available online activities has introduced a new wrinkle to the problem of search: it is now important to attempt to determine not only what the user is looking for, but also the task they are trying to accomplish and the method by which would prefer to accomplish it [4]. 2.3.1. Problems faced search engine in IR process on the web 1. There are many publicly available search engines, but users are not necessarily satisfied with: a. The different formats for inputting queries. b. Speeds of retrieval. c. Presentation formats of the retrieval results. d. Poor quality of retrieved information [5, 6]. In particular, speed (i.e., search engine and retrieval time plus communication delays) has consistently been cited as " the most commonly experienced problem with the web" in the bi-annual WWW surveys conducted at the Graphics, visualization, and Usability Center of Georgia Institute of Technology 63% to 66% of web users in the past three surveys, over a period of year and a half were dissatisfied with the speed of retrieval and communication delay, and the problem appears to be growing worse. Even though 48% of the respondents in the April 1998 survey upgraded modems in the past year, 53% of the respondents left a website while searching for product information because of "slow access". "Broken links" registered as the second most frequent problem in the same survey. Other studies also cite the number one and number two reasons for dissatisfaction as "slow access" and "the inability to find relevant information" respectively [5]. 2. Limited query interface based on keyword-oriented search: It is hard to extract useful knowledge out of information available because the search service used to find out specific information on the web is retrieved-oriented, whereas to extract potentially useful knowledge out of it, is a data-mining oriented, data-triggered process [4]. 3. Indexing web pages to facilitate retrieval is a much more complex problem than with classical databases because of: a) The enormous number of existing web pages and their rapid increase. b) Frequent updating. c) Removal of spurious information (e.g., newsgroup discussions, FAQ postings) [5]. d) Handling a huge quantity of information, addressing subjective and time-varying search needs. e) Finding fresh information. f) Dealing with poor quality queries [6]. So we can summarize challenges that face motivating researchers in web IR in improved system that retrieve the most relevant information available on the web to better satisfy a user's information need, or in the other words, combination of challenges that stem from traditional information retrieval and challenges characterized by the nature of the World Wide Web.
3. Web Information Retrieval 3.1. How Web Search Engines Work A search engine operates in the following order: Web crawling, Indexing, and Searching, as declare in Figure 1. Web search engines work by storing information about many web pages, which they retrieve from the HTML itself. These pages are retrieved by a Web
IJEEI Vol. 1, No. 1, March 2013 : 27 – 42
IJEEII
IS SSN: 2089-32 272
31
crawller (also kno own as a spid der — an au utomated We eb browser which w followss every link on o the site). Exclusions can be mad de by the usse of robots.txt. The con ntents of ea ach page are e then analyyzed to deterrmine how it should be in ndexed (for example, e wo ords can be e extracted fro om the titles,, page conte ent, headingss, or speciall fields called Meta tagss). Data about web page es are stored in an inde ex database for use in la ater queries. A query can n be a single e word. The index helpss find informa ation as quickly as possib ble. Some se earch engine es, such as G Google, store e all or part of o the source e page (refe erred to as a cache) as well as inforrmation abou ut the web pages, p where eas others, such s as AltaVista, store every word of o every pag ge they find. This cached d page alwayys holds the actual searrch text since e it is the on ne that was actually inde exed, so it can c be very useful u when the content of the curren nt page has been b update ed and the se earch terms are a no longe er in it. This problem p might be consid dered a mild form of linkrrot, and Goog gle's handlin ng of it increa ases usabilitty by satisfying user expe ectations tha at the search h terms will b be on the retturned webp page. This sa atisfies the principle of least astonishment, since the user norrmally expectts that the search s termss will be on n the returne ed pages. In ncreased se earch relevance makes these cache ed pages ve ery useful, evven beyond the t fact that they may co ontain data th hat may no longer l be avvailable else ewhere. Whe en a user en nters a query y into a search engine ((typically by using keyw words),where the channe el connection n between his h and the system is u user interfac ce the engin ne examiness its index an nd provides a listing of best-matchin b ng web page es according to its criteria, usually with w a short su ummary containing the document's title and some etimes parts of the text. The index iss built from the t information stored with w the data and the metthod by whic ch the inform mation is indexed. Most search s engin nes support the t use of the e Boolean op perators AND D, OR and NOT N to furth her specify the t search query. q Boole ean operatorrs are for lite eral searche es that allow w the user to refine and extend e the te erms of the search. s The engine lookks for the words or phrasses exactly as a entered. Some S search h engines pro ovide an advvanced featurre called pro oximity searcch, which alllows users to t define the e distance be etween keyw words. There e is also con nceptbased d searching where the re esearch invo olves using statistical s ana alysis on pag ges containin ng the wordss or phrasess you search h for. As we ell, natural la anguage que eries allow the user to type t a questtion in the sa ame form one e would ask it to a human n. A site like this would b be ask.com.
Useer interface 1 How Searc ch Engine Works W Figure 1. ne depends on the relevvance of the result set it gives The useffulness of a search engin back.. While there e may be milllions of web b pages that include a pa articular word d or phrase, some pages may be mo ore relevant, popular, or authoritative e than otherss. Most searcch engines employ methods to rank the results to provide the t "best" re esults first. How H a searcch engine de ecides which h pages are the t best mattches, and what w order the e results sho ould be show wn in, varies widely w from one engine to t another. The T methodss also change e over time as a Internet ussage change es and new techniques t e evolve. There e are two ma ain types of search engin ne that have e evolved: on ne is a syste em of predefined and hierrarchically orrdered Figure e 1. Keywordss that huma ans have prrogrammed extensively. The other is a system m that generates an "inverted indexx" by analyzzing texts it locates. Thiss first form relies much more heavily on the com mputer itselff to do the bu ulk of the worrk [10]. User interface:
Visua alization for Information I R Retrieval bassed on Fast Search S Tech hnology (Mam moon H. Mam moon)
32
ISSN: 2089-3272
Information seeking has become increasingly interactive as tools and services on the WWW have evolved. Thus, there is more to searching than typing in a query and waiting for the search engine to display a set of possible web pages. The only way to achieve substantial advances in search and browse capabilities is to combine research and development in humancomputer interaction with research and development in information retrieval to create highly interactive systems that engage the user in defining their needs iteratively and going beyond retrieval to understanding the corpus and the retrieved information [9]. The current user interface and its tool and evaluation in detail in user interface section, and its more activity and its developing in information visualization section. 3.2. Web Information Retrieval Models Retrieval models form the theoretical basis for computing the answer to a query. A Retrieval Model is a formal representation of the process of matching a query and a document. The model of Web IR can be defined as a set of premises and an algorithm for ranking documents with regard to a user query. More formally, a Web IR model is a quadruple [D, Q, F, R (qi,dj)] where D is a set of logical views of documents, Q is a set of user queries, F is a framework for modeling documents and queries, and R(qi,dj) is a ranking function which associates a numeric ranking to the query qi and the document dj. The model is characterized by four parameters: 1. Representations for documents and queries, which define the model. 2. Matching strategies for assessing the relevance of documents to a user query, which involves learning parameters from query. 3. Methods for ranking query output. 4. Mechanisms for acquiring user-relevance feedback. Retrieval models can describe the Computational process, for example, how the documents are ranked and note that how documents or indexes are stored is implementation. The Retrieval models can also attempt to describe the User process, for example, the information need and interaction level. The Retrieval variables are usually depicted by queries, documents, terms, relevance judgments, users & information needs. They can have an explicit or implicit definition of relevance. First Dimension: Computational Process: The Mathematical Basis According to the first dimension, the models can be classed into three types: set theoretic, algebraic and probabilistic models. In the following sections, we describe instances of each type. 1. Set theoretic models Documents are represented by sets that contain terms. Similarities are derived using set-theoretic operations. Implementations of these models include the Standard Boolean Model, the Extended Boolean Model and the Fuzzy Model. The strict Boolean and fuzzy-set models are preferable to other models in terms of computational requirements, which are low in terms of both the disk space required for storing document representations and the algorithmic complexity of indexing and computing query-document similarities. 2. Algebraic models Documents are represented as vectors, matrices or tuples. These are transformed using algebraic operations to a one-dimensional similarity measure. Implementations include the Vector Space Model and the Generalized Vector Space Model. The strength of this model lies in its simplicity. Relevance feedback can be easily incorporated into it. However, the rich expressiveness of query specification inherent in the Boolean model is sacrificed. 3. Probabilistic Models Document's relevance is interpreted as a probability. Documents and queries similarities are computed as probabilities for a given query. The probabilistic model takes these term dependencies and relationships into account and, in fact, specifies major parameters such as the weights of the query terms and the form of the query document similarity. Due to its simplicity and efficient computation, the Vector Model is the most widely used model in IR. The model requires term-occurrence probabilities in the relevant and irrelevant parts of the document collection, which are difficult to estimate. However, this model serves an important function for characterizing retrieval processes and provides a theoretical justification for practices previously used on an empirical basis (for example, the introduction of certain termweighting systems). IJEEI Vol. 1, No. 1, March 2013 : 27 – 42
IJEEII
IS SSN: 2089-32 272
33
Seco ond Dimensiion: User Prrocess: The Relevance Basis Another dimension d off defining diffferent categ gories of Web b IR modelss can be bas sed on their applications as follows: 1. Cla assical mod dels Query lan nguages, ind dexing (Boole ean) ng ranking and weighting g (Vector Spa ace). Introducin opical releva ance models s 2. To IR as Bayyesian classiification, rele evance inform mation, tf.idf weights w (BM M25) o documentss, queries, to opics (Language Modelin ng). Probabilisstic models of ser relevanc ce models 3. Us Combinations of evide ence, feature es, query lan nguage (inferrence networrk, Inquery). near feature e-based mod dels 4. Lin Learning weights, arb bitrary featurres, optimizin ng effectiveness measure es (Ranking SVM, Linear Discriminant, MRF) M g to Rank”, le earning rankiing rather tha an classificattion, preferen nces [6]. “Learning User Interface 3.3. U The curre ent user inte erface in mosst search engine as Goo ogle, yahoo!,, … etc calle ed List View. The List Viiew (Figure 2) 2 is the classsic search results view. It contains a list of files s that, based d on Boolean n logic, matcch the users query. Each file name iss shown along with the nu umber of “hits” from the query. A hit is defined ass one occurre ence of one query term in n the file con ntents. The files f are listed d in descend ding order of the total num mber of hits.
Fig gure 2. List View V This view w also contains a File Vie ewer window w that will dissplay the texxtual contentts of a seleccted file in order o to allo ow quick revview of the file contents. Matching query term ms are highliighted in diffferent colors to aid the user identify where w these terms occurr in the docu ument. Any non-textual content, such as images, etc. in the actual document d a are not displayed. Simila arly, some of the source document fo ormatting will be lost as only o line and paragraph breaks b are preserved p in the t extraction process. Double clicking on a selected file displays the e original doccument in a separate window. Such a view, altho ough elemen ntary, is simp ple, intuitive, provides cla arity and a qu uick preview of the documents. Unsu urprisingly, most m evaluattion participa ants gave strong suppo ort to this vie ew as both easy to use (89% who Agree A or Stro ongly Agree) and useful (86%) ( in reviewing the re esults. The evaluators e likked the highllighting of the e search term ms in the file e viewer and clear indicattion of the number of hitss per result file, f and sugg gested impro ovements related to more e flexible sortting of the results r and more docum ment and result information to be made m easily available. These T resultts confirm th hat the basicc de-sign and operation of the deskttop search e engine is efffective and useful u [11]. The follo owing describe efforts to o improve search s interffaces by inccorporating visual inform mation into display using techniques from f the field d of information visualization. Visua alization for Information I R Retrieval bassed on Fast Search S Tech hnology (Mam moon H. Mam moon)
34
ISSN: 2089-3272
4. Visualization Visualization is any technique for creating images, diagrams, or animations to communicate a message. Visualization through visual imagery has been an effective way to communicate both abstract and concrete. Applications of visualization are scientific visualization, educational visualization, information visualization, knowledge visualization, product visualization, systems visualization, visual communication, and visual analytics [14]. Most web search engines are text-based. They display results from input queries as long lists of pointers, sometimes with and sometimes without summaries of retrieved pages. Future commercial systems are likely to take advantage of small, powerful computers and will probably have a variety of mechanisms for querying non-textual data (e.g., hand drawn sketches, textures and colors, speech) and better user interfaces to enable users to visually manipulate retrieved information [5]. From that the role of information visualization appears as declare in the following. 4.1. Information Visualization Information visualization is all about making data visible or more precisely, the patterns that are hidden in the data. This is a method of presenting data or information in non-traditional and interactive graphical forms. By using 2-Dor 3-Dcolor graphics, text and animation, these visualizations can show the structure of information, allow one to navigate through it, and modify it with graphical interactions [13]. Chaomei chen writes "information visualization aims to maximize our perceptional and cognitive abilities to make sense of visual-spatial representations". Information visualization strives to make the information more accessible and less structured to improve usability. In the Web, Information Visualization provides visualization approaches to manage big amount of information in a summarized way and graphical interaction techniques to manipulate the search results [7]. The human perceptual system is highly attuned to images, and visual representations can communicate some kinds of information more rapidly and effectively than text. The goal of information visualization (INFOVIS) is to translate abstract information into a visual form that provides new insight about that information [12]. And is not pictures, but insight, It’s not about looking at pictures; it’s about interacting with them to "amplify cognition". Information visualization joins the human’s capacity of visual thinking and the computer’s capacity of analytical computing, thereby building a bidirectional visual and interactive interface between human user and the information resources. Very few information visualization applications do away with text altogether. The goal is to find the representation appropriate for a particular task. In many situations text remains the best form of representation. But we all know from experience that many complex ideas are best represented visually. Justas movies did not eliminate the novel; information visualization will not eliminate the need for text. Information visualization will only succeed if it solves the scalability problem. This view assumes that the really big problems are the only interesting ones, and the only hard ones. It also assumes that if the data set has billions of elements, it is important to display all of those elements at once. In many situations the real challenge is to narrow the billions down to a more reasonable and manageable subset. This is where data mining begins to play an important role. Size and scalability are important issues, but it is a mistake to think that information visualization only applies to extreme problems. Information visualization is about speed. It is sometimes said that information visualization aims to help us move from slow reading to faster visual perception, and that it can help us deal with information overload by allowing us to process more information faster. This is only true up to a point. Information visualization is about insight, not pictures. Insight means understanding and creating knowledge and learning. Those processes often require reflection, combination, and rearrangement. The speed element of information visualization aims to reduce the cognitive load of certain tasks so that larger, more complex tasks become possible. Particular tasks may be made more efficient, but information visualization can also open up a range of new tasks that were previously impossible or simply not feasible because they were too burdensome [13]. Guidelines for designing information visualizations are available from writers such as Few (Few, 2006, Few, 2009) and Tufte (Tufte, 1983, Tufte, 1990b). Some of these guidelines overlap with guidelines from graphic design, including the need to present information clearly, precisely, and without extraneous or distracting clutter. Other guidelines relate to the special IJEEI Vol. 1, No. 1, March 2013 : 27 – 42
IJEEII
IS SSN: 2089-32 272
35
purpo oses of visualization. Go ood visualiza ations use graphics g to organize o info ormation, hig ghlight imporrtant informa ation, allow for f visual com mparisons, and a reveal pa atterns, trends, and outliiers in the data. d Visualizzation guide elines are alsso derived from f principles of human perception n, and urge the designerr to be aware e of the perce eptual prope erties which can c affect the e design [12]]. T fo or Interactiv ve Visualizattion 4.2. Technique The challlenge is to im mprove efficiency and efffectiveness of o search an nd result sele ection. In this respect, th he metaphorr that “a pictu ure paints a thousand words” w neatlyy encapsulate es the conce ept that well presented graphical g vie ews can conv vey large am mounts of co omplex inform mation in a simple and easy to understand manner. m It is s therefore not surprising that gra aphical visua alizations have been em mployed in search engiines to assiist users. W While each of o the individual visualizzation might not be new by itself, we e believe tha at the seamless integrattion of these e views and value-added functionaliity in them are novel to o assist in th he results re eview, selecction and que ery refinemen nt. The design d of the e user interface was base ed on the following research premisess: Vissualizations can c assist ussers to search for docume ents. Diffferent visualizations can n be used to o support diff fferent eleme ents of the ssearching prrocess (ressults review and query re eformulation)). Diffferent graph hical techniques can be used to as ssist users to t visualize different kin nds of info ormation. Vissualizations work w best wh hen they are kept simple. The search engine GUI G has a plu ug-in view arrchitecture th hat allows diffferent views s to be created independ dent of the searching mechanism [11]. Severral interactivve technique es are imporrtant to inforrmation visua alization [12]]. Five views s were constructed for usse and evalu uation: Tree View, Map View, V Bubble e View, Tile View V and Clo oud View. 1) Tree View The Tree e View is siimilar to the e List View (in Figure 3) 3 except th he result file es are organ nized based on their underlying fold der structure. For each file f in the results list, all of its paren nt folders are e added to th he folder hie erarchy (avoiding duplica ates). The Re esult files are e then added into the tre ee at the app propriate folder for their physical locattion.
Figu ure 3. Tree View V This view w is very sim milar to the Microsoft M Windows Explo orer view. H However, only y files that match m the qu uery string arre displayed and only the e parent fold ders of these e files are inc cluded in the e tree. The purpose p of this view is to t use the ph hysical file structure s as part of the results r displa ay. If users have taken the time to organize o the eir documentts into mean ningful folderrs and hierarchies then this t information may be useful u when reviewing re esults. This vview is partic cularly d for thesaurrus or taxono omy based fo older organiz zations wherre documentss are stored in the suited respe ective nodes of this organization scheme. As suc ch, related documents w would already y have been assessed and a organize ed into folder hierarchies s that will he elp users to quickly zoom m into erest. With the t familiarityy of Window ws Explorer, participants strongly indicated documents of inte that this t view wass easy to use (93%) and d useful (91% %) in reviewin ng the resultts. They foun nd the
Visua alization for Information I R Retrieval bassed on Fast Search S Tech hnology (Mam moon H. Mam moon)
ISSN: 2089 9-3272
36
view clear and ob bvious. 87% of them ackknowledged that if they had organize e their documents logica ally in folderss, then this view v would be e especially useful for the em. This confirms the de esign premisse that the user’s folder structure iis a useful aid to prese ent search results, as well as a means to logically organize e informatio on in thesa aurus/taxono omy-like strucctures that ca an support browsing b as well w as searcching. 2) Map View The Map p View (Figurre 4) provide es an overviiew of the re elationship b between the query termss and the ressult files. Ea ach query terrm is depicte ed as a blue rectangle and each result file as a green ellipse e. Lines link related querry terms and results files. These are annotated (in red) with the t number of o occurrence es of the que ery term in th he result file. The view w can be zoo omed and rotated and individual shapes can be moved around on scree en to obtain views v that are more legible and avoiid cluttering. If the mouse e is moved over o a queryy term it will display a popup window that lists all the result files that conta ain the query y term along g with their respective r number of hitts (not show wn in Figure 4). Similarlyy, if the mou use is move ed over a ressult file then a popup window will display all the e query termss found in th his file with their t respective hit countss (Figure 4).
Figure 4. Map View V w shows how w individual query q terms affect the results and w which files co ontain This view one or o more que ery terms. Th his bird’s eyye view can be used to detect problems in the query speciification if the e required re esults are not as expecte ed. It will clea arly show the e relative influ uence of each query terrm in producing the result files and th herefore help p the user in n deciding wh hether the query q needs to be reform mulated and how to do so. s The evaluation found d that slightly y over half of o the evalu uators (51%) agreed orr strongly ag greed that the t Map Vie ew was use eful in review wing their query results and reform mulating theirr query. The e distribution of responses for ease of use and usefulness are very sim milar. Qualita ative comme ent analysis indicated that the most useful aspe ect noted byy the evaluattors (35%) was w the ability to see an overview of the relatio onship betwe een the query terms and d the results files. This was w the desig gn premise for f the Map View V – to pro ovide a clearr overview off the query and a its effect on matched results. How wever, the view can beccome very crrowded for complex Boolean queriess with a large e number of items displa ayed resultin ng in overlapping of the e graphic ob bjects. A significant num mber of evalu uators (36% %) indicated th hat this caussed confusion n. 3) Bubb ble View Boolean logic system ms make it difficult to judge the relevvance of a re esult file. The e total numb ber of hits allone is not necessarily n a good guide e to relevance especiallyy when docu ument length is taken into considera ation. Therefo ore, it neither is desirable e to normalizze this meas sure to take into accountt document size. s In this work, w a hit density d is calculated as tthe number of o hits per 1,000 searcha able terms (n non-stop worrds) in the do ocument. The intention i of the t Bubble View V (Figure e 5) is to help the user better b assesss the relevan nce of different docume ents. The axxes of the graph g are th he number of o hits and the calculated hit density. These measures m are used to disttribute the do ocuments alo ong each axxis as they prrovide good document discriminatio d on in order to o achieve a better visua alization. The diameter of the IJEE EI Vol. 1, No o. 1, March 2013 2 : 27 – 42 4
IJEEII
IS SSN: 2089-32 272
37
bubble is determ mined by the e number off query term ms present in n the result file and its color repre esents its file type.
Figure 5. Bubble View ed to contain n the most re elevant docum ments as botth the numbe er and Quadrantt 1 is expecte C gly, quadran nt 4 will be expected to contain the e least density of hits is greatest. Correspondin ant documen nts, as both the hit coun nt and densitty are smalle est. The disp play suggestts that releva documents should be explo ored in priorrity accordin ng to the Quadrant Q numbers. The view there efore attemptts to provide an overview w of documen nt relevance for a given q query and aid ds the review w of docume ents most like ely to be rele evant to the query. q The evaluation resultts show thatt 46% of the e evaluatorss found this view useful in reviewing their querry results. Th he majority fo ound the pos sition (65%) and size (59 9%) of the bu ubbles gave them useful information n, which sup pports the co oncept of thiss view as a means to convey severral dimensio ons about th he relevance e of the results docume ents. The co omments an nalysis show wed that usefful features were w the abiliity to get a quick and eassy overview o of the relevancy of the re esults and the ability to see the hit de ensity. The major confusion n factors re elated to th he display of o a large number of result documents where e the titles overlap o and become unrreadable and d the displayy was found to be very cluttered and d messy. Suggestions fo or potential im mprovement relate mainly to improvin ng the layou ut to increase e clarity and for f help on how h to interpret the view. 4) Tile View V The Tile View V (figure n.6) presentts each result file as a co olored tile using a Tree map. m A Tree map is “a sp pace-constra ained visualizzation of hie erarchical structures”. The size of each tile is dettermined by a measure such as Tota al Number of o Hits, File Size, S and Hitt Density (Hiits per 1,000 0 searchable e terms). Using the conttrol panel, th he user can change the measure us sed to deterrmine the sizze of a tile. As A before, th he color of a tile is deterrmined by itss file type an nd the displa ay can be resstricted to ce ertain file types.
gure 6. Tile View V Fig
Visua alization for Information I R Retrieval bassed on Fast Search S Tech hnology (Mam moon H. Mam moon)
ISSN: 2089 9-3272
38
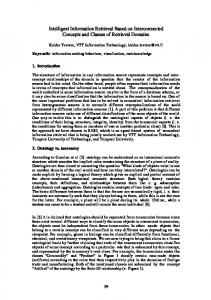
The Tile View can op ptionally inclu ude the folde er hierarchy of the resultts files (not shown s in figure). In this variant, all th he result file es in a speciffic folder are e grouped together in a “super “ tile”. Each folderr is enclose ed within a tile t represen nting its parrent so that the entire folder structture of the re esults files can c be displa ayed. This is an alternativve display off the tree vie ew but with value-added v information in the tiles. The T purpose of the Tile View V is to allo ow users to review r the re esults visuallly and judge their relevan nce based on n different crriteria with la arger tiles denoting the most m relevantt documents.. The resu ults of the evaluation off the Tile View show ovver half the evaluators (59%) agree ed or strong gly agreed th hat the Tile View was useful u in reviiewing their results. Ove er two thirdss found the tiiles to be obvvious and ea asy to unders stand (68%) and the abillity to use diffferent criteria to control their sizing was found to t be useful (69%). This supports the e design objective for th his view to ea asily supportt the use of different d crite eria for judgin ng the releva ance of the results r documents. The ability to group files by folders also received strong sup pport with 75 5% of evalu uators agreeiing or strong gly agreeing that this was s useful. The e comments analysis indicated that useful u featurres were the ability to ch hange tile siz ze based on different critteria, the ability to group p files by fold der and the use u of color to distinguish h file types. 5) Cloud d View The Cloud View (Figu ure 7) is adap pted from the e Tag Cloudss popular on n social netwo orking sites such as Fliccker. A Tag Cloud C is a we eighted list which w contain ns the most popular tags s used on that site and th he relative po opularity of each e tag is in ndicated by changing c its font size. It is thus easy to see the most popular tags. The Cloud Vie ew creates a Word Clo oud based on o the (indexable) conte ent of the ressult files. The e file contentts are examiined and sto op words and d nonindexxable terms are removed d. The words are then stemmed s an nd a simple term count of the documents conte ents. The top p 300 terms are a then disp played in a Word W Cloud as they reprresent the most m common n indexable terms. t Only filess selected in n the Resultts List (in th he left hand window) ha ave their contents includ ded in the Word W Cloud. If the selectiion of files is s changed, th he Word Clo oud is dynam mically refresshed with infformation ba ased on the new n selectio on of files. When W the use er clicks on a word in the e Word Cloud d a popup menu m appears offering the e choice to expand e (OR)), restrict (AN ND) or exclu ude (NOT) th he word from m the cur-rent query or to create a new search (NEW) usin ng the seleccted word (Figure 7).
Figurre 7. Cloude View The purpose of the Cloud C View iss to provide users u with the e most comm mon words (3 300 in this instance) fou und in the selected s filess in the result lists therreby providin ng an idea of o the conte ents of the re esult files (i.e e. basically a concordanc ce) and information on po otential word ds that can be b used in the query refin nement proce ess. The evaluation resu ults for the Cloud View w showed th hat nearly ttwo thirds of o the evalu uators found the Cloud View useful in reformulating their query q (63%) and easy to t use (61% %). However, the distributtion profile fo or Question 37 (usefulne ess of Cloud d View) is diffferent with a bi-polar disstribution, with a peak for Disagree and a Agree. This T implies that the evalu uators were split into two o groups, a conclusion c sttrongly supported by a re eview of the comments. Those T evalu uators who scored the usefulness of the Clou ud View very low (Stro ongly disagrree or IJEE EI Vol. 1, No o. 1, March 2013 2 : 27 – 42 4
IJEEI
ISSN: 2089-3272
39
Disagree) reported a lot of confusion as to the contents of the Cloud. In other words, they did not find the view useful because they did not understand what it does. Those who did rated it highly. This implies that some users had not seen this type of visualization before nor understood its potential [11]. 4.3. Web Visualization/Visualization Tool/Visualization in WWW Web visualization tools have been used to help users maintain a "big picture" of the retrieval results from search engines, web sites, a subset of the web, or even the entire web. The most well known example of using the tree-metaphor for web browsing is the hyperbolic tree developed by Xerox PARC. These visualization systems, machine learning techniques are often used to determine how web pages should be placed in the 2-D or 3-D space [4]. There is a study show how the existing tools to browse the WWW adopt visualization to satisfy seeker needs. It has been limited to some of the most well known tools such as Kartoo, Grokker, Web Theme [14], Aduna AutoFocus. To achieve this purpose the following research activities have been performed: 1. Identification of the main functionalities provided by these tools. 2. Analysis both of the correlation among these functionalities and of the problems in the information search [7]. Now, How Typical Visualization Tool Works? 1. Visualization tool takes set of key words from user and gives to search engine. 2. Search engine gives results to visualization tool as query per document. 3. In each Query, frequent words, no of occurrences of each frequent word, URL is there. 4. Creates concepts by taking some combinations of frequent words. 5. Do text clustering by using concepts. 6. Displays whole documents by using some visualization technique [13]. The results of these activities are summarized in Table 1 and Table 2. Table 1 is the result of the first activity. It illustrates the association between the tools (columns) and some of their functionalities (rows). It have identified some heterogeneous functionalities: graphical visualization functionalities (Hierarchical Visualization, Clustering Visualization, Map Based Visualization), graphical interaction functionalities (Visualization Manipulation, Graphical Selection) and those functionalities that are a combination of them (Highlighting, Colored Query Result, Filter Result Representation, co-occurring term interaction/visualization). In the following, a description for each of them is provided: Hierarchical Visualization: the visualization represents its content according to different levels of granularity. This allows browsing the information at different levels of detail (as Grokker). Clustering Visualization: the content is visualized (grouped) according to some similarity criteria. The groups can be obtained either by applying a clustering algorithm (galaxy view) or according to properties specified by the user (cluster map). Map Based Visualization: it imitates the geographical map appearance; the content is organized according to thematic terms or co-occurrence criteria, which are represented as peaks in the map (i.e. Kartoo represents the isograms and the name of the mountains respectively as concentric isolines and thematic terms on the top of them). Visualization Manipulation: the interaction between user and the graphical representation allows to re-organize the elements displayed, to move them and to add new ones (i.e. Grokker and Kartoo allow to add a new web site to the search and to insert it in the displayed graph according to user needs). Graphical Selection: the selection of a single (Grokker, Aduna AutoFocus, Kartoo) or many elements at a time allows the user to select different information source such as URI, PDF or DOC document in Grokker, Aduna Autofocus, Kartoo or data as in Web Theme. Highlighting: whenever an element of the visualization is selected, all the sources related to such element are highlighted too. Aduna AutoFocus and Kartoo allow highlighting the related co-occurring terms, whereas Grokker permits the highlighting both of the related co-occurring terms and of the related elements in the visualization. Colored Query Result: Web Theme allows to query the visualized data set and to set a particular color to each result set. This facilitates the comparison among different queries (results).
Visualization for Information Retrieval based on Fast Search Technology (Mamoon H. Mamoon)
ISSN: 2089-3272
40
Filter Results Representation: some filters can be applied to the contents shown in the visualization. For instance, Grokker allows filtering on the rank, on the domain and on the source, whereas Kartoo allows filtering on the co-occurring terms. Co-Occurring Terms Visualization: As users tend to formulate their queries using common words, a statistical thesaurus expands these queries with other highly frequent terms that should help the user in discriminating relevant documents. Table 1. Functionalities Provided by Some Existing Tolls to Browse the WWW
Interactio n and Visualizat ion
r a p hi c al In te r a ct io
Graphic al visualiz ation
Grokker Hierarchical Visualization Clustering Visualization
Aduna AutoFocus
√ √
Kartoo
√
√
Map Based Visualization Visualization Manipulation Graphical Selection Highlighting Colored Query Result Filter Results Representation Co-Occurring Terms Interaction/Visualization
Web Theme
√ √ √
√ √
√
√
√ √
√ √
√
√
√
√
√
Table 2. Tools Functionalities and How they Satisfy Seeker Needs
Graphical Interaction
Graphical visualization
database
vocabulary
Hierarchical Visualization Clustering Visualization Map Based Visualization Visualization Manipulation
Query formulation/refine ment √
√
√
√
√
√
√
√
√
√
Graphical Selection
Interaction and Visualization
Query coordination
√
Highlighting Colored Query Result Filter Results Representation Co-Occurring Terms Interaction/Visualiza tion
Information overload
√ √
√ √ √
√
√
Table 2 is the result of the activities to identify the contribution of the functionalities to solve problems related to seeker needs (information overload, query formulation, vocabulary, and database selection). It is possible to argue that: Graphical visualization functionalities: provide different results. They give a structured organization of information offering the user an overview of the available information relieving the information overload problem. They support the query formulation/ refinement: a correct and rapid understanding of search results is the prerequisite to have a successfully query refinement. Graphical visualization functionalities provide useful hints to solve the vocabulary problem by map based and clustering visualizations. They show co-occurring terms as cluster representative or in map representation permitting to learn which terms belong to the information space and how terms are related to each other.
IJEEI Vol. 1, No. 1, March 2013 : 27 – 42
IJEEI
ISSN: 2089-3272
41
Graphical interaction facilitates the information overload and query formulation /refinement problems: visualization manipulation supports in the analysis of results by modifying the layout, whereas graphical selection provides a visual and intuitive way to select results user is interested to. Finally, the functionalities based on the integration between interaction and visualization techniques support in the entire problem mentioned about. In particular, functionalities as Colored Query Result allow comparing the results of different queries supporting in the queries coordination problem. Whenever the information about which search engines have found a result is maintained, such functionality can be exploited to compare the results coming from different search engines supporting the solution of database problem. [7] 5. Conclusion and Future Work Despite the success of web as a preferred or defacto source of information, the retrieval of information from the web is still an unsolved problem with many different applications probably undiscovered. Specifically, the operative challenges motivating researchers in web IR include problems relating either to data quality or user satisfaction. The problems facing successful web information retrieval are a combination of challenges that stem from traditional information retrieval and challenges characterized by the nature of the World Wide Web. The ultimate challenge of web IR research is to provide improved systems that retrieve the most relevant information available on the web to better satisfy a user's information need. In researcher's journey to overcome most of the previous problems, they accept data mining, annotation, semantic web and visualizing the retrieval results as a helpful techniques utilize in facing web information retrieval process’ problems. Some of these problems can’t be solved but do the effort to adapt with them. These are abundance, dynamic, and heterogeneity because they are a web information’ characteristic. The most challenges when interacting with the web are: (1) Attempt to determine not only what the user is looking for, but also the task they are trying to accomplish and method by which they would prefer to accomplish. (2) Creating new knowledge out of the information available on the web. These described as challenges that are difficult needs a lot of skill and effort to do. Of course, there is always the new development, and it will be exciting to see what that future brings to user's search, like nature language queries; Users could express their queries in natural language, not just as keywords. This requires deeper syntactic and semantic analysis of the queries and the documents. Allowing the user to orally describe the information need into a microphone is a more natural way to interact with a search engine. Intelligent and adaptive web services; problems which can be tackled by these agents include: finding and filtering information, customizing information, and automating completion of simple tasks or perform some other service without (the user's) immediate presence and on some regular schedule, and adaptive web site automatically improves their organization and presentation based on user access data. Also Multimedia Queries, Knowledge Retrieval, Using and building Arabic language in IR system.
References [1] Diana Inkpen. Information Retrieval on the Internet. 2008. [2] Omar Alonso, Ricardo Baeza-Yates. Model for visualizing large answer in WWW retrieval. [3] Hazam M El-Bakry, Nikos Mastorakis. Fast Information Retrieval from Web Pages. Proc. of the 7th WSEAS Int. Conf. On Computational Intelligence, Man-Machine Systems and Cybernetics. 2008; 229. [4] Mps Bhatia, Akshi Kumar Khalid. Information retrieval and machine learning: supporting technologies for web mining research and practice. Webbology. 2008; 5(2). [5] Mei Kobyashi, Koichi Takeda. Information retrieval on the web. draft paper LINK. 2000. [6] Mps Bhatia, akshi Kumar Khalid. A primer on the web information retrieval paradigm. Journal of theoretical and applied information technology. 657-662. [7] Riccardo Albertoni, Alessio Bertone, Monica Martino. semantic web and information visualization. http://citeseerx.ist.psu.edu/viewdoc/download?doi=10.1.1.61.6774&rep=rep1&type=pdf , 26/2/2013 [8] A Spoerri. How Visual Query Tools Can Support Users Searching the Internet. Proceedings of Eighth International Conference on Information Visualization IEEE. 2004: 329-334.
Visualization for Information Retrieval based on Fast Search Technology (Mamoon H. Mamoon)
42
ISSN: 2089-3272
[9] Gary Marchionini. User interface for information retrieval on the WWW. INFORUM2005: 11th conference on professional information resources, prague. 2005. [10] http://en.wikipedia.org/wiki/Search_engine, last visit: 5/3/2013 [11] Schubert Foo, Douglas Hendry. Desktop Search Engine Visualization and Evaluation", D.H.-L. Goh et al. (Eds.): ICADL. Springer-Verlag Berlin Heidelberg. 2007; LNCS 4822: 372–382. [12] Marti Hearst. Search user interfaces. published by Cambridge university press. 2009. [13] Kotaiah Choudary Ravipati. Visualization of Web Search Results in 3D. seminar report [14] http://en.wikipedia.org/wiki/Visualization_%28computer_graphics%29, last visit: 8/3/2013 [15] AG Sutclife, M Ennis, J Hu. Evaluating the effectiveness of visual user interfaces for information retrieval. Int. J. Human-Computer Studies. 2000; 53: 741-763.
IJEEI Vol. 1, No. 1, March 2013 : 27 – 42