widely studied and utilized for evaluating the results of computer architecture ... view visualization for our computer architecture simulation and exploration.
Visualization of Computer Architecture Simulation Data for System-level Design Space Exploration Toktam Taghavi, Mark Thompson, Andy D. Pimentel Computer Systems Architecture group Informatics Institute, University of Amsterdam, The Netherlands {T.TaghaviRazaviZadeh, M.Thompson, A.D.Pimentel}@uva.nl
Abstract. System-level computer architecture simulations create large volumes of simulation data to explore alternative architectural solutions. Interpreting and drawing conclusions from this amount of simulation results can be extremely cumbersome. In other domains that also struggle with interpreting large volumes of data, such as scientific computing, data visualization is an invaluable tool. Such visualization is often domain specific and has not become widely studied and utilized for evaluating the results of computer architecture simulations. In this paper, we describe an interactive visual tool for exploring and analyzing alternative architectural solutions at multiple levels of abstraction. As a proof of concept, we have used this tool to create a coordinated, multipleview visualization for our computer architecture simulation and exploration environment, called Sesame, which aims at system-level performance analysis and design space exploration of multi-core embedded systems. Our results show that our multivariate visualization support can help designers to more easily understand the reasons behind the differences in performance of different design choices, and thus gain more insight in the performance landscape of the design space. Keywords: Computer architecture simulation, design space exploration, exploratory visualization, linked views, multiple views, coordination.
1 Introduction Rapid advances in chip technology and the ever-increasing demands of computer applications have resulted in unprecedented complexity in embedded computer system design, often reflected by the different forms of concurrency exploited in the system architectures. This trend shows no signs of abating and is forcing designers to start modeling and simulating architectural components and their interactions at the very early design stages. Design Space Exploration (DSE), in which alternative architectural solutions are assessed, plays a crucial role in this system-level design. It is imperative to have good exploration methods, techniques and tools in the early design stages, where the design space is at its largest and where a wrong design decision can make the difference between the success or failure of the final product. System-level simulation frameworks that aim for early design space exploration
create large volumes of simulation data in exploring alternative architectural solutions. Interpreting and drawing conclusions from these copious simulation results can be extremely cumbersome. In other domains that also struggle with interpreting large volumes of data, such as scientific computing, data visualization has become an invaluable tool to facilitate the data analysis. Such visualization is often domain specific and has not become widely used in evaluating the results of computer architecture simulations. Especially in the domain of system-level DSE of embedded systems, surprisingly little research has been undertaken in the interactive visualization to support and guide the process of DSE In this paper, we describe an interactive visual tool, based on the Improvise [14, 15] framework, for exploring and analyzing alternative architectural solutions at multiple levels of abstraction. We have used this tool to create a coordinated, multiple-view visualization for our computer architecture simulation and exploration environment, called Sesame, which aims at system-level performance analysis and DSE of multi-core embedded systems. However, our visualization tool is not limited to Sesame and may be used for other DSE environments. Multiple views enable users to look at different aspects of their data using different types of visualizations. The various representations enable users to interpret information from different perspectives, thus gaining additional insight into the underlying information. Coordination between the views keeps them synchronized during interaction, which enables users to relate information between the views. Such visualization support can significantly help designers to understand the reasons behind the differences in performance of different designs, and thus gain more insight in the performance landscape of the design space. The remainder of this paper is organized as follows. Section 2 describes related work. In Section 3, we provide a short introduction on information visualization, and briefly describe the Improvise framework, which has been used to construct our visualization tool. Section 4 gives an outline of the Sesame simulation environment for which we have developed the multiple-view visualization tool. In Section 5, we elaborate on the various multivariate views that are provided by our visualization tool, followed by an evaluation in Section 6 illustrating how these different views improve the analysis of DSE data produced by Sesame. Finally, Section 7 concludes the paper.
2 Related Work The use of multiple views in information visualization is very common and useful. This technique has been applied in a variety of domains. Examples are: Navigational View Builder [1] for web site visualization, FilmFinder [2] and Cinegraph [3] for exploring and analyzing film databases, SeeDiff [4] for analyzing changes in source code files, and visualizing and exploring census data [7, 8]. However, in the field of computer architecture simulations, and especially those aimed at system-level DSE, little research has been undertaken on (interactive) information visualization. Most of the visualization work in this area focuses on educational purposes (e.g., [11, 12, 13]), or only provides some basic support for the visualization of simulation results in the form of 2D (and sometimes 3D) graphs.
The work of [16,17] provides advanced and generic visualization support, but tries to do so for a wide range of computer system related information which may not necessarily be applicable to computer architecture simulations and in particular to DSE, with its own domain-specific requirements. Vista [18] aims at visualization support for computer architecture simulations, but it does not target system-level simulations, which may have a serious impact on the scalability requirements of the visualization, nor does it address the needs for visualization from the perspective of DSE. The ARL Trade Space Visualizer [19] is an engineering decision making-tool for complex engineering systems to explore a multi-dimensional trade-off space in a visually intuitive manner. However it is not applicable to computer architecture simulations (e.g. only supporting numerical data types).
3 Information Visualization and Improvise Visualization is all about representing information in a visual form to help a viewer to efficiently and effectively explore, analyze and explain complex information. A key challenge in visualization is designing suitable visual metaphors that enable users to better understand the underlying information and to convey the information that the user is looking for. Information Visualization (InfoVis) [5] focuses on techniques of visualization that deal with abstract data sets, that is, data without “natural” physical or geometric representation such as hierarchical or textual information. Therefore, the user has no predetermined mental model about it. Information visualization systems have two main components: representation and interaction. The representation component involves the way that data is mapped to the visual form. Subsequently, the interaction component allows a user to directly manipulate the representation and to explore the data set to discover additional insights. Examples of interaction techniques are: select, filter, zoom, rotate and scroll. Visual data exploration usually follows a three step process: 1) overview 2) zoom and filter, and 3) details on demand (which has been called the Information Seeking Mantra [6]). First, the user needs to get an overview of the data. The overview represents the whole data entity and provides a general context for understanding the data set. In the overview, the user identifies an interesting, significant or unusual subset of data and focuses on that. Evidently, the actual analysis of the selected subset that follows depends entirely on the nature of this data subset. Improvise [14, 15] is an exploratory information visualization environment which we have used to visualize the data generated by our Sesame simulation and DSE framework. Improvise is an end-user application for building visualizations of structured information such as tabular data. It enables users to load data, create views, specify visual abstractions (i.e., how specific data attributes are mapped into graphical attributes in views), and set up coordination between the views. Views can be coordinated in a variety of ways such that interacting with one view causes visual and meaningful effects in appearance or behaviour of other views. To this end, Improvise enables users to define complex interactive dependencies between the views. These dependencies keep views synchronized during interaction which enable users to relate information between the views. Furthermore, it is scalable in the amount of data to be
visualized, number of views and number of coordinates. Improvise is open source software written in Java. Moreover, its visualizations are saved and loaded as regular XML documents in a platform-independent format. Therefore the results can be shared and disseminated easily.
4 Sesame Sesame is a modeling and simulation framework geared towards efficient performance evaluation of embedded Multi-Processor System-on-Chip (MPSoC) platforms in the multi-media domain [9, 10]. Models in Sesame are defined at a high level of abstraction and capture only the most important characteristics of the components in the system. By omitting detailed component properties, the simulation of an entire system can be much faster than with traditional simulation approaches. This allows for the (performance) assessment of a large number of design options. A key element in Sesame is the recognition of separate application models and architecture models. The application model is an actual application program expressed as a process network consisting of communicating concurrent tasks. The architecture model represents the hardware components in the system, such as processors, memories and interconnection networks, and captures their performance constraints. The application and architecture models are subsequently co-simulated using a trace-driven mechanism – to assess the performance of a certain mapping of a (concurrent) application onto the underlying (parallel) architecture. To this end, the application model generates event traces which drive the architecture model. These events are an abstract workload representation that only capture the most important behavioral actions of an application, such as reading and writing to/from other processes or execution of a significant unit of computation. The architecture model simulates the execution of every event and associates timing latencies with them where applicable. A global system clock monitors the progress through time of the system model as a whole. As mentioned, there is an explicit mapping of application tasks (i.e. processes) onto architecture components (typically processors). In case multiple tasks are mapped onto the same processor, then a scheduler decides on the order in which the processor model component processes the events from each of the tasks. The mapping as well as the scheduling policy, which are important factors in the overall system performance, are specified as parameters of the simulation. During execution of the system model, the simulation runtime system collects various performance statistics which are useful for evaluation of the system. The most important statistic is perhaps the "Elapsed Time" that describes the total execution time of the system in terms of the number of simulated processor cycles. However, more detailed statistics on a per-component basis are also available, such as for example the utilization of each component. Utilization is described as a percentage of the Elapsed Time that a component was busy processing events or interacting with other components. Clearly, such statistics could, e.g., reveal possible bottlenecks in the system. Similarly, many other statistics can help the designer to evaluate other performance properties of the system.
Sesame models are highly parameterized, so that a single model can be used for evaluating a large number of different configurations of a system, which are called design instances. One important parameter is the mapping specification that we mentioned before. Other parameters may describe properties of the architecture: e.g. the number and type of processors, scheduling strategies, network types, memory sizes, or processing/communication speed of different components. The combination of all possible parameters forms the design space that needs to be explored. Combinatorial explosion of the parameters can easily make the design space very large. Therefore, iterative simulation of each instance will result in a huge amount of statistical data that need to be evaluated by the designer.
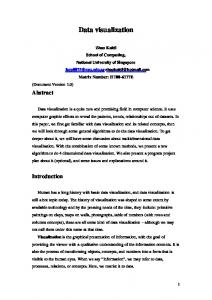
5 Visualization of Computer Architecture Simulation Data In this section we explain how the large collection of statistical data generated by Sesame will be transformed into a visual form. Note that these transformation techniques are not limited to Sesame and may be used for other DSE environments. Multiple Coordinated Views is a specific exploratory visualization technique that enables users to explore their data [5]. Displaying the data in multiple ways enables users to understand the information through different perspectives, gaining additional insight and better understanding of the underlying information, overcoming possible misinterpretation and finding interdependencies between data. We have developed the following views that show the simulation data from different perspectives and which are coordinated with each other: • Overview+Detail views: Selecting an item in the “overview” navigates the “detail view” to the corresponding details. Items are represented visually smaller in the overview. This provides context and allows direct access to details. The detail view is a zoomed-in-view of the overview. In these views, all design instances are shown in one scatter plot. They are sorted by elapsed time. So the best instances are on the left side. • Table view: some attributes of all design instances are shown in a tabular view and can be sorted in either ascending or descending order. • Latency view: the read and/or write communication latencies of selected instances in the overview are shown. • Matrix view: a multivariate view to compare selected instances in terms of a large variety of characteristics, such as task mapping, number and type of processors, scheduling policy, etc, • Task view: shows the application task mapping and task execution times of an instance selected from the matrix view. • Method view: shows a break-down of the time spent in each method call (read, write, execution, etc.) for each processor component in the architecture model of an instance selected from the matrix view. In Fig. 1, an example screenshot of our visualization is shown. A demo and color versions of the pictures are available on the homepage of the primary author. The remainder of this section will discuss each of the above views in more detail. For more details about the experiment that generated the data in this figure, see section 6.
Fig.1. Screenshot of the coordinated multiple-view visualization.
5.1 Overview+Detail Views Usually, the amount of data to be displayed is too large to fit on the screen completely. It is also useful to be able to zoom in on certain parts of the data. In such cases, one wants to focus on certain data, without losing track of the position in the whole data set. Therefore, two separated views are used. One is the overview that provides a global map of all data and the other is the detail view that provides a zoomed-in-view for detailed information about a small portion of the data. Users can select items from the overview to navigate to corresponding detailed information in the detail view and vice versa, navigating in the detail view indicates the corresponding selection in the overview. Overview and detail diagrams (Fig. 1-A and 1-B) are scatter plots in which the xaxis shows the design instance number and the y-axis shows the elapsed time. Instances are sorted by elapsed time. As a result, the best instances (instances with minimum elapsed time) are on the left side of the diagram. For each instance, there is a nested bar plot that shows the load balance for each processor in the design instance. It uses one bar per processor in which the color of the bar shows the processor type and the scheduling policy of that processor. This is called color coding in literature and in this case each color indicates one property and the color shade shows another property. For example, in our diagrams we use color to identify the processor type and the color shade to identify the scheduling type. If a user selects one or more instances in the overview diagram, the corresponding instances in the detail view will be highlighted, and vice versa, selecting some instances in the detail view highlights corresponding instances in the overview. By selecting some instances in either overview or detail view, the matrix and latency views will also be filled with those instances’ information. The overview and detail diagrams are mainly used to recognize general performance trends, such as finding the best and worst design instances, and retrieving some high-level information about them (e.g., about the number of used processors, processor types, scheduling policy, and processor utilization). 5.2 Table View In the table view (Fig. 1-C), all instances are displayed in rows with columns that contain various attributes of the instances, like instance number, number of processors, type of processors, mapping of application tasks onto processors, and elapsed time. The user can sort the table in both ascending and descending order on any of its attributes. In addition, the table view supports the sorting on multiple columns, allowing a user to sort design points by multiple attribute values. In multiple sort, a number will be written in the column header that indicates the order of that column in the multiple sort. Selecting one or more rows in the table view will highlight the corresponding instances in the overview and detail views. Also, the matrix and latency views will be loaded with detailed information about those instances. The table view is useful for finding and selecting some specific instances. For example, if a user wants to select design instances that contain two MicroBlaze
processors and one PowerPC processor (indicated by the string “PC MB MB” in Sesame) and sort them by elapsed time, then the table is first sorted by architecture string and then by elapsed time in descending order. (Fig. 1-C) 5.3 Latency View The latency view (Fig. 1-D) is another scatter plot in which the x-axis represents the selected instances from the overview diagram and the y-axis shows the application tasks. For any instance selected in the overview, the latency view shows the amount of time that each task is waiting for read and/or write communications. Here, again the color coding has been utilized to represent the latency: yellow to red for read latency and green to blue for write latency. For each instance and task in the latency view, two rectangles are drawn filled with these colors representing the read and write latency. Moreover, the user can select to just see read or write latencies, or both of them. 5.4 Matrix View The matrix view (Fig. 1-E) shows more detailed information about selected instances and can be used to compare the instances. The columns of the matrix represent the application tasks while the rows are the selected instances. The instances in the matrix view are sorted by elapsed time, therefore the instances with lower elapsed times are on the top. Each cell is filled by a color matching the type of the processor and the scheduling policy. Needless to say, the color coding is the same as in the overview diagram. The small rectangles drawn at the bottom right of each cell are used to recognize the tasks which have been executed on the same processor. These tasks have the same color in this small rectangle. In addition, the number written at the upper left of a cell shows the percentage of time that the corresponding processor was busy executing the task. The value in the bottom left of the square denotes the execution time of this task relative to execution of the same task in all the other instances in the experiment. The value “min” means that no other instance executes the task faster, “max” means that no other instance executes the task slower. Note that the performance of an instance for a particular task could also be in between “min” and “max”: we then provide a normalized number between 0 and 1 with respect to the “min” and “max” values. If the user selects one instance in the matrix view, more details about the task mapping and methods will be shown in the task and method view sections. Furthermore, the selected instance will be highlighted in this diagram and also in the overview and latency diagrams. 5.5 Task View This view (Fig.1-F) shows the application task mapping of an instance selected from the matrix view. For each processor of the selected instance, a stacked bar-chart is
drawn. Each stack shows the tasks executed on the processor using different colors. The stack height shows the percentage of time that the processor was executing the task. The idle time percentage is shown at the top of the stacked bar with light yellow. The stacks are sorted by their heights (the task with maximum time usage percentage is at the bottom of the chart). 5.6 Method View This view (Fig.1-G) shows a break-down of method call statistics of processor components in the architecture model of a selected design instance. Basically, this shows the intensity of reading data, writing data, and executing of the different processors in the selected design instance.
6 Evaluation By default, Sesame outputs various simulation statistics in human-readable text files. For a DSE experiment consisting of many simulations, the designer would either have to go through the files manually, or write an evaluation program to extract particular relevant information from file and represent it in a useful way (e.g. average numbers, distributions or graphics). The former is time-consuming, error prone, and most importantly, overwhelms the designer with detailed statistics. The latter is time consuming as evaluation programs may not be easily reusable between experiments. Moreover, the designer may not know what exactly needs to be evaluated before he has performed an initial survey of the results. In this section, we will show a number of example observations using our visualization tool that could not be made so easily before. The experiment explores differently configured instances of a multi-processor system-on-chip (MPSoC) running a parallelized video encoder application. Instances consist of 1, 2 or 3 processors of one of two types: MicroBlaze (MB) or PowerPC (PC). Furthermore, we consider every possible mapping of tasks onto processors. Using the overview diagram, we can find that the best instances (Fig.2 on the left) are mostly colored red (MB), while in the worst instances most of the processors are blue (PC). Overall, we can conclude that better instances contain more MB processors. This result was to be expected, since we knew beforehand that for our application the MB processor is faster for almost all application tasks. So a very basic design question is whether we should include a PowerPC (PC) in the design at all. When the designer zooms in on the left hand side of the detailed view, it becomes clear that the optimal instances actually have one PC. However, from this view it is also clear that the performance difference with the best 3-MB system is quite small. Now the designer can make a trade-off between system performance and other design criteria. For example, the cost of IP licenses for a heterogeneous system may not be worth the small performance gain. Similarly, system flexibility, die-size or reliability may influence the final design decision.
Fig.2. Overview and detail views showing best design instances.
Now, let us look at the influence of the task mappings on performance. Using the easy-to-use selection mechanism from the visualization tool (table view), we selected all instances that use the same mapping as the optimal instance (instance 297), but have a different underlying architecture. In Fig.3-A, we can see that these instances are all grouped relatively close to the optimum. Further investigation of other mappings close to the optimum, shows a similar result. However, when we select some of the worst mappings, then we see that identical mappings are more evenly distributed among the 36-100th percentile (Fig.3-B). From this, we can conclude that a good mapping is less dependent on the underlying architecture than a bad one. Using the visualization tool, this trend could be discovered in mere minutes, but without it, it could have gone unnoticed to the designer or he would have found out much later.
Fig. 3-A Best mapping subset.
Fig. 3-B Worst mapping subset.
Conversely, we can also look at the different mappings for a certain architecture (data not shown here). From this, we learn that a 2 or 3 processor instance with only MBs always performs within the 0-48th percentile, implying that even the worst mapping is still better than 52% of all instances. Further, multi-processor instances with a heterogeneous architecture (using both MB and PC) span the entire performance range (from poor to good, and everything in between). The 2 and 3 processor instances with only PowerPCs yield a performance that always falls in the 14-100th percentile, which means that even the best mapping for those architectures is worse
than 14% of all instances. This corroborates our previous findings and, moreover, is interesting for the designer if he is looking for a system that can flexibly deal with different task mappings: an all-MB system will give reasonable (but not optimal) performance. The visualization can also be used to understand some exception conditions. In Fig. 4 we show various instances where task 2 is mapped onto a separate processor. From the latency view we can easily see that in these mappings task 2 has a higher write latency compared to other mappings. This is because task 2 never reads but only generates data and subsequent task 3 cannot read the data fast enough. Therefore, the rate of data production is faster than consumption and the write latency is increased.
Fig.4. Write latencies for a selection of instances.
Fig. 1-D shows a selection of instances with increasingly high read latencies for tasks 3, 4, 5 and 6. Furthermore, from the min/max annotation in the matrix view (Fig. 1-E) we see that for the worst instances most tasks execute on a processor that is not the optimal processor type for that task. These observations are indications of bottlenecks in the system, but the detailed explanation is outside the scope of this paper. Each of the above observations could be done much easier and quicker using the visualization than with our previous analysis techniques. Moreover, the visualization invites the designer to look at data that would otherwise have been ignored.
7 Conclusion System-level (embedded) computer architecture simulations create large volumes of simulation data to explore alternative design solutions. Interpreting and drawing conclusions from this amount of simulation results can be extremely hard and time consuming. So far, little research has been undertaken in the application of techniques from the field of information visualization to facilitate such analysis. In this paper, we presented a multiple-coordinated visualization tool and we use it to explore simulation results from our Sesame simulation and design space exploration framework. The overall premise for this visualization tool is that users understand their data better if they interact with the presented information and view it through different representations. Our visualization tool therefore allows a designer to 1) get a quick and clear overview of the performance of a large number of evaluated design points, 2) select a set design instances for further investigation, 3) compare the selected design points in terms of different characteristics and metrics using multivariate
visualization, 4) look at the simulation results from different levels of abstraction, and 5) find relationships between design parameters and their effects on performance. In the future, we will perform a case study with more complicated application and architecture models. This way, we can further test and improve the capabilities of the visualization for even more intricate exploration case studies.
References 1. Mukherjea, S., Foley, J., Hudson, S.: Visualizing Complex Hypermedia Networks through Multiple Hierarchical Views. In: ACM SIGCHI’95, pp. 331--337. ACM Press, (1995) 2. Ahlberg, C., Shneiderman, B.: Visual Information Seeking: Tight Coupling of Dynamic Query Filters with Starfield Displays. In: ACM SIGCHI’94, pp. 313 -- 317. ACM Press, (1994) 3. Weaver, C.: InfoVis 2007 Contest Entry: Cinegraph. In: IEEE Symposium on Information Visualization, (2007) 4. Ball, T., Eick, S.: Software visualization in the large. In: IEEE Computer, vol. 29, no. 4, pp. 33--43, (1996) 5. Roberts, J.C.: Multiple-View and Multiform Visualization. In: Visual Data Exploration and Analysis VII, vol. 3960, pp. 176--185, (2000) 6. Shneiderman, B.: The eyes have it: A task by data type taxonomy for information visualizations. In: IEEE Symposium on Visual Languages, pp. 336--343, (1996) 7. North, C., Shneiderman, B.: Snap-Together Visualization: A User Interface for Coordinating Visualizations via Relational Schemata. In Adv. Visual Interfaces, pp. 128--135. ACM, (2000) 8. Weaver, C.: Improvisational Geovisualization of the 2000 United States Census. In: AutoCarto, (2006) 9. Erbas, C., Pimentel, A.D., Thompson, M., Polstra, S.: A Framework for System-level Modeling and Simulation of Embedded Systems Architectures. In: EURASIP Journal on Embedded System, (2007), available online: DOI 10.1155/2007/82123 10. Pimentel, A.D., Erbas, C., and Polstra, S.: A Systematic Approach to Exploring Embedded System Architectures at Multiple Abstraction Levels. In: IEEE Transactions on Computers, vol. 55, no. 2, pp. 99--112, (2006) 11. Marwedel, P., Sirocic, B.: Multimedia components for the visualization of dynamic behavior in computer architectures. In: Workshop of Computer Architecture Education, (2003) 12. Yehezkel, C., Yurcik, W., Pearson, M., Armstrong, D.: Three simulator tools for teaching computer architecture: Easycpu, little man computer, and rtlsim. Journal on Educational Resources in Computing (JERIC), vol. 1, no. 4, pp. 60--80, (2001) 13. Ibbett, R.N.: Computer architecture visualisation techniques. J. Microprocessors and Microsystems, vol. 23, no. 5, pp. 291--300, (1999) 14. Weaver, C.: Building Highly-Coordinated Visualizations In Improvise. In: IEEE Symposium on Information Visualization, pp. 159--166, (2004) 15. Weaver, C.E.: Improvise: A User Interface for Interactive Construction of HighlyCoordinated Visualizations, PhD thesis, University of Wisconsin—Madison, (2006) 16. Bosch, R., et al.: Rivet: A flexible environment for computer systems visualization. SIGGRAPH Computer Graphics, vol. 34, no. 1, pp. 68--73, (2000) 17. Bosch, R.P.: Using Visualization to Understand the Behavior of Computer Systems. PhD thesis, Stanford University, (2001) 18. Mihalik, A.: Vista: A visualization tool for computer architects. Master’s thesis, Massachusetts Institute of Technology, (2004) 19. Stump, G.M., Yukish, M., Simpson, N.: Design Space Visualization and Its Application to a Design by Shopping Paradigm, In: Design Engineering Technical Conferences (DETC), pp. DETC2003/DAC- 48785, (2003)