Journal of Computer Science & Computational Mathematics, Volume 6, Issue 2, June 2016
DOI: 10.20967/jcscm.2016.02.003
Visualization of Crime Data Using Self-organizing Map (SOM) and Improvement in SOM: A Review and Available Tools Noor Maizura Mohamad Noor*, Siti Haslini Ab Hamid School of Informatics and Applied Mathematics, Universiti Malaysia Terengganu (UMT) 21030 Kuala Terengganu, Terengganu, Malaysia * Corresponding author email:
[email protected]
Abstract: Recently, the major challenge faced by all intelligencegathering and law-enforcement organizations is to efficiently and accurately analyze the huge volumes of crime data. Self-organizing map (SOM) can be used to visualize crime data into more comprehensible presentation. Although visualization by using SOM has been done by many researchers, a literature review on the subject focuses on crime data has yet to be implemented. Thus, this study reviews researches on visualization of crime data using SOM and improvement in SOM (Fuzzy SOM or FSOM) together with their available software tools. Information and related works on visualization using SOM and FSOM were studied to fully understand the situation. The result of this study clearly shows that SOM and FSOM have been applied to visualize data in various fields of study. However, there is only limited use of them for visualization of crime data by the researchers. The popular software tool for visualization of crime data using SOM is Matlab, followed by Viscovery SOMine, R, GeoVISTA Studio and C/C++ compiler. Finally, this study concludes with a few suggestions for future researches on visualization of crime data. Keywords: Visualization, artificial neural network, self-organizing map, fuzzy self-organizing map.
1. Introduction Recently, the major challenge faced by all intelligencegathering and law-enforcement organizations is to efficiently and accurately analyze the huge volumes of crime data [1]. Analysis of crime can make a significant contribution to the delivery of an efficient and effective security authority service and how the security authority and their partners tackle crime. It also provides valuable information fundamental to internal management decisions and policy making. Data mining is a powerful tool that can help criminal investigators or data analysts to search large databases quickly and efficiently [2]. Data mining contains six common classes of tasks which include clustering, classification, outlier detection, prediction, regression and visualization [3]. Visualization technique is very important because it can represent crime data into more understandable presentation and can be used to support decision making processes. Although the visualization technique has the highest capability to analyze crime data [2], still there is lack of researches using this new technique. Because of this, current researchers are more focus on using visualization technique in their researches and studies including research related to visualization of crime data. Many software tools
have been developed to handle various visualization techniques. Artificial neural network (ANN) is a well-known technique used in computer science and related fields. ANN has been inspired by biological processes in the brain that typically recognized as non-linear distributive adaptive systems [4]. Application areas of ANN include the system identification and control, visualization, data mining, pattern recognition, medical diagnosis, sequence recognition, e-mail spam filtering and financial applications. Self-organizing map (SOM) is one of the most popular unsupervised neural network model to handle various problems in visualization, classification, clustering, and modeling [1]. SOM is an efficient and effective visualization technique for highdimensional data [5, 6], thus having a great visualization capability [7]. It can be used to visualize large highdimensional datasets by projecting data into a lower dimensional space [8, 9]. Since crime involves highdimensional of data, SOM is an alternative technique to visualize crime data. However, traditional SOM has limitation that requires improvement to enhance visualization capability on crime data. The aim of this study is not to present any new methods but trying to provide a review on visualization of crime data using SOM and improvement in SOM together with their available software tools. Therefore, the rest of the study is structured as follows. Section 2 provides an overview of visualization of crime data. Section 3 and 4 analyze researches on SOM and improvement in SOM together with their related works. Section 5 reviews the software tools available for visualization of crime data. Lastly, section 6 gives conclusion and future research directions.
2. Visualization of Crime Data Visualization of crime data is very important in order to identify the crime pattern and support decision making in crime prevention. Two main terms of visualization and crime data are explained as below. 2.1 Visualization Visualization techniques have the ability to convert information into graphical representations, without a
38 Visualization of Crime Data Using Self-organizing Map (SOM) and Improvement in SOM: A Review and Available Tools
significant loss, to assist the incorporation and reutilization of prior knowledge and develop the human ability for visual reasoning and pattern recognition [10]. Visualization refers to an easily understandable presentation of data and to methodology that can convert complicated data characteristics into clear patterns to allow users to view the complex relationships or patterns uncovered in the data mining process [3]. There are many visualization techniques used in previous researches and studies. For an example, Ratcliffe [11] compared several different ways of visualizing high volume crime data and discussed a few possibly unforeseen, implications of mapping techniques. Brunsdon, Corcoran and Higgs [12] focused on comparison of three visualization techniques (map animation, the isosurface and the comap) in visualizing time and space in crime patterns.
List of crime types that are identified as index crime are different for each country. For example, the Royal Malaysia Police (RMP) in Malaysia divides index crimes into two main categories. The first category is property crime includes those offences involving the loss of property during which there is no use of violence by the perpetrators [16]. In this category, there are six types of crimes which are stealing, stealing of truck/van, stealing of car, stealing of bike, snatch theft, and lastly housebreaking and theft. The second category is violent crime which generally includes crimes of violence that are sufficiently regular and significant in occurrences [16]. Violent crime consists of murder, rape, firearm gang robbery, gang robbery without firearm, firearm robbery, robbery without firearm and injuring others.
3. Self-organizing Map (SOM) 2.2 Crime Data Crime is an act that violates legal regulations; an act that is considered to be prohibited or illegal and is punishable by law; deviant actions or immoral and behavior as well as a serious offence [13]. Crime consists of three environmental factors, which are1) the targeted victim, 2) the offender, and 3) the opportunity to commit crime [13] as depicted in Figure 1. All these factors must occur simultaneously. For instance, if victim and offender exist but opportunity does not exist, so crime would not happen.
Figure 1. Environmental factor of crime
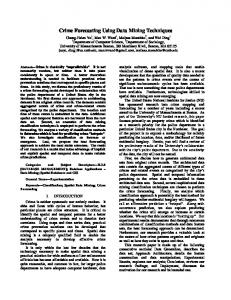
3.1 Overview of SOM SOM is a type of ANN and was introduced by Professor Teuvo Kohonen [17] in 1980s. SOM has been successfully applied in various fields such as vector quantization, pattern recognition, financial data analysis, full-text and image analysis, regression, and fault diagnosis [18]. SOM consists of a set of artificial neurons that represent the data structure. These neurons are connected with their neighbors according to topological connections [19]. Figure 2 displays a summary of SOM learning algorithm [10]. This figure shows that each of input data will be processed based on the pre-specified number of training epochs. During the SOM training, a distance measure between the input data and the codebook vectors is calculated to determine the winner neuron, i.e. best matching unit (BMU). When the BMU is found, the neuron weights located within the neighborhood region is updated [10].
In crime analysis, crime data is the most important type of data. Crime data is dynamic and can be reported days, weeks, months, even years after they occurred. One of the important crime data is crime incidences. There are two categories of crime incidences which are index crime and non-index crime [14, 15] as shown in Table 1. According to the definition of crime category in Table 1, index crime is more important compared to non-index crime. Therefore, this study focuses on the index crime to be discussed in detail. Table 1. Category of crime incidences [14, 15] Crime category
Definition
Index crime
Crimes that are usually reported and have sufficient significance to be considered as important as an indication towards the level of crime.
Non-index crime
Crimes that are not considered to be a measurement of crime stream. Figure 2. The SOM learning algorithm (Source:[10])
39
Noor Maizura Mohamad Noor, Siti Haslini Ab Hamid
SOM can be applied as a visualization tool [20, 21] because it converts the non-linear statistical relationships between high dimensional data into simple geometric relationships of its image points on a low-dimensional display. In SOM, there are two common visualization tools which are unified-distance matrix (U-matrix) and component planes [21]. In addition, the initial setting of parameters in SOM can affect the visualization results [7]. Some of the initial settings of parameters in SOM include items such as shape of the output neurons, map size, training algorithm, shape of the map, the decrease speed of neighborhood and learning rate. For instance, specification of map size in the SOM training process is very important to detect the deviation of the data [21]. SOM has many advantages [10, 20] such as ease of understanding, ability to deal with high-dimensional datasets, flexible number of parameters, ability to represent non-linear relationship, preserving the topology of the multidimensional space, evaluate its own quality, not assuming a priori knowledge of data distribution, and being intuitive for the user to calculate how good a map is and how strong the similarity between objects. 3.2 Related Works on SOM There are many researches and studies that used SOM as a visualization technique in various field of studies [7, 9, 2230]. However, this study focuses on researches in crime analysis using SOM as depicted in Table 2. For an example, Li and Juhola [9] applied SOM to mapping countries with different situations of crime. They also applied SOM to the fields of macroscopically exploring into multidimensional data of development of criminal phenomena [31]. In addition, Alruily et al. [32] proposed Crime Profiling System (CPS) to extract meaningful information (crime type, crime location and nationality) from an unannotated corpus to generate summarizations, to automatically construct dictionaries and to cluster Arabic crime texts. Moreover, Keyvanpour, et al. [33] proposed crime matching framework by using data mining technique to detect and investigate crime. According to Table 2, there is limited number of researches using SOM in crime analysis. However, not all the researches focus on visualization of crime data. For instance, Keyvanpour, et al. [33] applied SOM to cluster and classify crime data while Li and Juhola [9, 31] applied SOM with other techniques to cluster criminal phenomena.
4. Improvement in Self-organizing Map In recent years, several articles on improvement of SOM have appeared in conferences proceedings and journal publications. One of the limitations for the traditional SOM is failing to handle uncertainties [1]. To overcome this limitation, previous researchers [34] introduced fuzzy cmeans (FCM) model into fuzzy Kohonen clustering network (FKCN) to increase the weight updating strategy and learning rate. Although FKCN obtained excellent learning performance, it still could not process linguistic data. Then, Li, et al. [1] enhanced the existing model by following the structure of traditional SOM and also the idea
of FKCN to allow manipulation of fuzzy numbers as inputs, fuzzy weight updating, and fuzzy similarity measure in crime analysis. In order to realize such improvements, they addressed three issues which were selection of BMU, representation of fuzzy time series, and the weight updating process. Besides, there are also several researchers who applied fuzzy concept into SOM in other field of studies [4, 35, 36]. The combination of fuzzy into SOM is known as fuzzy self-organizing map or FSOM. Table 2. Related works on crime analysis using SOM Author
Year
Result
Li and Juhola [9, 31]
2014
SOM can be used as a new tool to map criminal phenomena through processing of multivariate and large amounts of crime data.
Alruily, et al. [32]
2014
Huge reduction in the quantity of data fed into the SOM is obtained, thus saving memory, data loading time and the execution time needed to perform the clustering. Computation of the SOM is also accelerated and quantization error is reduced.
Keyvanpour, et al. [33]
2011
The proposed framework exploited a systematic approach for using SOM and Multi-Layer Perceptron (MLP) neural networks to classify and cluster crime data.
4.1 Fuzzy Self-organizing Map (FSOM) FSOM is a modified and improvement technique in SOM. FSOM is a type of hybrid ANN that allows behavior to be described quantitatively and qualitatively using meaningful expression [4]. It was first developed by Petri Vourimaa from Finland [37]. FSOM maps a set of high dimensional input vectors into a 2-D grid using a modification of the FCM functional. A summary of FSOM learning procedures is illustrated in Figure 3. In FSOM, rules are used to replace the neurons of Kohonen's original model [37]. Each fuzzy rule covers certain area of the input space, defined by its fuzzy sets. The output singletons of the fuzzy rules are combined together by a weighted average, where the firing strengths of the fuzzy rules act as the weights. Therefore, the structure of the FSOM is very similar to the fuzzy logic controllers. In addition, the user can limit the number of the fuzzy rules, and thus also the accuracy of the FSOM [37]. There are some advantages of FSOM that have been mentioned in previous researches such as performing well over a range of real world system identification and control applications, markedly better than Kohonen’s Learning Vector Quantization (LVQ) and Nearest Neighbor Network in term of generalization performance [4], and the point that they can be used in a wide variety of application domains that can handle vast amounts of linguistic data [1].
40 Visualization of Crime Data Using Self-organizing Map (SOM) and Improvement in SOM: A Review and Available Tools
evaluate the accurate performance. Kurd and Kelly [4] presented the safety critical ANN (SCANN) based on FSOM model for high criticality roles in safety critical system.
Figure 3. The FSOM learning algorithm (Source:[36]) Figure 4. SOM and FSOM (Source:[38]) 4.2 Comparison between SOM and FSOM The comparisons between SOM and FSOM were elaborated by Nomura and Miyoshi [38]. FSOM performs fuzzy clustering of the input space based on competitive learning similar to SOM. However, there are two differences between SOM and FSOM in term of learning and competition of nodes as described in Table 3. In addition, Figure 4 shows the original SOM and FSOM. Both techniques have n input nodes and m output nodes. The output nodes are spatially placed on a 2-D plane and each output node has a neighborhood on the plane, NEIB (i).
Table 4. Related works on FSOM Author
Year
Result
Li, et al. [1]
2010
The proposed framework can support the police managers to assess more suitable law enforcement strategies and improve the use of police duty deployment to prevent crime.
Kurd and Kelly [4]
2007
The SCANN can be applied for nonlinear function approximation and allows certified learning and generalization for high criticality roles with many benefits for real-world application.
Hu, et al.[35]
2004
FSOM is much more efficient than Kohonen SOM and vector quantization in both accuracy and speed, and has encouraging performances for activity prediction and anomaly detection algorithms.
Kuo, et al. [36]
2001
The proposed FNN can provide more precise result compared to the FCM algorithm.
Chi, et al. [39]
2000
The customers are divided into four clusters: partiality type, service type, generality type and fortune type.
Table 3. Comparison between SOM and FSOM (Source:[38]) Technique/ Criteria
SOM
FSOM
Learning
Learns only the centers of clusters in the input vectors
Learns both the centers of clusters and deviations around the centers
Competition of nodes
The winner is the node giving the smallest distance between the input vector and its weight vector
The winner is the node giving the highest degree of inclusion into its corresponding fuzzy set
4.3 Related Works on FSOM The idea of visualization using FSOM has triggered several researchers all around the world as depicted in Table 4. For an example, Li, et al. [1] proposed a framework of intelligent decision-support model based on FSOM for detecting and analyzing crime trends patterns from temporal crime data. One limitation of the proposed model was difficult to
Besides, Hu, et al. [35] presented a new method for learning patterns of object activities in image sequences to detect anomaly and predict activity. Kuo, et al. [36] developed a novel fuzzy neural network (FNN) which integrates the SOM and the fuzzy set theory to cluster the parts into several families based on the image captured from the vision sensor. Furthermore, Chi, et al. [39] proposed a
41
Noor Maizura Mohamad Noor, Siti Haslini Ab Hamid
FSOM model for market segmentation which consists of three modules namely FSOM neural network, FCM algorithm and back-propagation neural network (BPN). The model improves the weakness in the quick response to the market and at the same time a new customer’s information is obtained. Referring to Table 4, researches using FSOM includes various fields of studies such as crime analysis, banking and manufacturing. However, there is only limited number of researches applied FSOM techniques including in crime analysis. In addition, most of the findings agreed with the capability of FSOM in term of accuracy [35, 36], performance [35, 39] and supporting decision making [1].
from the Comprehensive R Archive Network (CRAN) which is Kohonen package, SOM package and WCCSOM package network. For more details on the R, user can refer to CRAN website. Furthermore, GeoVISTA Studio is an open source tool [29] that also can be used to implement SOM. Table 5. Researches using various software tools Software
Year
Version/ package
Reference
Matlab
2015
Matlab version 8.0
[22]
2012
Matlab 2007
[23]
2012
Matlab version 7.6 / SOM toolbox
[21]
5. Software Tools for Visualization of Crime Data
2010
Custom SOM toolboxnetSOM
[24]
Table 5 shows several researches using various software tools to visualize data using SOM. Based on Table 5, the most popular software tool is Matlab. Matlab is a software that provides a user with a convenient environment to perform many types of calculations. Matlab has some advantages and disadvantages [40]. The basic Matlab software package can be extended by using add-on toolboxes. SOM toolbox is a function package for Matlab which is able to implement the SOM algorithm and oriented towards that direction in the form of powerful visualization functions. SOM toolbox contains functions for creation, visualizing and analysis of SOM and available free of charge under the GNU General Public License [41]. SOM toolbox has capability to train various topologies of SOM with different learning parameters, computing various errors of qualities, visualizing SOM using U-matrix, component planes, compute correlation, cluster analysis with SOM, and etc [42]. Besides, other software tools used by the researchers are Viscovery SOMine, R, GeoVISTA Studio and C/C++ compiler. Viscovery SOMine applies artificial intelligence techniques to automatically find the efficient SOM clusters [28]. It is a commercial program that is updated constantly. After the SOM training, it is possible to see the U-matrix of each parameter, but the users can configure the view how they want [42]. Viscovery SOMine has almost the same requirements on the format of dataset compared to SOM Toolbox in Matlab. It requires less programming, enabling an easier and more operable data processing and visualization [27]. Moreover, R statistical software is used widely among many researchers to solve challenging problems across disciplines (from Computer Science to Social Sciences such as Political Science) [43]. R has some advantages [44] and disadvantages [26]. R is very well-known in visualization and graphical display. It is also a programming language with an extensive set of built-in functions [45]. Users can also create their own functions. R offers many other visualization methods, from two dimensional scatter plots to complex interactive plots, which is designed for time series and also useful in the pre-processing phase. R can implement standard SOM where three packages are available
2009
SOM toolbox
[7]
2013
SOMine version 5.2.2
[27]
2013
SOMine version 5.1
[30]
2010
SOMine version 5
[28]
2014
SOMbrero package
[25]
2007
Kohonen package
[26]
Matlab and Viscovery SOMine
2014
SOM toolbox
[9]
GeoVISTA Studio
2015
-
[29]
C/C++ compiler
2010
SOM_PAK package
[46]
Viscovery SOMine
R
6. Conclusion and Future Direction Although the visualization technique has the highest capability to analyze crime data, still there is lack of researches using this new technique. Therefore, this study reviews the visualization of crime data using SOM and improvement in SOM technique especially using FSOM. In addition, this study also discusses some common popular software tools to visualize crime data. The results of this study lead to the following conclusions. Firstly, although SOM has been extensively applied in various fields of study, there are still a limited number of researches using SOM to visualize crime data. Secondly, FSOM is used to handle uncertainty where it combines fuzzy into SOM. However, there is also limited use of FSOM for visualization of crime data. Lastly, the popular software tool for visualization of data using SOM is Matlab. Other software tools are Viscovery SOMine, R, GeoVISTA Studio and C/C++ compiler. There are two limitations of this study. Firstly, this study applied several keywords for articles published from 2000
42 Visualization of Crime Data Using Self-organizing Map (SOM) and Improvement in SOM: A Review and Available Tools
until 2015. Future researches could be extended in scope to produce a better result. Secondly, this study only compared theoretically between SOM and FSOM. Therefore, future researches should be more specific to compare SOM and FSOM through several experiments.
[11]
[12]
Acknowledgement This study was supported by the Ministry of Higher Education (MOHE), Malaysia under Fundamental Research Grant Scheme (FRGS) and it is gratefully appreciated. Thanks to the Criminal Investigation Department from the Royal Malaysia Police for the cooperation in providing information.
[13]
[14]
References [1] S. T. Li, S. C. Kuo, F. C. Tsai, “An intelligent decisionsupport model using FSOM and rule extraction for crime prevention”, Expert Systems with Applications, vol. 37, no. 10, pp. 7108-7119, 2010. [2] H. Chen, W. Chung, J. J. Xu, G. Wang, Y. Qin, M. Chau, “Crime Data Mining: A General Framework and Some Examples”, Computer, vol. 37, no. 4, pp. 50 - 56, 2004. [3] E. W. T. Ngai, Y. Hu, Y. H. Wong, Y. Chen, X. Sun, “The application of data mining techniques in financial fraud detection: A classification framework and an academic review of literature”, Decision Support Systems, vol. 50, no. 3, pp. 559-569, 2011. [4] Z. Kurd, T. P. Kelly, “Using fuzzy self-organising maps for safety critical systems”, Reliability Engineering and System Safety, vol. 92, no. 11, pp. 1563-1583, 2007. [5] D. Olszewski, “Fraud detection using self-organizing map visualizing the user profiles”, Knowledge-Based Systems, vol. 70, pp. 324-334, 2014. [6] D. Marghescu, M. J. Rajanen, “Assessing the Use of the SOM Technique in Data Mining”, in 23rd IASTED International Multi-Conference, Innsbruck, Austria, 2005, pp. 181-186. [7] C. Budayan, I. Dikmen, M. T. Birgonul, “Comparing the performance of traditional cluster analysis, selforganizing maps and fuzzy C-means method for strategic grouping”, Expert Systems with Applications, vol. 36, no. 9, pp. 11772-11781, 2009. [8] M. F. Mustapha, N. E. A. Khalid, A. Ismail, “Time Consuming Factors for Self-organizing Map Algorithm”, in International Conference on Information Technology & Society, Kuala Lumpur, MALAYSIA, 2015, pp. 84-92. [9] X. Li, M. Juhola, “Country crime analysis using the self-organizing map, with special regard to demographic factors”, Journal of Knowledge, Culture and Communication, vol. 29, no. 1, 2014. [10] J. J. Fuertes, M. Dominguez, P. Reguera, M. A. Prada, I. Diaz, A. A. Cuadrado, “Visual dynamic model based on self-organizing maps for supervision and fault detection in industrial processes”, Engineering
[15]
[16]
[17] [18]
[19]
[20]
[21]
[22]
[23]
[24]
Applications of Artificial Intelligence, vol. 23, no. 1, pp. 8–17, 2010. J. H. Ratcliffe, “Visualising crime hotspots and making sense of high volume crime”, presented at the AIC conference Crime Mapping: Adding Value to Crime Prevention, Adelaide, 2000. C. Brunsdon, J. Corcoran, G. Higgs, “Visualising space and time in crime patterns: A comparison of methods”, Computers, Environment and Urban Systems, vol. 31, no. 1, pp. 52-75, 2007. S. R. M. Sakip, A. Abdullah, “Measuring Crime Prevention through Environmental Design in a Gated Residential Area: A Pilot Survey”, Procedia - Social and Behavioral Sciences, vol. 42, pp. 340-349, 7-8 July 2010 2012. P. M. D. U.-. PMDU, “Government Transformation Programme Roadmap”, P. M. Office, Ed., ed. Putrajaya: Percetakan Nasional Malaysia Berhad (PNMB), 2010, p. 109. A. Abdullah, N. A. Razak, M. N. M. Salleh, S. R. M. Sakip, “Validating Crime Prevention through Environmental Design Using Structural Equation Model”, Procedia - Social and Behavioral Sciences, vol. 36, pp. 591-601, 2012. M. C. Soh, “Crime and Urbanization: Revisited Malaysian Case”, Procedia - Social and Behavioral Sciences, vol. 42, pp. 291-299, 2012. T. Kohonen, “The self-organizing map”, Neurocomputing, vol. 21, no. 1-3, pp. 1-6, 1998. H. Jin, W. H. Shum, K. S. Leung, M. L. Wong, “Expanding Self-Organizing Map for data visualization and cluster analysis”, Information Sciences, vol. 163, no. 1-3, pp. 157-173, 2004. G. Cabanes, Y. Bennani, D. Fresneau, “Enriched topological learning for cluster detection and visualization”, Neural Networks, vol. 32, pp. 186-195, 2012. O. E. Dragomir, F. Dragomir, M. Radulescu, “Matlab Application of Kohonen Self- Organizing Map to Classify Consumers’ Load Profiles”, Procedia Computer Science, vol. 31, pp. 474-479, 2014. M. Chattopadhyay, P. K. Dan, S. Mazumdar, “Application of visual clustering properties of self organizing map in machine–part cell formation”, Applied Soft Computing, vol. 12, no. 2, pp. 600–610, 2012. Y. Nam, S. H. Koh, S. J. Jeon, H. J. Youn, Y. S. Park, W. Choi, “Hazard rating of coastal pine forests for a black pine bast scale using self-organizing map (SOM) and random forest approaches”, Ecological Informatics, vol. 29, pp. 206–213, 2015. H. M. Kang, F. Yusof, “Application of Self-Organizing Map (SOM) in Missing Rainfall Data in Malaysia”, International Journal of Computer Applications, vol. 48, no. 5, pp. 23-28, 2012. B. Silva, N. Marques, “Feature Clustering With SelfOrganizing Maps and an Application to Financial Time-Series for Portfolio Selection”, presented at the International Conference on Neural Computation (ICNC), 2010.
43
Noor Maizura Mohamad Noor, Siti Haslini Ab Hamid
[25] J. Boelaert, L. Bendhaiba, M. Olteanu, N. VillaVialaneix, “SOMbrero: an R package for numeric and non-numeric Self-Organizing Maps”, in Advances in Self-Organizing Maps and Learning Vector Quantizatio, pp. 219-228, Springer International Publishing, 2014. [26] R. Wehrens, L. M. C. Buydens, “Self- and Superorganizing Maps in R: The kohonen Package”, Journal of Statistical Software vol. 21, no. 5, pp. 1-19, 2007. [27] X. Li, M. Juhola, “Crime and Its Social Context: Analysis Using the Self-Organizing Map”, in European Intelligence and Security Informatics Conference (EISIC), Uppsala 2013, pp. 121-124 [28] M. M. Mostafa, “Clustering the ecological footprint of nations using Kohonen’s self-organizing maps”, Expert Systems with Applications, vol. 37, no. 4, pp. 27472755, 2010. [29] A. C.-D. Lee, C. Rinner, “Visualizing urban social change with Self-Organizing Maps: Toronto neighbourhoods, 1996-2006”, Habitat International, vol. 45, pp. 92-98, 2015. [30] P. Sarlin, “Exploiting the self-organizing financial stability map”, Engineering Applications of Artificial Intelligence, vol. 26, no. 5-6, pp. 1532-1539, 2013. [31] X. Li, M. Juhola, “Application of the self-organising map to visualisation of and exploration into historical development of criminal phenomena in the USA, 19602007”, International Journal of Society Systems Science, vol. 6, no. 2, pp. 120-142, 2014. [32] M. Alruily, A. Ayesh, H. Zedan, “Crime profiling for the Arabic language using computational linguistic techniques”, Information Processing and Management, vol. 50, no. 2, pp. 315-341, 2014. [33] M. R. Keyvanpour, M. Javideh, M. R. Ebrahimi, “Detecting and investigating crime by means of data mining: a general crime matching framework”, Procedia Computer Science, vol. 3, pp. 872-880, 2011. [34] T. L. Huntsberger, P. Ajjimarangsee, “Parallel selforganizing feature maps for unsupervised pattern recognition”, International General Systems, vol. 16, no. 4, pp. 357-372, 1990. [35] W. Hu, D. Xie, T. Tan, S. Maybank, “Learning Activity Patterns Using Fuzzy Self-Organizing Neural
[36]
[37]
[38]
[39]
[40] [41]
[42]
[43]
[44] [45]
[46]
Network”, IEEE Transactions On Systems, Man, and Cybernetics, vol. 34, no. 3, pp. 1618-1626, 2004. R. J. Kuo, S. C. Chi, P. W. Teng, “Generalized part family formation through fuzzy self-organizing feature map neural network”, Computers & Industrial Engineering, vol. 40, no. 1-2, pp. 79-100, 2001. P. Vuorimaa, “Use of The Fuzzy Self-organizing Map in Pattern Recognition”, in IEEE World Congress on Computational Intelligence., Orlando, FL 1994, pp. 798-801. T. Nomura, T. Miyoshi, “An adaptive rule extraction with the fuzzy self-organizing map and a comparison with other methods “ in Annual Conference of the North American Fuzzy Information Processing Society, College Park, MD 1995, pp. 311-316 S. C. Chi, R. J. Kuo, P. W. Teng, “A Fuzzy Selforganizing Map Neural Network for Market Segmentation of Credit Card”, in International Conference on Systems, Man, and Cybernetics, Nashville, TN, 2000, pp. 3617-3622. S. J. Chapman, Essentials of MATLAB Programming, Second ed. vol. 10. Stamford: Bill Stenquist, 2009. J. Vesanto, J. Himberg, E. Alhoniemi, J. Parhankangas, “Self-organizing map in Matlab: the SOM Toolbox”, in Matlab DSP Conference, Finland, 1999, pp. 35-40. P. Stefanovic, O. Kurasova, “Visual analysis of selforganizing maps”, Nonlinear Analysis: Modelling and Control, vol. 16, no. 4, pp. 488-504, 2011. C. Wagner, S. Miller, J. M. Garibaldi, “A Fuzzy Toolbox for the R Programming Language”, presented at the International Conference on Fuzzy Systems, Taipei, 2011. A. D. Vries, J. Meys, R for Dummies, 1 ed. Chichester: John Wiley & Sons, Ltd, 2012. A. Nasridinov, Y. H. Park, “Visual Analytics for Big Data using R”, in Third International Conference on Cloud and Green Computing, Karlsruhe 2013, pp. 564 565. G. Andrienko, N. Andrienko, P. Bak, S. Bremm, D. Keim, T. V. Landesberger, C. Pölitz, T. Schreck, “A Framework for Using Self-Organizing Maps to Analyze Spatio-Temporal Patterns, Exemplified by Analysis of Mobile Phone Usage”, Journal of Location Based Services, vol. 4, no. 3-4, pp. 200-221, 2010.