exemplified by the Microsoft BizTalk Schema Mapper [1], which provides a visual means of building ..... corrections for multiple tests) showed that feature set A (the .... In addition, user satisfaction ratings corroborated those performance results,.
Visualization of Mappings Between Schemas George G. Robertson, Mary P. Czerwinski, John E. Churchill Microsoft Research One Microsoft Way, Redmond, WA {ggr, marycz, echurch}@microsoft.com ABSTRACT
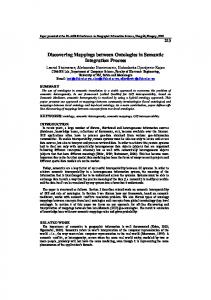
the right, and the mapping is shown between them. The mapping is a network of functoids (functional operations) connected by links to schema elements and other functoids. Once a mapping is visually defined, an XSLT style sheet is compiled for use.
In this paper we describe a novel approach to the visualization of the mapping between two schemas. Current approaches to visually defining such a mapping fail when the schemas or maps become large. The new approach uses various information visualization techniques to simplify the view, making it possible for users to effectively deal with much larger schemas and maps. A user study verifies that the new approach is useful, usable, and effective. The primary contribution is a demonstration of novel ways to effectively present highly complex information. Author Keywords
Visualization, schema mapping, interaction techniques, XSLT, XML ACM Classification Keywords
H5.m. Information interfaces and presentation (e.g., HCI): Miscellaneous.
Figure 1. BizTalk Schema Mapper for a simple map.
INTRODUCTION
A common problem in electronic business applications is transforming data from one XML (Extensible Markup Language [7]) schema into another. For example, data may come into a company in some industry-standard schema and must be transformed into a company-specific and/or need-specific schema. Ultimately, this is done with an XSLT (eXtensible Stylesheet Language: Transformations [7]) style sheet. However, for complex schemas and mappings, defining that XSLT style sheet is very difficult. One current, well-received solution to this problem is exemplified by the Microsoft BizTalk Schema Mapper [1], which provides a visual means of building a functional mapping from a source schema to a destination schema. Figure 1 shows a map between two simple schemas. The source schema is on the left, the destination schema is on
Figure 2. Example of failure to scale well for large maps.
The problem with the current solution is that it does not scale well to large schemas or large maps, and yet that is exactly what businesses need. Figure 2 is an example of such a failure. The details of interest become lost in a maze of complexity. In the current solution, a user may select any schema element, link, or functoid, but only that item is
1
Figure 3. Baseline configuration; similar to original BizTalk Mapper
from our implementation of SchemaMapper and the map used in our user study; a map from an actual BizTalk user.
highlighted. This means that to find a relationship between a source schema element and a destination element requires multiple selections and much scrolling of both the schemas and the map in order to establish a reasonable view.
We started this design process by implementing a prototype with the same visualization and behavior as BizTalk Schema Mapper. Figure 3 shows this configuration. Notice that one of the source schema elements has been selected, but only that item is highlighted.
Through customer visits, we have collected many examples of maps in real use that are similar to or even larger than the example shown in Figure 2. An informal survey of BizTalk users indicates that complex maps like this may occur about 10% of the time, but they take up in excess of 50% of the end user’s edit and creation time because of the complexity.
Highlight Propagation
The most important change is to propagate highlighting whenever any item (schema element, link, or functoid) is selected. By propagation, we mean that all links are followed in both directions, and every schema element, link, and functoid that is relevant to the selected item is highlighted as well. For complex maps, that would not be sufficient because of the density of links. So, in addition, we de-emphasize all the links and functoids that are not highlighted. The de-emphasis is accomplished by drawing the links in gray and the functoids with 30% transparency. Figure 4 illustrates highlight propagation.
BizTalk’s approach to schema mapping is similar to a number of other schema mapper systems, including BEA WebLogic Workshop [4], IBM WebSphere [9], TibCo BusinessWorks [16], Altova [2], Stylus Studio [15], Cape Clear [5], Sonic Software [14], and ActiveState [1]. Each of these systems has the same problems of scale, and the solutions we present could be applied to any of them. In this paper, we propose a new SchemaMapper visualization which addresses the problems of scale experienced by current users. We use novel visualization and interaction techniques inspired by the information visualization community to solve these problems. After describing these new techniques, we describe the results of a user study that verifies the usefulness, usability, and effectiveness of the new techniques.
Notice that we still have a problem if the functoids or schema elements of interest are not visible, since the basic interactive behavior does no auto-scrolling.
SCHEMA MAPPER VISUALIZATION IMPROVEMENTS
The basic approach to scaling to large schemas and maps is to focus on the most relevant items of interest and deemphasize or remove items of no relevance for a particular interaction. This approach is similar to the way dynamic queries [13] are used as a filtering mechanism for visual information seeking. However, the techniques reported here are driven by item selection rather than query sliders. We will describe the new techniques in order of importance. The figures used to illustrate each technique are screenshots
Figure 4. Highlight propagation after selecting element. Auto-scrolling
Text editors have had some form of auto-scrolling for many years. If you type past the end of the visible region of a 2
Figure 5 shows the effects of these three auto-scroll techniques after selecting a destination schema element. While this helps a great deal, we still may have a problem if the distance between related schema elements is large, because of intervening information not relevant at the moment. Figure 5 shows such a case, with one of the highlighted source schema elements not visible.
document, the editor auto-scrolls to the appropriate place so that you can continue typing. In a similar way, we introduce three kinds of auto-scrolling to the SchemaMapper visualization. Each technique is driven by a user selection of an item. Auto-scroll Map
After highlight propagation, the map is auto-scrolled so that the mid-point between the top-most and bottom-most highlighted functoids is vertically centered on the vertical position of the selected schema element. We experimented with centering on the center of the window, but found that too much motion was involved, since both schemas would have to scroll as well. So, centering on the selected schema element works much better, as confirmed by informal user feedback. Figure 6. Coalesced trees. Auto-scroll Columns within Map Coalescing Trees
When the map is auto-scrolled, it is often still the case that the functoids along the selected path (between source schema element, functoids, and destination schema element) are not aligned. This happens partly because the maps are laid out by hand and partly because of inherit complexity of the linking network. To address this problem, we use a technique originally suggested by the Cone Tree visualization [12]. In Cone Trees, the path from a selected node to the root is centered, so that at each level of the tree the appropriate node is centered. The 2D equivalent is to move each column of the map so that the next functoid on the selected path is centered on that path. This is only done for the top-most highlighted functoid in each column. The result is that the entire selected path is centered on the originally selected schema element.
To address the problem of non-relevant information being displayed in the schema tree view, we introduce a method for coalescing nodes deemed not relevant at the moment. This technique was partly inspired by the Polyarchy visualization [11], which only shows tree nodes relevant to the current user query. It was also inspired by the Favorite Folders technique [7], which provides a way to manually mark which folders to keep in a tree view. But instead of marking items manually, SchemaMapper uses implicit relevance based on two factors: whether a schema element or any of its descendants has a link, and the selected and highlighted schema elements. Figure 6 shows the result of the same selection as in Figure 5, but with coalescing trees. Notice that the highlighted source schema elements are now much closer together and fully visible on the screen.
Figure 5. Auto-scrolling of map, columns, and schemas. Auto-scroll Schema Tree Views
To complete this centering, we also need to center the highlighted schema element(s) in the related schema. When we do this, we would like to animate the scrolling of the node in the tree view to its new location. This is inspired by the Polyarchy visualization [11], which used animated transitions to ensure that users do not lose track of the nature of complex transitions. The standard Windows TreeView control [17] does not support centering of a node or animated scrolling. We introduced these two techniques into a modified version of the TreeView control to allow their use in the SchemaMapper visualization.
Figure 7. Close-up of coalesced nodes with tooltip.
3
Figure 7 shows a close-up view near one of the coalesced nodes of the source schema. Hovering over a node will produce a tooltip that describes what has been coalesced. If you click on the coalesced node’s down-arrow, the coalesced nodes are made visible and the down-arrow becomes an up-arrow. Clicking on the up-arrow will recoalesce those nodes. Notice that there are multiple coalesced node sets at the same level in this hierarchy. Favorite Folders actually puts all of its coalesced nodes for a level into one ellipsis at the end of the level. However, for schema management, the order of the nodes has meaning; hence, it is desirable to have coalesced node sets appear in place rather than being combined.
TreeView control, to support automated collapsing of unmarked nodes.
Multi-Select
Notice that the scrollbars in Figure 10 have tick marks. These represent all of the search hits in the entire schema. The scrollbar highlighting was inspired by similar search results scrollbar highlighting in the DateLens [4] calendar visualization. The difference here is that the scrollbar’s highlighted tick marks are interactive. If you hover over one, a tooltip will describe the element. If you click on one, an animated scroll will bring the desired element to the center of the tree view, or as near to the center as possible.
Figure 9. Search for “ssn” in destination schema. Interactive Scrollbar Highlighting
On some occasions, a user wants to know how multiple schema elements interact. Currently that requires sequential selection and human memory. We have added multiple selection capability to the SchemaMapper visualization to address this problem. The first selection is done with a single click of the mouse button. Additional selections are done with a mouse click while holding down the Shift key. Figure 8 shows selection of three elements of the source schema. Notice that highlight propagation and auto-scroll are driven by the multiple selections.
Figure 8. Multi-selection of three source schema elements. Incremental Search
Coupling search capabilities with these new visualization features should provide powerful and fast ways for the user to find relevant information. We have added a search typein box above each schema (see Figure 10), along with a checkbox to indicate whether the search should be done only on linked elements or on all elements. The search is incremental, in that it shows the results after each keystroke in the type-in box. The multi-select mechanism is used to automatically show all the relevant information for the search hits. Figure 9 shows the results of an all-elements search for the string “ssn” in the destination schema.
Figure 10. Search type-in box and scrollbar highlights.
The tick marks are color-coded. Blue marks represent elements that are selected. Red marks represent search hits that are not currently selected. After a search, all of the tick marks will be blue because they are multi-selected. Each time the user types the Enter key, the system will (single) select the next search hit. Shift-Enter will (single) select the previous search hit. This gives the user a way to see all search hits simultaneously (the default) or to sequence through individual search hits. When sequencing through individual search hits, one of the ticks will be blue and the others will be red. Figure 10 is showing the default.
Automatic Parental Tree View Collapse
To display the most appropriate results of an incremental search, we want to show only the nodes in the searched schema that have search hits or have descendants with search hits. All other nodes should be collapsed. This is inspired by the Polyarchy visualization [11], which also shows only the information relevant to the query. To implement this required changing the basic behavior of the
Bendable Links
When highlighting a path between schema elements, occasionally a link will pass directly behind a functoid.
4
USER STUDY
When this happens, it becomes visually ambiguous; the user cannot be sure if the link connects to the functoid or not. In addition, the link may obscure an existing link to the functoid. To avoid these problems, we detect this case and visually bend the link around the functoid. Figure 5 shows an example of this, where a link has been bent below a functoid. Figure 11 shows a close-up of the same link. Since we know which functoid to avoid, drawing a bent link is done simply by drawing an arc with a control point either directly above or below the functoid being avoided.
In order to test the usability and usefulness of the redesigned SchemaMapper visualization, we built a fully functioning prototype of the tool in a manner that allowed us to systematically turn on and off particular features. This provided us with the ability to incrementally investigate the influence of each in comparison to the baseline version of how the SchemaMapper works in the original BizTalk mapper. Therefore, our baseline SchemaMapper visualization was simply the existing user interface, with one critical addition. All four versions of the mapper that we tested included a search capability for both the source and destination schema tree controls. This was also true for the baseline condition (feature set A), shown in Figure 3. The second condition in our study (feature set B) included highlight propagation, as described earlier (see Figure 4). The third condition (feature set C) involved a version of the mapper that included these features, but also added the three auto-scrolling mechanisms described earlier (auto-scroll map, auto-scroll columns, and auto-scroll schemas), as shown in Figure 5. The final condition in our study (feature set D) used a version of the mapper that included all of these features and in addition provided sibling coalescence and search result tick marks to visualize search hits in the scrollbar (Figure 6).
Figure 11. Close-up of bent link. Focus on Linked Elements
Like the original BizTalk Schema Mapper, our SchemaMapper visualization collapses tree view nodes that have no linked elements as descendants. To complete this visual behavior, we augment the TreeView interactive behavior to match the focus on linked elements. In particular, the use of the up/down arrow keys to advance to the previous/next element has been modified to advance to the previous/next linked element. If the user holds down the Shift key while typing the up/down arrow key, the original behavior is performed.
So, the study was a four-way within-subjects design of various incremental improvements to the SchemaMapper visualization. To control for order effects, the order in which participants experienced each of the versions of the mapper was counterbalanced using a partial Latin Square design (partial because only 8 participants were run through
Table 1. Two of the task sets used in the study.
5
not significantly different from each other. These results are shown in Figure 12.
the study, so all orders could not be tested; however, the squares were balanced). Participants
T ask T imes for Each Feature Set
Eight very experienced BizTalk users were recruited for participation. From an analysis of a background questionnaire, the participants had an average of 21 years of computer experience, over four years of experience using BizTalk, on average, and were 38.4 years old, on average (ranging from 28 to 49 years old).
60
BizTalk + Search Average Task Time (Seconds)
50
Tasks
Six tasks involving finding elements in the source and target schema maps, their related functoids and their connections were devised. An effort was made to keep the tasks isomorphic so that the participants experienced similar tasks as they viewed each version of the mapper. To ensure that no one task set was accidentally more difficult than the rest, however, we rotated the task set through the visualizations. Two of the task sets are shown in Table 1 by way of example. The map that was used for the experiment was typical of the kinds of maps created in large corporate organizations, and came from a BizTalk customer. Figures 3-11 were created with the map used in the study. The aspect ratio of the window used for the study, as shown in those figures, was chosen to require scrolling of both schemas and the map for these tasks. This essentially simulates the behavior required for a more traditional aspect ratio on larger schemas and a larger map. All sessions were run with a single participant and lasted around one hour. Participants received lunch/dinner coupons for the local cafeteria for their participation.
40
Plus Link Highlighting
30
Plus Alignment
20 10
Plus Sibling Coalescence, Search Ticks
0
Feature Set
Figure 12. Average task times for each of the four feature sets for the SchemaMapper visualization.
Interaction between feature set and tasks reveals that certain tasks were harder than others (in particular tasks 3 and 5), and that some tasks (e.g., 1-4) were especially difficult when using the original SchemaMapper, feature set A. The average task time by trial data is shown in Figure 13. T ask T imes by Feature Set and T rial 90
Average Task Time (Seconds)
80
RESULTS Task Times
A 4 (mapper feature sets A-D) x 6 (tasks) Analysis of Variance (ANOVA) with repeated measures was carried out on the task time data, both with and without a log transformation of the task times (log transformations are utilized to reduce the heavy skewing in response time data in order to better adhere to the assumptions of ANOVA). The pattern of significant results observed for both tests was the same, so the results from the logged data will be presented. A significant main effect was obtained for the mapper feature set used, F(3,21)=45.1, p