Visualization of Selected Algorithms of Graph Theory Hedviga Palásthy, Janka Majherová, Igor Černák Department of computer science, Faculty of Education, Catholic University Ružomberok, Slovakia
[email protected],
[email protected],
[email protected] Abstract — A visualization and creation of models along with their application to demonstrate and study various objects and phenomena of the real world play an important role in the demonstrative education. In this paper, the authors consider a possible utilization of computer programs for visualization in the teaching of graph theory. They present several publicly available applications as well as the programs created as a part of students’ Bachelor and Master theses at the Faculty of education of Catholic University in Ružomberok. Index Terms— visualization, Imagine, algorithmization, theory of graphs
I. INTRODUCTION The educational software is a tool for the students to learn, understand and experiment. An important feature is a possibility to visualize processes, systems or phenomena. Visualization is a method for the visual interpretation of data, which uses the advantages of human perception in the analysis. An appropriate visualization allows students to understand the presented problem better and more quickly. It also makes it easier to understand causes and consequences of the changes. The visualization also provides an option to highlight or suppress some important features, which is convenient during the first contact of the students with the environment (Černák, Polčin, 2008). A possibility of visualization is important also during a teaching process of graph theory in particular courses at the university. Students have already developed an abstract thinking and hypotheticaldeductive inference, which should be additionally enhanced by educational software designed for learning about the graphs. A student has to understand the issue and develop a proper and comprehensive perception about the used concepts. Otherwise he is not able to understand the ideas based on these concepts and apply them in the practice. It is not possible to be successful in programming by using only the formal knowledge obtained by automatic memorizing (Lehotský, Krakovský, Považan, 2006). II. THE AVAILABLE APPLICATIONS FOR A WORK WITH THE GRAPHS IN TEACHING
A teaching of the graph theory is not a simple one, since it deals with an abstract model (Lalinská, Majherová, 2010). It is a great advantage if the students have an option to directly try the approaches of a problem solving with the use of information
978-1-4673-1677-4
technologies. It is necessary to choose an appropriate representation and visualization, which allows students to adopt the concepts. Interactive environments provide an immediate feedback and thus maintain student’s attention and focus, while partially replacing a role of teacher. Their additional advantage is an option to move backwards in the procedure (Círus, 2006). We can start a familiarization of students with the principles of graph theory by the GeoGebra program. Free software GeoGebra (available at geogebra.org) visually represents a variety of mathematic terms and relations in a dynamic way. The GeoGebra can be used as an effective motivating tool for a visualization of the graphs (Gunčaga, Majherová, 2012). Several materials containing algorithms dealing with the graphs can be found on the website geogebratube.org. For instance, let’s consider an applet for construction of a complete graph of degree N (fig. 1).
Fig. 1 Minimum spanning tree
Weights of edges of the graph are generated randomly; a spread of the weights can be adjusted with the min and max sliders. Moreover, we can construct a tree by addition of edges. The worksheet displays whether we have selected a spanning tree, but not whether it is the Minimum Spanning Tree. (http://www.geogebratube.org/material/show/id/10552) Another applet can be used to find a minimum distance path in the graph (fig. 2). (http://www.geogebratube.org/material/show/id/7846).
17
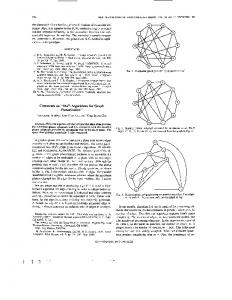
Fig. 4 Visualising the skeleton graph in Jive
Fig. 2 Minimum distance path
Program yED (fig. 3) is a very powerful graph editor that can be used to quickly and efficiently create drawings of the various diagrams and networks. yED is also available as a free download with unrestricted functionality. It is an application designed to work with the graphs. Unfortunately, it is not intended to be used to teach the graph theory. Its primary specification is the visualization of the graphs in practical and comprehensible form using its layout with the various structures. However, it does not work with algorithms nor it doesn’t allow them to be created. (http://www.yworks.com/en/products_yed_about.html)
III. VISUALIZATION PROGRAM FOR THEORY OF GRAPH
As an example of the visualization in the graph theory, we present a program for the visualization of selected algorithms, which has been developed in the children's programming language Imagine. The program was created as a Master thesis of a student at the Pedagogical Faculty of Catholic University. The program allows displaying algorithms for minimum skeleton, minimum path in a graph. The environment contains buttons for the instructions, a button for clearing, and two buttons for selecting the algorithm for drawing a skeleton of the graph (fig. 5). A button ALGORITHMS is used to list the individual steps of algorithms that were used during the calculation. Each step contains a short description of what does it comprise. We can select Kruskal´s algorithm or Prim´s algorithm to find the minimum skeleton graph. Consequently, we can write a matrix into the command line. This matrix contains the weights for the individual edges of the graph. (Daubnerová, 2011).
Fig. 3 Visualization in yED
Jive is a Java applet, which contains three very well visualized algorithms: depth first search, graph coloring and the vertices cover (http://jivesoftvare.com). The great advantage is the option of choice of vertex, in which algorithm continues and the possibility to change the speed of the algorithm. These interactive elements and allow student to better understand and the improving the student attention of work the algorithm. For each operation a dialog window projects with its description and with the possibility of further do not show the description of the operations of that type. This applet is suitable only as a demonstration program of work of three algorithms, because it does not allow you to add your own algorithms (fig. 4). The applet supports the generation of several basic types of graphs and work with trees. Control algorithm and work with the graph is simple (Pavlík, 2007). 978-1-4673-1677-4
Fig. 5 Visualization algorithm of skeleton chart
The program displays a number of vertices and edges, a list of the weights of edges in a consecutive order, and order of plotting of vertices and edges. For each edge, a starting and ending vertex along with its weight are displayed. The program gradually plots a minimum skeleton of a given graph. We can display the minimum skeleton obtained separately by both algorithms in a single chart. We can also see the summary of individual steps of the algorithms. The second algorithm is the one for finding the minimum path in the graph. The program draws the graph and minimum path between two vertices (fig. 6).
18
We can also get the individual steps of the Floyd´s algorithm.
Fig. 8 Visualization of Djikstric algorithm Fig. 6 Minimum path algorithm visualization
Another program Simple Graph for visual processing of the algorithms has been created in the programming language Delphi 7.0. The students can take advantage of the clear link to knowledge of discrete mathematics and theoretical computer science. Main menu consists of several parts: Djikstra´s algorithm, Ford-Fulkerson´s algorithm and the most likely path. We can also choose the plotting speed of the respective algorithm (Prílepková, 2012). In this program we can create an arbitrary graph, which can be used to demonstrate a specific algorithm and procedure of its calculation. A toolbar consists of ten tools that can be used during a process of drawing the graph (creation of a new graph, loading graph from the file, save the graph to a file, insert vertex into a graph, insert edges into a graph, set the vertex beginning, set the vertex - end, set the vertex - default, delete objects marked in the graph (Del), a random weighting of edges). A plotting field, where we draw a graph, is situated below the toolbar. In addition, we can save the graph or reload it (fig. 7).
IV. CONCLUSION In this contribution we focused on the visualization in the teaching of the graph theory. A goal of application of these new approaches is to help a teaching process of informatics to become more demonstrative and appropriate with regard to the current trends in computer science and in the development of information technology. Taught topics, represented by the visualization, can be displayed in much more attractive and interesting way, which motivates students to learn. (Volner, Tichá, Palásthy, 2012) The appropriate visualization helps students to understand the presented problem better and more quickly. It makes it easier to understand causes and consequences of the changes. Interactive environment provides an immediate feedback and thus keeps student’s attention. The additional advantage is an option to move backwards in the process to the older solutions as well as to examine the accuracy of a solution. By using the tools for visualization and modeling we are able to enhance students’ ability to learn in a visual way along with their creative and logical thinking. The students can construct an algorithm of a given problem and to put down problem’s solution using the symbolic language. ACKNOWLEDGMENT This paper was created with the support of the project KEGA 010 TTU-4/2012. REFERENCES
Fig. 7 Visualization graph in SimpleGraph
We can insert an arbitrary number of vertices into the graph. We link these vertices with edges by using the button “insert edges in a graph”. We have an option of random weighting of the edges in the graph or we can weight them manually by clicking on the respective edge and entering its weight. We can see a process of the calculation on the figure (fig. 8).
978-1-4673-1677-4
[1] Círus, L., “The Didactic support of education of mathematics by information technologies at primary school”, in International Conference Presentation of mathematics ´06 Liberec: Technical University, 2006, pp. 111-118. [2] Černák, I., Polčin, D., “Didactics of informatics 2”, Ružomberok, Catholic university, 2008. [3] Daubnerová, Z., “Visualization of the selected algorithms of graph theory in Imagine”, thesis, Ružomberok, Catholic university, p. 67, 2011. [4] Gunčaga, J., :View on some theories of mathematics education, in MATHEMATICS XVI, Publishing House of Jan Dlugosz University in Czestochowa, 2011, pp. 213-218. [5] Gunčaga, J., Majherová, J., “GeoGebra as a motivational tool for teaching and learning in
19
Slovakia.”, in: North American GeoGebra Journal, vol. 1/ 2012, pp. 45-48 , online [6] Lalinská, M., Majherová, J., “Aspects of Visualization during the Exploration of „Quadratic World“ via the ICT – problem „Fireworks“, in CERME 6 - Sixth Conference of European Research in Mathematics Education. Lyon, INSTITUT NATIONAL DE RECHERCHE PÉDAGOGIQUE, 2010, pp. 2126 2135. [7] Lehotský, M., Krakovský, R., Považan, J., “Algoritmization and programming in the Pascal language”, Ružomberok, Catholic university, 2006. [8] Pavlík, P., “Interactive environment to work with graph”, thesis, Bratislava, FMFI Comenius University, 2007, p.47, online . [9] Prílepková, K., “Visualization selected algorithms for graph theory”, thesis, Ružomberok, Catholic university, 2012. [10] Volner, R., Tichá, D., Palásthy, H., “Computer-based Cognitive and Socio-emotional Training in Personal Health Information Management”, Proceedings 45tndAnnual 2011 International Carnahan Conference on Security Technology, Barcelona, 2011. [11] http://www.geogebratube.org/material/show/id/10552 [12] http://www.geogebratube.org/material/show/id/7846 [13] http://jivesoftvare.com [14] http://www.yworks.com/en/products_yed_about.html
978-1-4673-1677-4
20