Atlanta, Georgia 30332, U.S.A.. Vaidy Sunderam ... mercially available software products. However, the development of efficient parallel dis- crete event simulation systems ... alizations for parallel simulations refers to customized views whose ...
Proceedings of the 1997 Winter Simulation Conference ed. S. Andradóttir, K. J. Healy, D. H. Withers, and B. L. Nelson VISUALIZING PARALLEL SIMULATIONS IN NETWORK COMPUTING ENVIRONMENTS: A CASE STUDY Christopher D. Carothers Brad Topol Richard M. Fujimoto John T. Stasko
Vaidy Sunderam Department of Mathematics and Computer Science Emory University Atlanta, Georgia 30322, U.S.A.
College of Computing Georgia Institute of Technology Atlanta, Georgia 30332, U.S.A. ABSTRACT
advantages of these network computing environments include (i) ready availability, (ii) low cost, and (iii) incremental scalability. Furthermore, network computing environments retain their ability to serve as a general-purpose computing platform and run commercially available software products. However, the development of efficient parallel discrete event simulation systems in network computing environments is not without obstacles. Typically, applications execute on workstations in an open network computing environment whereby each workstation as well as the network itself is subject to uncontrollable external loads. Furthermore, workstations have varying configurations in terms of CPU speed, memory, local vs. networked disks, etc. These factors often result in load imbalances and dynamic fluctuations in delivered resources which can be a major source of performance degradation (Schmidt and Sunderam 1994). To better understand how these factors degrade simulator performance and help develop algorithms that mitigate them, we propose the use of Graphical Visualization (GV). GV has been shown to be a useful aid in performing several activities associated with parallel computing such as verification, performance analysis, and program understanding (Kraemer, Stasko 1993). The usefulness of GV for these activities stems from the highly developed image processing system possessed by humans, which allows us to track multiple complex visual patterns and to easily spot anomalies in these patterns. Consequently, the textual equivalent of the information provided by a visualization may be much more difficult for a user to assimilate. GV systems operate in one of three modes: (i) on-line, (ii) off-line, and (iii) a combination of (i) and (ii). In on-line mode, the GV system collects run-time performance data from the monitored system and immediately displays the information. In off-line mode, the GV system collects and stores (in a file) the PDES data. After the simulation completes, the stored data can then be displayed or
Parallel discrete event simulation systems (PDES) are used to simulate large-scale applications such as modeling telecommunication networks, transportation grids, and battlefield scenarios. While a large amount of PDES research has focused on employing multiprocessors and multicomputers, the use of networks of workstations interconnected through Ethernet or ATM has evolved into a popular and effective platform for PDES. To improve performance in these environments, we investigate the use of graphical visualization to provide insight into performance evaluation and simulator execution. We began with a general-purpose network computing visualization system, PVaniM, and used it to investigate the execution of an advanced version of Time Warp, called Georgia Tech Time Warp (GTW), which executes in network computing environments. Because PDES systems such as GTW are essentially middleware that support their own applications, we soon realized these systems require their own middleware-specific visualization support. To this end we have extended PVaniM into a new system, called PVaniM-GTW by adding middleware-specific views. Our experiences with PVaniM-GTW indicate that these enhancements enable one to better satisfy the needs of PDES middleware than general-purpose visualization systems while also not requiring the development of application specific visualizations by the end user. 1
INTRODUCTION
To date, much of parallel discrete event simulation (PDES) research has focused on employing dedicated multiprocessor and multicomputer platforms to speed up simulation computations, such as the Intel Paragon and KSR machines. However, the use of networks of workstations interconnected through WAN/LANs, such as Ethernet and ATM, has evolved into a popular and effective platform for PDES. The 110
Visualizing Parallel Simulations in Network Computing Environments animated. On-line mode has the advantage of showing the “real-time” execution of the monitored system, while off-line mode allows post-processing computations to be run on the collected data which provide a more detailed analysis of the monitored system. Of great concern was that parallel discrete event simulators by their very nature are long-running, complex, communication/computation sensitive systems. Consequently, we believe that any PDES visualization system must: (i) support “on-line” as well as “off-line” modes of operation, (ii) minimize the amount of computation perturbation such that the GV system does not become a performance bottleneck or mask other performance bottlenecks, (iii) be easy to use and integrate into the existing system, such that new errors are not easily introduced into the PDES simulator, (iv) support PDES specific views, and (v) be robust to endure long-running PDES simulations. In this case study, we modify an existing generalpurpose GV system, called PVaniM and used it to conduct a series of visualization experiments on an existing Time Warp system, called Georgia Tech Time Warp (GTW) in a network computing environment. PVaniM was chosen because it supported more of the above PDES visualization system requirements than any other GV system to our knowledge. Of particular importance was its ease of use, low system perturbation, and robustness. However, PVaniM’s default graphical views did not provide enough insight into the execution of the GTW system. This was due to the fact that all PDES systems are essentially middleware that support their own applications. We define PDES systems as middleware because they typically reside above the operating system and a communication substrate (e.g., PVM) yet support their own applications. We contend that complex network computing middleware such as Time Warp systems requires its own middleware-specific visualization support. Middleware-specific views focus on illustrating the operation of PDES middleware. They may be used with all simulation applications and allow the user to see how various applications perform on the PDES middleware. It is worth noting that middleware-specific views are not simply a set of application-specific views. Application-specific visualizations for parallel simulations refers to customized views whose appearance is tied to simulation model data. These types of views are typically provided by visual interactive simulation systems, such as those described in Section 4 of this paper. Our experiments demonstrate that by enhancing a general-purpose network computing visualization system with middleware-specific views, one is able to better satisfy the requirements and needs of PDES
111
middleware. Specifically, we document how we have used a GV system to locate performance aberrations, and gained greater insight into how to optimize an existing Time Warp system for a heterogeneous network computing environment. The remainder of this paper is organized as follows. Section 2 describes PVaniM’s visualization model, as well as its implementation. Section 3 details our distributed GTW system. Section 4 discusses related visualization systems. Section 5 presents the enhancements made to PVaniM necessary to visualize the GTW system. This newly enhanced visualization system is called PVaniM-GTW. Section 6 then describes the the results from our effectiveness study and Section 7 presents our conclusions as well as directions for future work. 2
OVERVIEW OF PVANIM
PVaniM is an experimental visualization environment developed for the PVM network computing system (Topol et al. 1996 and 1997). The purpose of PVaniM is to modify and enhance traditional visualization techniques used in multiprocessor and multicomputer visualization environments in order to enable their use in network computing environments. PVaniM supports both on-line and postmortem views. PVaniM’s on-line visualization support consists of the following types of views: Environment Views provide information regarding the network computing environment in which the parallel application executes. Information such as the workstations used by the parallel application, the external loads present on these workstations, and the amount of memory utilized by the individual tasks are displayed. Performance Evaluation Views provide insight into the performance of an application and help locate bottlenecks in the application. Debugging Views provide insight into the activities of the application (e.g., message passing behavior between tasks) to help locate program bugs. Interaction Views provide support for outputting results and for interacting (i.e., providing data input) with the parallel application. PVaniM also supports Postmortem visualization. PVaniM’s implementation may be found in (Topol et al. 1997). 3
GEORGIA TECH TIME WARP (GTW)
Time Warp is a well known synchronization protocol that detects out-of-order executions of events as they occur, and recovers using a rollback mechanism. We assume that the reader is familiar with the Time Warp mechanism as originally described in (Jeffer-
112
Carothers, Topol, Fujimoto, Stasko, and Sunderam
son 1985). Georgia Tech Time Warp (GTW) is our optimized version of the Time Warp protocol, which executes on both shared-memory multiprocessors and network computing environments. 3.1
Reflector Thread
We create a reflector thread which executes on each host. Its task is to marshal or “reflect” eventmessages to and from other GTW systems running on the other host machines. From the view of the other GTW kernels residing on a machine, the reflector thread looks like any other kernel. When an eventmessage is scheduled for an LP on another machine, that event-message is given to the reflector thread residing on the sending machine. Once in the reflector thread’s hands, the event-message is packaged up and sent to the destination machine using the PVM message passing system where the reflector thread on that machine receives it and places it in the incoming message queue of the GTW kernel that processes events for the destination LP. 3.2
Background Execution Algorithm
In a multi-user computing environment, users will “nice” or execute long running jobs “in background” allowing their CPU intensive jobs to obtain CPU cycles without hogging CPU resources from other users on the system. When the CPU is lightly loaded, the “niced” job will be given more CPU cycles and receive less cycles when the CPU is loaded. Likewise, in a cluster computing environment we anticipate the need for Time Warp programs to share CPU resources among other tasks in a similar fashion. However, a Time Warp program that is well-balanced when executing on dedicated hardware may become grossly unbalanced when executing on machines with external computations. LPs that are mapped to heavily utilized processors will advance very slowly through simulated time relative to others executing on lightly loaded processors. This can cause some LPs to advance too far ahead into the simulation future, resulting in very long or frequent rollbacks. Thus, it is essential that any Time Warp simulation running in “background” take into account the external workloads that are sharing the same CPUs. To mitigate the problems caused by external workloads in the cluster computing environment as well as to allow Time Warp programs to co-exist with other running programs, we developed a background execution (BGE) algorithm that: (i) dynamically allocates additional CPUs during the execution of the distributed simulation as they become available and migrates portions of the distributed simulation work-
load onto these machines, (ii) dynamically releases certain CPUs during the simulation as they become loaded with other, external, computations, and offload the workload to the remaining CPUs used by the distributed simulation, and (iii) dynamically redistributes the workload on the existing set of processors as some become more heavily or lightly loaded by changing, internal or externally induced workloads, and at the same time maintain efficient execution of the Time Warp program (i.e., limit the amount of rolled back computation). For a detailed explanation of our BGE algorithm, we refer the reader to (Carothers et al. 1996). 4
RELATED VISUALIZATION SYSTEMS
Several simulation systems have utilized visualization in one form or another. Many of these systems are referred to as Visual Interactive Simulation (VIS) systems (Okeefe 1987). These systems typically provide support for interaction with the simulation model, visualizations of model data, and other model related activities. An excellent example of a VIS system is DISplay (Mascarenhas et al. 1995). The DISplay system is an application-independent visualization and user-interaction toolkit for use in distributed computing environments. With DISplay, a user may create application-specific displays and interaction facilities that may be used with both parallel simulations or computations. The WITNESS (Thompson 1993) VIS system provides a visual model builder to reduce the time and complexity of simulation creation. WITNESS also provides graphical reporting elements such as histograms and pie charts that may be displayed while the model executes. The SIMAN/Cinema (Glavach and Sturrock 1993) system provides a large number of graphical capabilities including barcharts, histograms, and plots. Furthermore, the Cinema system provides CAD support and dynamic status displays and animations may be viewed in real time or in a postmortem fashion. The XTracker (Bellenot and Duty 1995) system provides graphical visualizations of the execution of parallel simulations. XTracker provides Gantt-like charts of simulation activities on a per node basis and can also display event messages as traffic between objects. Finally, (Graham et al. 1996) proposes a visual environment for distributed Time Warp simulations. This system displays information on how individual LPs behave as a means of monitoring simulation performance.
Visualizing Parallel Simulations in Network Computing Environments
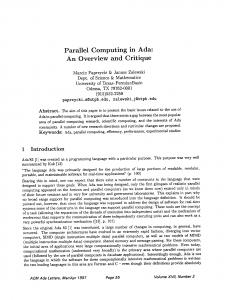
Figure 1: PVaniM-GTW Graphical User Interface 5
PVANIM-GTW
PVaniM-GTW, shown in Figure 1, is composed of several default PVaniM views and GTW middlewarespecific views. These views are updated every t seconds, where t is the user selected sampling interval. The sampling interval can be dynamically changed at runtime by sliding the sampling interval interface bar located at the bottom of the PVaniM-GTW window. The sampling interval has a range of one to sixty seconds. We have found that sampling intervals less than 1 second may excessively perturb the monitored program. The following provides a brief description of both types of views and the insights each contributes to the understanding of GTW’s behavioral characteristics and the BGE algorithm. We then describe how the PVaniM-GTW visualization system monitors GTW. 5.1
Default Views
To provide a rich selection of information views without overcrowding the PVaniM window space, we display some of the information in toggled views. A toggled view can display two different system metrics. Clicking the mouse on the toggled view’s title causes the view to change the system metrics being displayed. In the view’s title, the performance metric in all capital letters is the one currently being displayed. The list of PVaniM default views includes the following: Located in the upper left corner of the PVaniMGTW window, the Host List view identifies the host machines used by the application and the placement of the tasks on these hosts. The Memory Usage view is positioned in the upper right hand corner. It illustrates the aggregate amount of memory utilized by the PVM task on each host. Located to the left of the Memory Usage view, the Load view provides insight into the aggregate load on the host machines by providing a graphical view of the average number of jobs in the run queue of the host. A novel fea-
113
ture of this view is ints ability to account for external loads as well as PVM task loads. Located below the Host List view, the Task Summary view characterizes the percentage of time a task spends performing application-specific computation, denoted in green, the percentage of time a task spends performing PVM sends, denoted in yellow, and the percentage of time a task spends in PVM receives, denoted in red. The typical inference drawn from the Task Summary view is that the program is running well if the task is “in the green”, meaning that most of its execution time is being spent doing application specific computation. While this is true for most conservative computations, this view can be misleading for optimistic simulations if used without additional information. The problem is that this view leads one to believe that all computation (shown in green) is good. The fact is that for optimistic simulations, this is simply not true. Because optimistic computations allow out-of-order execution, some computation time will be spent rolling back to put the simulation in a causally correct state. The lesson here is that designers and users of visualization systems need to be very cautious and conservative in the inferences they draw from a particular default graphical view, when being used on an optimistic parallel simulation. Moreover, the addition of application or middleware-specific views may be necessary to give a more accurate picture of the system being monitored, as in the case with our GTW system. The Messages sent / bytes sent view, which is located below the Task summary view, illustrates how much message traffic a task has incurred over the last statistics sampling interval. Positioned below the Messages sent view, the Task Print view displays PVaniM and application specific text messages. Positioned above the sampling interval selection bar, the Total matrix / interval matrix communications view gives insight into communications patterns among the active hosts, either cumulative or interval communications patterns. 5.2
Middleware Specific Views
In addition to PVaniM’s default set of graphical views, we included the following set of five GTW specific middleware views. To fit the additional views in PVaniM’s window space we implemented many of these views as toggled views. Processor Advance Time (PAT) values: This view is located to the right of the Host List view. The processor advance time is defined as the amount of wall clock time needed to advance the sim-
114
Carothers, Topol, Fujimoto, Stasko, and Sunderam
ulation a single unit of simulation time. When the PAT values among the host processors differ, there exists a load imbalance. The BGE algorithm migrates clusters of LPs to the appropriate machines such that the PAT values across all machines should be about equal. Consequently, this view gives an immediate indication regarding how well the BGE algorithm is balancing the load. For processors not in use, their PAT value is zero. Clusters / Primary Rollbacks (PRBS): Positioned to the right of the PAT view, this is a toggled view that displays either how the clusters are distributed among the active hosts or the percentage of events processed that are rolled back during the sampling interval due to a late arriving application message (a.k.a straggler message). Secondary rollbacks (SRBS): Located to the right of the Cluster / PRBS view, this toggling view (shared with the Load view) shows the percentage of the events processed that are rolled back during the sampling interval due to the processing of an anti-message. This view provides insight into how far an erroneous computation has spread by indicating the fan-out of LP communication links along which messages are scheduled in the application being simulated. Aborted events: Right of the SRBS view, this toggling view (shared by the Memory Usage view) shows the percentage of events processed that are aborted during the sampling interval. In the GTW system, a fixed number of event buffers are allocated during initialization and manages those buffers to avoid costly memory allocation system calls during runtime. An event is aborted if the scheduling of a future event fails because all event buffers are currently in use. This approach is used to prevent a processor from becoming overly optimistic. Usually, events are aborted because a slow GVT calculation process or a general lack of event buffers due to the large set of pending events. Like rollbacks, aborted events have a detrimental effect on system performance and should be avoided whenever possible. 5.3
Monitoring GTW
To avoid any unnecessary perturbation of GTW, we had to consider not only the level of detail in which the system is monitored, but how GTW should be monitored. The monitoring support for standard PVaniM was designed with an emphasis on ease of use and requiring minimal programmer effort. Essentially, all that is required by the developer is to add an extra header file (GTW is written in C) which provides macros that replace standard PVM routines with calls to PVaniM’s monitoring library. The mon-
Table 1: Perturbation Results Performance Metric Exec. Time (sec.) Number of Rollbacks Events Rolled Back Events Cancelled Events Aborted Avg. Rollback Dist.
GTW 375.89 40996 886761 11611 4896250 21.63
P-GTW 382.70 38719 732434 10113 4859281 18.92
Difference +1.81% -5.55% -17.40% -12.90% -0.76% -12.53%
Figure 2: PCS Application Before BGE (Toggled Views) itoring library performs all activities related to gathering monitoring data and then performs the actions associated with the standard PVM routines. PVaniM-GTW continues PVaniM’s policy of ease of use. All monitoring, including monitoring for middleware-specific visualizations, is performed inside macros that replace standard PVM routines. The routines now perform both generic monitoring support as well as gather middleware-specific monitoring data. The middleware-specific monitoring data is gathered directly out of user space. Registration functions are used to provide the macros with the address of middleware-specific information such as the number of primary and secondary rollbacks, the number of aborts, PAT values, etc. 6
EVALUATION
The GTW application used in our evaluation experiments is a simulation of a personal communication services (PCS) network. A PCS network provides wireless communication services for nomadic users. For a detailed explanation of the PCS model, we refer the reader to (Carothers et al. 1995). The PCS simulation is configured with 4096 LPs into 64 cluster of 64 LPs each. In all experiments, we used a combination of 4 SGI Indy workstations processors and 4 Sun Ultra1 workstations, giving a total of 8 machines used in all experiments.
Visualizing Parallel Simulations in Network Computing Environments
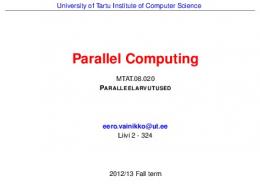
Figure 3: PCS Application After BGE
differs by less than 1%). However, in examining the rollback performance metrics, a much different picture emerges. In the case of events rolled back, the PVaniM-GTW monitored runs are 17% lower than the non-monitored runs and the number of cancelled events is 13% lower. At first glance it appears PVaniM-GTW is grossly perturbing the rollback performance metrics. However, closer examination of the data reveals that rolled back events account for only 3% of the GTW’s overhead computations. Consequently, for these experiments, rollback performance metrics have little effect on overall performance. Thus, in this case, perturbation of these statistics is acceptable. 6.2
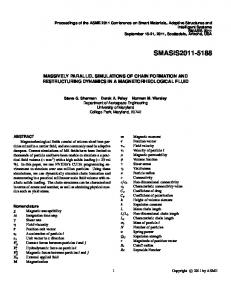
Figure 4: Views) 6.1
PCS Application After BGE (Toggled
Perturbation Results
In our perturbation experiments the machines were unloaded by other users and the local area network was lightly loaded. To minimize the potential of masking any of PVaniM-GTW’s overheads, we turned the BGE algorithm off. In this mode, the BGE data was collected for use by PVaniM-GTW, but LP clusters were never migrated. To maximize PVaniMGTW’s potential for perturbing the simulation, we set the sampling interval to one second which is currently it’s smallest possible value, as well as enabled PVaniM’s tracing which is used solely by its postmortem views. Each simulation run processes about 27,000,000 events. The results of our perturbation experiments are shown in Table 1. Here, we observed that PVaniMGTW only increases the execution time by less than 2.0%. Should the sampling interval be increased to 5 or 10 seconds, there would be even less an effect on execution time. In examining the other performance metrics, aborted events accounted for most of the overhead. Of the 27,000,000 events processed, about 5,000,000 (15%) where aborted. We observe the PVaniM-GTW monitored runs producing about the same number of aborted events as the non-monitored runs (only
115
Using Combinations of On-line Views
The most significant contribution made by this visualization system is its ability to enable the end-user to draw inferences and make conclusions about the factors effecting the performance of our GTW system and the BGE algorithm. Using PVaniM-GTW , we are able to make the following observations about the BGE algorithm’s “hows” and “whys” and provide a behavioral picture of our GTW system and the BGE algorithm. In particular, the following scenario described below (shown in Figures 1- 4) demonstrates a case where the GTW system and BGE algorithm do not perform as expected. Figures 1 and 2 show the GTW system at initial start-up before any LP-cluster migrations have been issued by the BGE algorithm. Here, we observe that because of the difference of processing power, the PAT values for host machines 4 − 7 (Suns) are much lower than for SGIs. Please note, host 8 (stthomas) is the BGE Policy Program and does not have a PAT value or LP clusters assigned to it. What is surprising, as shown in Figure 2, the Sun workstations are not rolling back, but instead aborting a large number of events (30% of all events processed are aborted). We determined the reason for this behavior lies with GVT being computed at a slow rate, particularly slow for the Suns. Because of this, the Suns are exhausting their supply of memory which prevents them from becoming “overly optimistic” and ensuing a cascade of rollbacks. We are currently examining techniques to speedup the time between successive GVT calculations. Now, to bring the PAT values back into equilibrium as well as mitigate the large number of aborted events, the BGE algorithm migrates several clusters off the SGI machines and onto the Suns. However, these LP-cluster migrations cause an unexpected side effect. The minimal communication pattern established at start-up (see Figure 1) has been corrupted
116
Carothers, Topol, Fujimoto, Stasko, and Sunderam
by migration of LP-clusters (see Figure 3), resulting in an increase in remote communications. Because of this increase, new computations are introduced into the GTW system which the BGE algorithm had not considered. Consequently, we observe multiple migration rounds before the PAT values are brought into equilibrium (shown in Figure 3). This phenomenon was unexpected since we were already grouping the LPs into clusters with a high degree of communication affinity. We did not anticipate the inter-cluster communications playing such an important role in BGE algorithm performance. We are currently modifying the BGE algorithm to consider inter-cluster communication patterns in the determination of which clusters to move and where to move them. With the PAT values being about equal, we expected to see a sharp drop in the number of aborted events. To our surprise, this expectation did not come true. Shown in Figure 4, the number of aborted events for the Sun workstations is still quite high, about 25%, down from 30%. The culprit for this phenomenon was the same as before: the time between successive GVT calculations is still too slow, despite the migration of workload off the slower SGI workstations. We believe by re-integrating the reflector thread’s functionality into the GTW kernel for uniprocessor platforms will sufficiently accelerate the rate of GVT calculations to reduce the likelihood of aborted events and ultimately improve GTW’s performance. 6.3
Sensitivity Tuning of BGE algorithm
Another area in which the PVaniM-GTW visualization system proved instrumental is in the design and selection of the BGE algorithm’s sensitivity parameters. In the original BGE algorithm for an LPcluster migration to be considered effective, it must have reduced the difference in PAT values between the source and destination processors by an amount greater than the user-defined migration, sensitivity factor, Sm . In experimenting with different settings of Sm , we observed that if the Sm was set too low, the BGE algorithm was overly sensitive to PAT value differences and would always issue LP-cluster migrations. To mitigate this problem we increased Sm . However, in by making the BGE algorithm less sensitive, the PAT values, reported by PVaniM-GTW, were never brought into complete equilibrium and consequently the load across the host machines was not properly balanced. It appeared that there was no happy medium. However, closer analysis of the BGE algorithm combined with the PAT value view generated by PVaniM-GTW revealed that we were attempting to
make two orthogonal decisions using the single Sm sensitivity parameter. The issues in question are as follows: (i) are the PAT values in a global sense sufficiently out of balance such that any cluster migration is necessary, and (ii) is a given LP-cluster migration effective? These issues, while seeming similar, must be considered separately. To this end, we modified the BGE algorithm to include a global sensitivity parameter, Sg , that examines the global difference in PAT values and determines whether or not GTW’s workload is sufficiently out of balance to consider any LP-cluster migrations. Operationally speaking, Sg , is a percent difference threshold. Thus, for any LP-migrations to be considered, (P ATmax − P ATmin )/P ATmin > Sg , where P ATmin is the minimum PAT value and P ATmax is the maximum among all host machines. Likewise, Sm is also a percent difference threshold. To experiment with the setting of Sg and Sm we again employed the use of PVaniM-GTW. With the addition of Sg , we could clearly see from the PAT value view that GTW was not overly sensitive to small load imbalances. Also, when a load imbalances did occur, we visually observed the BGE algorithm responding by migrating the appropriate LP-clusters and the PAT values being brought into equilibrium. Based on our experimental analysis using PVaniMGTW’s view, the proper settings for Sg range between 10% and 15% and for Sm range between 0.5% and 2% for the PCS model. A more comprehensive set of experiments is needed to establish a relationship between the model characteristics and the setting of the BGE algorithm’s sensitivity parameters. 7
CONCLUSIONS
This article has investigated the use of graphical visualization to provide insight into the execution of a simulator developed for network computing environments. Specifically, our investigation has focused on the augmentation of a general-purpose network computing visualization system with middleware-specific visualizations and has resulted in the PVaniM-GTW visualization system. The synergies provided by the general-purpose graphical views combined with the newly developed middleware-specific views have enabled us to provider more insight into PDES middleware than a generic network computing visualization system. Moreover, the end-user is able to utilize the new insights provided by the system for any simulation application without the expense of developing his or her own custom application-specific visualizations for purposes such as performance analysis and understanding simulator execution. We believe systems such as PVaniM-GTW that employ middleware-
Visualizing Parallel Simulations in Network Computing Environments specific views provide a cost-effective compromise between both extremes of the visualization tool spectrum. In this case study, PVaniM-GTW has enabled us to identify performance problems with the GTW system and weaknesses of the BGE algorithm.
117
This work was supported by U.S. Army Contract DASG60-95-C-0103 funded by the Ballistic Missile Defense Organization, U. S. Department of Energy Grant No. DE-FG05-91ER25105, and Army Research Office Grant DAAH04-96-1-0083
Thompson, W. 1993. A tutorial for modeling with the WITNESS visual interactive simulator. In Proceedings of the 1993 Winter Simulation Conference, 228-232. Topol, B., J. T. Stasko, and V. S. Sunderam 1997. The dual timestamping methodology for visualizing distributed applications. In Proceedings of the IASTED International Conference on Parallel and Distributed Systems - Euro-PDS ’97, 81-86. Topol, B., J. T. Stasko, and V. S. Sunderam 1996. Monitoring and visualization in cluster environments. Technical Report GIT-CC-96-10, Georgia Institute of Technology, Atlanta, GA.
REFERENCES
AUTHOR BIOGRAPHIES
Bellenot, S., and L. Duty. 1995. XTracker, A graphical tool for parallel simulations. In Proceedings of the 9th workshop on Parallel and Distributed Simulation, 191-194. Carothers, C., and R. M. Fujimoto. 1996. Background execution of time warp programs. In Proceedings of the 10th Workshop on Parallel and Distributed Simulation, 12-19. Carothers, C., R. M. Fujimoto, and Y.-B. Lin. 1995. A case study in simulating PCS networks using time warp. In Proceedings of the 9th Workshop on Parallel and Distributed Simulation, 87-94. Glavach, M. A., and D. T. Sturrock. 1993. Introduction to Siman/Cinema. In Proceedings of the 1993 Winter Simulation Conference, 190-192. Graham, J. H., A. S. Elmaghraby, I. Karachiwala, and H. Soliman. 1996. A visual environment for distributed simulation systems. Simulation Digest 25(3):13-22. Jefferson, D. R. 1985. Virtual time. ACM TOPLAS 7(3):404-425. Kraemer, E., and J. T. Stasko. 1993. The visualization of parallel systems: An overview. Journal of Parallel and Distributed Computing 18(2):105117. Mascarenhas, E., V. Rego, and J. Sang. 1995. DISplay: a system for visual-interaction in distributed simulations. In Proceedings of the 1995 Winter Simulation Conference, 698–705. O’Keefe, R. M. 1987. What is visual interactive simulation? (and is there a methodology for doing it right?). In Proceedings of the 1987 Winter Simulation Conference, 461–464. Schmidt, B. K., and V. S. Sunderam 1994. Empirical analysis of overheads in cluster environments. Concurrency: Practice & Experience 6(1):1-33. Sunderam, V. S. 1990. PVM: A framework for parallel distributed computing. Concurrency: Practice & Experience 2(4):315-339.
CHRISTOPHER CAROTHERS is a Research Scientist and Ph.D. candidate in the College of Computing at the Georgia Institute of Technology.
ACKNOWLEDGMENTS
BRAD TOPOL is a Ph.D. candidate in the College of Computing at the Georgia Institute of Technology. RICHARD FUJIMOTO is a Professor in the College of Computing at the Georgia Institute of Technology. JOHN STASKO is an Associate Professor in the College of Computing at the Georgia Institute of Technology. VAIDY SUNDERAM is a Professor of Mathematics and Computer Science at Emory University.