www.nature.com/scientificreports
OPEN
received: 19 October 2015 accepted: 14 March 2016 Published: 30 March 2016
Visualizing spatial distribution of alectinib in murine brain using quantitative mass spectrometry imaging Hiroaki Aikawa1,*, Mitsuhiro Hayashi1,2,*, Shoraku Ryu2, Makiko Yamashita2, Naoto Ohtsuka3, Masanobu Nishidate2,4,5, Yasuhiro Fujiwara6 & Akinobu Hamada1,2,5 In the development of anticancer drugs, drug concentration measurements in the target tissue have been thought to be crucial for predicting drug efficacy and safety. Liquid chromatography-tandem mass spectrometry (LC-MS/MS) is commonly used for determination of average drug concentrations; however, complete loss of spatial information in the target tissue occurs. Mass spectrometry imaging (MSI) has been recently applied as an innovative tool for detection of molecular distribution of pharmacological agents in heterogeneous targets. This study examined the intra-brain transitivity of alectinib, a novel anaplastic lymphoma kinase inhibitor, using a combination of matrix-assisted laser desorption ionization–MSI and LC-MS/MS techniques. We first analyzed the pharmacokinetic profiles in FVB mice and then examined the effect of the multidrug resistance protein-1 (MDR1) using Mdr1a/b knockout mice including quantitative distribution of alectinib in the brain. While no differences were observed between the mice for the plasma alectinib concentrations, diffuse alectinib distributions were found in the brain of the Mdr1a/b knockout versus FVB mice. These results indicate the potential for using quantitative MSI for clarifying drug distribution in the brain on a microscopic level, in addition to suggesting a possible use in designing studies for anticancer drug development and translational research. During the drug development process, determination of whether a new compound can reach its intended target or not is one of the key factors for obtaining the proof of mechanism and concept1. A previous study has shown that plasma drug concentrations do not accurately predict the exposure in some organs and tissues2. To determine drug exposure in the target tissues, today, homogenized tissues are now commonly used for quantitative assessments by liquid chromatography tandem mass spectrometry (LC-MS/MS). Although LC-MS/MS can accurately determine the average levels of a compound in a target organ or tissue, there is a disadvantage when using this technique, as there is a complete loss of the spatial information for the compound in the target tissue. When estimating the efficacy and safety of a compound, particularly for anti-tumor drugs, it is very important to know both the specific location of the compound and the concentration that is present at these points within the target tissue. In order to understand the complex biochemical interactions that occur between a drug and its target tissue, it is necessary to detect not only the level of exposure, but also the spatial distribution within the target tissue. Thus, the use of only LC-MS/MS analysis is insufficient for clarifying the behavior of compounds such as anti-tumor drugs3.
1 Division of Clinical Pharmacology and Translational Research, Exploratory Oncology Research and Clinical Trial Center, National Cancer Center, 5-1-1 Tsukiji, Chuo-ku, Tokyo 104-0045, Japan. 2Department of Molecular Imaging and Pharmacokinetics, National Cancer Center Research Institute, 5-1-1 Tsukiji, Chuo-ku, Tokyo 104-0045, Japan. 3 Shimadzu Techno-Research Inc., 3-19-2, Minamirokugo, Ohta-ku, Tokyo 144-0045, Japan. 4Translational Clinical Research Science & Strategy Dept., Chugai Pharmaceutical Co., Ltd., 200 Kajiwara, Kamakura, Kanagawa 2478530, Japan. 5Department of Medical Oncology and Translational Research, Graduate school of Medical Sciences, Kumamoto University, 1-1-1 Honjo, Chuo-ku, Kumamoto 860-8556, Japan. 6Strategic Planning Bureau, National Cancer Center, 5-1-1 Tsukiji, Chuo-ku, Tokyo 104-0045, Japan. *These authors contributed equally to this work. Correspondence and requests for materials should be addressed to A.H. (email:
[email protected])
Scientific Reports | 6:23749 | DOI: 10.1038/srep23749
1
www.nature.com/scientificreports/
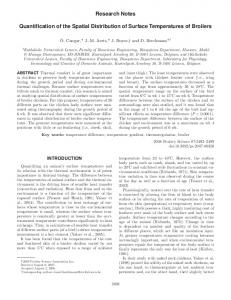
Figure 1. The plasma concentration of alectinib following oral administration in mice (FVB and Mdr1a/b (−/−)). (A) Chemical structure of alectinib. MW: 482.3. For the LC-MS/MS analysis, the main fragment, m/z 483.2 to 396.0, was chosen for quantitative purposes. (B) Plasma concentrations of alectinib in FVB mice (4 mg/ kg dose: filled circle, 20 mg/kg dose: filled squire) and in Mdr1a/b (− /− ) knockout mice (4 mg/kg dose: open circle, 20 mg/kg dose: open square). The plasma concentrations were measured by LC-MS/MS at 1, 1.5, 2, and 4 hours after an oral administration of alectinib. Data shown are the mean ± SD, n = 4.
Matrix-assisted laser desorption ionization mass spectrometry imaging (MALDI-MSI) is one of the newer innovative technologies that are highly sensitive and can provide mass spectrum information in two dimensions. This technology makes it possible to measure the distribution of diverse molecular species in a tissue section, including endogenous molecules at a specific time, without destroying the target tissue or requiring the use of target-specific molecular labeling reagents2,4–9. Even though this technique has proved to be beneficial, some challenges remain regarding the quantitative capability and reproducibility. Assessment of the drug concentration and distribution is not only of interest in tumors but also in the brain as well. The blood-brain barrier (BBB), in particular the multidrug resistance protein 1 (MDR1, also known as P-glycoprotein or ATP-binding cassette, sub-family B, member 1: ABCB1) has a central role in the drug distribution and transition to the brain parenchyma10. MDR1 is an important transporter protein located in the cell membrane that pumps many endogenous substances out of the cells. Moreover, this protein is highly expressed in various tissues, including the endothelial cells of the brain blood vessels and the intestinal epithelium10. While MDR1 has been shown to regulate the intestinal absorption of a wide variety of drugs, it has been frequently reported that the blood concentration of a drug does not necessarily correlate with the MDR1-determined substance properties11–16. For instance, a pharmacokinetics (PK) study showed that after administration of the anti-cancer drug, docetaxel, in FVB (wild-type, WT) and the Mdr1a/b knockout (KO) mice, there was no difference in the plasma concentrations. However, the brain concentrations in the Mdr1a/b KO mice were much higher than that observed in the FVB mice15. In our current study, we employed a quantitative MSI (qMSI) method in a preclinical mouse model to evaluate the intra-brain distribution of a new anti-cancer drug, the echinoderm microtubule-associated protein-like 4 and anaplastic lymphoma kinase (EML4-ALK) inhibitor, alectinib17–19, which was approved for use in Japan on July 4, 2014. Using serial sections, we used the combination of MALDI-MSI and LC-MS/MS techniques to facilitate inter-sample comparisons and improve reproducibility of the analysis, in addition to investigating the effect of MDR1 on the intra brain transitivity of alectinib in Mdr1a/b KO mice. The aim of this study was to examine the potential of utilizing qMSI to translate drug delivery evaluations for use in new drug development and practical applications.
Results
Pharmacokinetics of alectinib in mice. Recently, there has been an increased interest in the pharmacokinetics of anti-tumor drugs in the brain from an efficacy and toxicity viewpoint20,21. Therefore, our current study focused on alectinib, which was recently approved for the treatment of lung cancer in Japan (Fig. 1A). We performed a pharmacokinetic analysis of alectinib in FVB and Mdr1a/b KO mice; Plasma, cerebrospinal fluid (CSF), and brain tissue were collected 1, 1.5, 2, and 4 hours after a single oral administration of a 4 and 20 mg/kg dose. In mice, a 20 mg/kg administration of alectinib resulted in higher plasma concentrations as compared to a 4 mg/kg administration (Supplemental Table 1). There were no significant differences in the alectinib plasma concentrations observed between the FVB and Mdr1a/b KO mice at each dosage (Fig. 1B). The majority of the alectinib concentrations in the CSF were lower than the limits of quantitation (4 mg/kg group: 16/16 samples in FVB mice, 15/16 samples in Mdr1a/b KO mice; 20 mg/kg group: 9/16 samples in FVB
Scientific Reports | 6:23749 | DOI: 10.1038/srep23749
2
www.nature.com/scientificreports/
Figure 2. Alectinib distribution in the mouse brain at 4 hours after administration of a 4 mg/kg dose. (A,E) HE staining of sagittal brain sections from FVB and Mdr1a/b (− /− ) mice, respectively. (B,F) Molecular images of alectinib. (C,G) Molecular images of internal standard (IS). (D,H) qMSI images of alectinib. MSI data were acquired at a spatial resolution of 80 μm in the positive ion mode, and the optimal transition of alectinib used for the MALDI-MSI was m/z 483.3 to 396.2. In the qMSI images of alectinib, ion intensity was converted into the amount of alectinib by using LC-MS/MS analysis of serial sections.
mice, 7/16 samples in Mdr1a/b KO mice). In the samples that could be evaluated, there was no apparent correlation observed (Supplemental Table 2).
Use of qMSI to visualize alectinib distribution in the mouse brain. To determine alectinib tran-
sitivity into the mouse brain, we performed qMSI analysis (Methods and Supplemental Figure 1) using FVB and Mdr1a/b KO murine brain sections. Brain tissue collected included the cerebrum, cerebellum, and choroid plexus (Fig. 2). Alectinib qMSI was performed on mouse brains that were collected at 1, 1.5, 2 and 4 hours after the administration of alectinib (4 mg/kg, 20 mg/kg). There was a higher level of drug accumulation and a greater diffusion in the brain tissue section after the administration of 4 mg/kg of alectinib in the Mdr1a/b KO versus the FVB group (Fig. 2) (Supplemental Figure 2). After administration of 20 mg/kg of alectinib, there was a significantly increased alectinib exposure and diffused distribution of alectinib in Mdr1a/b KO versus FVB murine brains (Fig. 3). LC-MS/MS quantitation using serial sections of qMSI showed no obvious differences in section size among the samples (Supplemental Table 3) and indicated significantly higher average alectinib concentrations (per unit of section) in the Mdr1a/b KO murine brain versus the FVB brain under all conditions examined (Fig. 4) (Supplemental Figure 3). At 4 hours after administration of the 4 mg/kg (Fig. 4A) and the 20 mg/kg (Fig. 4B) doses, we observed an approximately a 20-fold (10.64 ± 1.58 vs. 0.53 ± 0.16 ng/mm3, P