Proceedings of the 20th Annual International Conference of the IEEE Engineering in Medicine and Biology Society, Vol. 20, No 4,1998
VISUALIZING SPATIALLY DISTRIBUTED HEMODYNAMIC LAG TIMES IN EVENT-RELATED FUNCTIONAL MRI: ESTIMATION OF A CHARACTERISTIC VISUAL “IMPULSE RESPONSE” Vince D. C a l h o ~ n ”Tiila ~ , Adali3, Michael Kraut2,Paul Rivkinl, Godfrey Pearlson’ Johns Hopluns University Div. of Psychiatric Neuro-Imaging, Baltimore, MD 2 1287 Johns Hopkins University 2Dept. of Radiology, Baltimore, MD 21282 ’University of Maryland Baltimore County Dept. of Electrical Engineering, Baltimore, MD, 21250 E-mail:
[email protected]
K
Abstract--Functional MRI is a technique capable of providing spatial and temporal information about the brain’s hemodynamics. It has been observed that the onset of observed signal changes can vary across regions exhibiting activation[11. We have developed a method for extracting information about these timing differences and for observing the temporal-spatial distribution of the blood response by characterizing a typical hemodynamic response (HR) to a single flash of light repeated at 30s intervals. We anatomically locate voxels in the primary visual cortex, a region located along the calcarine sulcus, which is the main terminus of the geniculocortical visual pathways. This average response profile is correlated with the data, producing a map of “active“ voxels. Next, we explore the distribution of lags by shifting the HR, correlating this signal with the data, and producing another map. We observed increased activation in non-primary visual cortex as the lag was increased to 2-3s. These results can be most effectively displayed in a time lapse movie. The described technique provides a way of determining varying hemodynamic lag times and partitioning “activated“ regions in time. It also clearly demonstrates that these time lags do differ spatially. I. INTRODUCTION Functional Magnetic Resonance Imaging (fMRI) of the brain is a technique sensitive to changes in the blood flow and oxygenation level and is most often used to compare groups of images in one state (“activated”) with those in another (“non-activated”), in a paradigm termed block design. Although useful, block design paradigms fail to exploit much of the information fMRI provides about the temporal nature of the hemodynamics. Researchers are now capitalizing on fMRI’s temporal resolution capacities by studying responses to single stimulus events[2]. This enables one to design paradigms analogous to those typically used in cognitive testing or EEG, for example. One can acquire images at the rate of 1 per second and capture information about the temporal properties of the hemodynamic response, a function which reaches a maximum at between four and seven seconds after the stimulus onset. We have developed a first approximation method to examine variations in the lag time of the hemodynamic response across regions of activation. Following a single light flash stimulus, there is a sequential response, first in the calcarine cortex and then other cortical areas. Our method is comprised of several stages including 1) extraction of the signal from the noise by filtering and time averaging, 2) formulation of a characteristic response curve by averaging the signals in visual cortex, 3) creation of activation maps by
0-7803-5164-9/98/$10.000 1998 IEEE
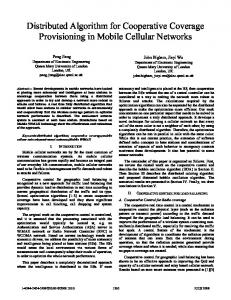
correlating the signal with time shifted versions of the characteristic response. We also discuss the application of linear systems theory to this data. In concluding, we present some applications of this method to the research of neuro psychiatric disorders. 11. METHODS We used a gradient-echo echo-planar pulse sequence with TR=ls, TE=39ms, a=90deg, FOV=24cm, 128x128, slice thickness=4mm. Five coronal oblique slices through the occipital lobe were thus acquired each second for a total of 500-760 seconds per “run”. Two or three runs were acquired in each of three subjects. The subjects were wearing LED goggles which were used to produce a single flash of red light, delivered to both eyes. A period of 30s elapsed between the stimuli to allow the hemodynamic response to decay. A total of 25 flashes were presented, thus providing 25 response curves. In addition, a high resolution T1weighted scan (TR=50Oms, TE=14ms, FOV=24cm, 256x256, slice thickness=4mm) with sections located at the same regions as the functional scan was acquired to assist in A 3D Spoiled-GRASS scan anatomic identification. (TR=35ms, TE=5ms, a=45deg, FOV=24cm, 256x256~124, slice thickness = I Smm) covering the entire brain was also acquired to assist in anatomical identification. Before analyzing the data, we correct them for motion via a frequency based algorithm[31. A. Signal Extraction We applied a bandpass filter to the time course of each voxel (periodic with a period of 30s, corresponding to the stimulus) with the frequency window centered on the inter stimulus frequency of the light flashes. The 25 epochs were then averaged temporally to produce a smoothed hemodynamic response function (See Fig. 1).
Fig. 1. Data from a single voxel in the calcarine cortex: raw (top left), filtered (bottom left), and averaged (right). Amplitude units of the averaged time course are normalized to a maximum of one and a baseline of zero.
2124
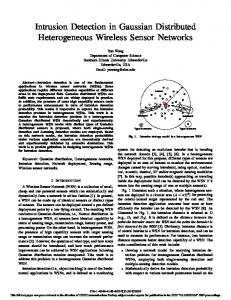
B. Formulation of Characteristic Impulse Response Function Anatomical identification of the calcarine cortex was performed on the T1 weighted image and then identified on the functional scans. We utilized a method similar to Boynton et. a1.[4] in determining the voxels upon which to characterize the shape of our impulse response. Those voxels in the visual cortex with the largest amplitude response were averaged to reduce the effect of volume averaging and noise. We verified that the shape and time course of the voxels in this region were quite similar to one another, demonstrating a similar time course for all the voxels in the calcarine cortex. The spatially averaged time course then represents a characteristic impulse response function (CIRF). (Fig. 2)
Fig. 2. Time courses from four regions in the calcarine cortex (Pl-P4) and the averaged response (CIRQ Amplitude units are normalized to a maximum of one and a baseline of zero.
C. Creation of Activation Maps Once the CIRF was created, consisting of 30 discrete time points, it was correlated with the smoothed hemodynamic response function at each voxel (i.e. the normalized covariance matrix was calculated), to produce a new image (the activation map) with correlation with a range of [-1,+1]. Voxels that are highly correlated are more likely to be activated. Upon thresholding the image to observe only those voxels most highly correlated (R > 0.7) with the CIRF we see the calcarine cortex is highly active. In addition, the data shown depict visual association areas exhibiting high
We then introduce a delay of 250 ms into the CIRF by interpolating the function to have a time resolution of 250 ms, introducing a delay, and reducing the temporal resolution to 1s. Since there are no data at the beginning of the function we set this to a value calculated by averaging the last 10 seconds of the CIRF, which approximates the baseline value. We then do a correlation with the new CIRF(250ms) and produce another map. This process is repeated in 250ms increments up to a value of 6 seconds, each time correlating with the CIRF(At) where At ranges from zero to six seconds. D. Linear Systems Analysis There has been recent interest in modeling the fMRI signal by treating the fMRI response of the brain over time as a linear time-invariant system, defined as a system exhibiting additivity and scaling. This is motivated by the powerful analysis techniques available for linear systems. It is important to note that in any type of system, if the input is a delta function the observed time course may be viewed as the impulse response of the system. Linearity allows one to separate this impulse response and generalize to any input. As a first approximation, the hemodynamic response does show evidence of linearity for stimuli of short duration although for longer stimuli, adaptation of the brain may violate this assumption[4]. Our goal, however, was to model only the time lags and thus the only assumptions we depend upon are time invariance to an impulse-type input and a finite “effective” impulse response whether the system is linear or not. For this study, we present a brief stimulus with a constant brightness as an approximation to a delta function. A shift of this function in time should produce a correspondingly delayed output with no assumption of linearity necessary provided the system has decayed back to initial conditions (represented by the equation below).
y[n]=T[h(n)]* y [ n + k ] = T [ d ( n + k ) ] (1) Time invariance assumption, T[] represents the system tranform function. 6(n) represents an impulse type input at t = n.
We are essentially testing for a “time-lock” between the input and the output. It is well known that in primary visual cortex, the response to a brief input produces a response reaching a peak 4-7 seconds later. We can evaluate the reproducibility of the time to reach this peak by observing a single voxel over 25 trials (a single flash followed by 30 seconds of darkness) and calculating the variance in the peak maximum which we measure to be between 0.7 and 0.8 seconds. This variance is primarily due to low signal to noise. If we compare averaged time courses in the same voxel the variance of the peak height variance becomes insignificant. Two ten average time courses (N=10) from the same voxel are presented in Fig. 4.
Fig. 3. Activation map produced by correlating with characteristic hemodynamic response function. Surface rendering of high-resolution image depicts the slices scanned and the displayed slice. The scale reflects the correlation coefficient of the voxels. Note the activation in primary visual cortex (Vl).
21 25
Fig. 4. Two different average time courses (n = 10) from the same voxel in the calcarine cortex. Amplitude units are normalized to a maximum of one and a baseline of zero. Notice the tight correspondence of the initial peaks
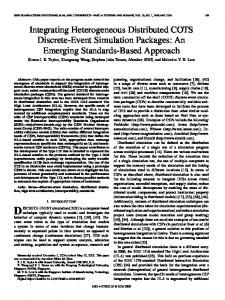
region. As the CIRF is shifted, regions corresponding to the angular gyrus, as well as posterior middle temporal gyri, increase in correlation, with a maximum occurring at 2s after the calcarine cortex maximum. The data are consistent with the notion that the angular gyrus is an integration area and thus would be activated later than the primary visual cortex. It’s also intriguing to note that a lesion in the angular gyrus can produce word blindness. However, a detailed study of the processes occurring is beyond the scope of this methods paper. Also, caution is warranted in making a statement about the temporal sequence of the underlying neurophysiologic phenomena, as the electrical activity happens on a much faster time scale than the hemodynamic response.
This gives us confidence that the lags in a given voxel are consistent at the stimulus rate of this experiment and thus provide useful information about the lag times induced by the system itself. Notice the variability in the second peak, indicating a need to average over the entire time course of the experiment. This second peak does appear consistently in the calcarine cortex upon sufficient averaging. This tight stimulus time response is also observed in more stringent tests by observing the response in primary visual cortex to one or more flashes of light with a 1-2 second inter flash time. If the response to two flashes separated by a time At is the same as the response from a single flash added to a Atshifted version of itself, the additivity property is supported. While we aren’t dependent upon this property in our lag analysis, it does provide additional support for the tight time invariance of the system. The results are shown in Fig. 5. We observed that the hemodynamic response decayed to the baseline after approximately 20 seconds in the calcarine cortex (indicating a finite system impulse response). We presented a single flash separated by 30s to allow the system to decay effectively to zero prior to the next stimulus and to provide a baseline region for time shifting (discussed later).
Fig. 6 . Binary activation maps at three lag times, Os (top left), 1.75s (top right), and 3.25s (bottom left). The functions are displayed in the lower right picture. Arrows indicate Primary Visual (Vl), Visual Association (VA), & Angular Gyrus (AG) regions.
Fig. 5. Averaged response from a 1 flash and a 3 flash trial and the 3 flash trial estimated from the 1 flash trial. Amplitude units are normalized to a maximum of one and a baseline of zero.
IV. RESULTS & DISCUSSION The data from one subject is presented in Fig. 6. These are data with three lag times: Os, 1.75s, and 3.25s. The primary visual cortex (Vl) has the strongest initial correlation, as well as several regions in the visual association
Our method also facilitates a dynamic (cine) display of the data, perhaps appropriate for the functional nature of the results, By presenting the activation maps in a temporal sequence and displaying them in real time, the time shifts can be more effectively observed. Our characteristic impulse response (derived from primary visual cortex) consistently resembled a damped sinusoid with an initial peak, an undershoot, and a second smaller peak. The hemodynamic response has been previously modeled as a Poisson distributions. We observed some differences in the amplitude of this second maximum across subjects, although a detailed analysis has not yet been performed. In addition, there are also spatial differences in
2126
some features of the response, varying from a damped sinusoid in primary visual cortex to a Poisson response with a slight second hump in the angular gyrus. There is probably a family of responses which need to be considered. Our model, as a first approximation, capitalizes on the similarities of the responses (the initial peak). More complicated models will result in better discrimination between different response shapes, and detection of lags. A constrained parameterization of the shape of the response will produce higher correlation with activated regions, for example. The lag times can be characterized by observing the time to maximum of these functions. The high pass filtering process can also be improved by using an adaptive technique such as least mean squares.[61 V. CONCLUSION & APPLICATIONS By utilizing the visual system and presenting a very simple stimulus, we present a way to characterize the impulse response of the primary visual cortex to a bright pulse of light. The brain is a distributed system which must be modeled as multiple cascaded systems with varying parameters. However, there are some similarities in the shapes of the responses of different regions, most notably its initial rise to a maximum and its smaller second peak. As a first approximation, we use a model that allows for delays to vary over the voxels of the brain in order to visualize the time course of events. There are significant differences between the time of the first maximum (calcarine cortex) and later maxima. We find sequential peaks correlated with an averaged waveform derived from initial calcarine activation profiles. We have demonstrated that the lags are not randomly distributed, but that there is a particular pattern to them with the initial response occurring in the calcarine cortex and delayed responses occurring in other cortical regions. This method may be extended to other types of stimuli as well, provided one presents a short stimulus and can define an anatomical region in which to create a CIRF. It is also possible to model the hemodynamic response independent of the individual response and identify temporal sequencing[11. The advantage of using a CIRF is that the shape of the wave may change between individuals. We have observed some differences in the subjects we scanned, especially in the second peak. Abnormalities in the activation patterns of the primary and association visual cortices have been noted in fMRI and PET studies of individuals with various neuro-psychiatric disorders. Specifically, flashing light visual stimuli provoke increased activation in schizophrenic subjects compared to controls[7]. Subjects with Alzheimer’s disease also show abnormal activation patterns in experiments studying activation as a function of flash frequency[8]. These and other functional imaging studies of neuro-psychiatric disorders typically employ block design experimental paradigms, which may fail to detect characteristic spatio/temporal response abnormalities associated with specific neuro-psychiatricdisorders. More work is needed in order to formulate general rules relating the underlying hemodynamic and neurophysiologic processes, including corroboration and combination with techniques that provide a more direct measure of electrical activity at high temporal resolution (EEG or MEG).
Although the attributes of a linear system are attractive, one must be cautious in making this assumption. The known non-linear relationship between stimulus intensity and the neuronal firing rate needs to be considered. In addition, the relationship between the neuronal firing and the observed fMRI responses are under active investigation. We have not assumed linearity in this experiment, but only time invariance in order to create maps dependent upon differences in the onset of the response. It is clear that electrical activity occurs on the order of tens to hundreds of milliseconds and thus these maps are not simply a blurred response to electrical activity. However, fMRI is capable of good temporal resolution as well as excellent spatial resolution. We have demonstrated a way to extract temporal information from fMRI signal changes, which may provide more complete information about the timing of neural processing in the brain. REFERENCES [l] D.L. Schacter, R.L. Buckner, W. Koutstall, A.M. Dale, B.R. Rosen, NeuroImage, 1998 (in press). [2] Rosen B, Buckner R, Dale A, “Event-relatedfunctional MRI: Past, present, and future“,PNAS, vol. 95, pp. 773780, February 1998. [3] V. Calhoun, T. Adali, G. Pearlson, “A Frequency space Approach for motion correction in Functional MRI”, to appear in Proc. IMDSP, July 1998. [4] G. Boynton, S. Engel, G. Glover, D. Heeger, “Linear Systems Analysis of Functional Magnetic Resonance Imaging in Human V l “ , The Journal of Neuroscience, vol. 16(13), pp. 4207-4221, July 1, 1996. [5] K.J. Friston, P. Jezzard, R. Turner, “Analysis of functional MRI time series“,Human Brain Mapping, vol. 1, pp. 153-171, 1994. [6] C. Vaz, X. Kong, N. Thakor, “An Adaptive Estimation of Periodic Signals Using a Fourier Linear Combiner”, ZEEE Trans on Signal Processing, vol. 42(1), January 1994. [7] P. Renshaw, D. Yurgelun-Todd, B. Cohen, “Greater hemodynamic response to photic stimulation in SchizophrenicPatients: An Echo planar MRI Study“,Am J Psychiatry vol. 151(10), October 1994. [8] M.J. Mentis, B. Horwitz, et. al., “Visual Cortical Dysfunction in Alzheimer’s Disease Evaluated With a Temporally Graded “Stress Test” During PET”, Am J Psychiatry, vol. 153(1), pp. 32-40, January 1996.
2127